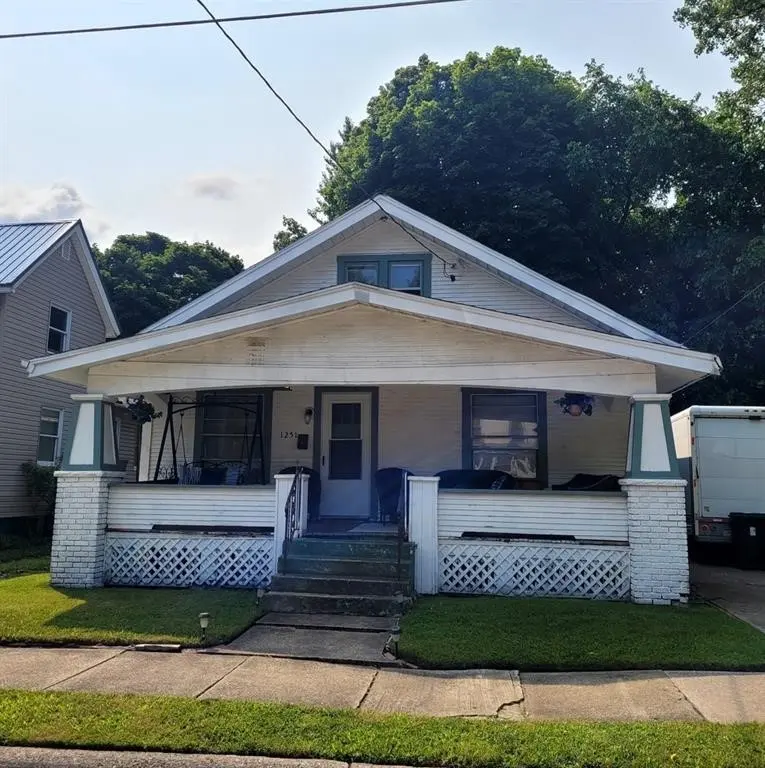
1251 E 22nd St · Erie, PA
Flood risk 1/10 · Minimal
- FEMA flood zone
- X (unshaded)
- Chance of flooding over 30 yrs
- 0.0%
- Est. flood insurance / yr
- $473 – $860
Fire risk 1/10 · Minimal
- Est. fire insurance / yr
- $511 – $949
Heat risk 3/10 · Minor
- Hot days now (above 90°F)
- 7 days/yr
- Hot days in 30 yrs
- 17 days/yr
Wind risk 1/10 · Minimal
- Chance of severe wind over 30 yrs
- —
Air-quality risk 4/10 · Minor
- Unhealthy air days now
- 3 days/yr
- Unhealthy air days in 30 yrs
- 7 days/yr
Risk factors via First Street. Map © Google.
Why this score? — see what drove the C- grade
The composite is a weighted blend of 9 inputs, each scored 0–100. Each bar is that input's sub-score; the figure is the points it added to the 100-point composite (weight × sub-score).
- ARV discount +15.0/15.0
- Cash flow +12.0/30.0
- Appreciation +7.9/10.0
- Livability +4.2/5.0
- DSCR +3.6/10.0
- 1% rule +3.1/10.0
- Rent growth +2.5/5.0
- Condition / age +2.5/5.0
- Schools +1.3/10.0
$105,000
🖨 Deal sheet (PDF) 📄 Offer letter ✓ Due diligence
Listing remarks MLS
Cute Cape! Relax on the covered front porch! Living room with updated carpet, dining room with hardwood floor, 2 bedrooms and a full bath on the 1st floor. Plus an upstairs bedroom. Forced Air Gas furnace-5yrs, 100 Amp-2017, newer plumbing. Off street parking.
Key facts
- 4,356 sq ft lot
- 2 parking spots
- Built 1920
Property features AI
Exterior
- Parking: 2 parking spaces
- Security: Fire alarm
- Utilities: Public water; Public sewer; Natural gas available
- Home design: Single-family residence; One and one-half story
- Construction: Frame construction
- Exterior features: Landscaped lot; Paved road access; Composition roof
Interior
- Flooring: Carpet; Hardwood
- Bathrooms: 1 full bathroom
- Heating & cooling: Forced air heating; Has heating
- Interior features: Carpet and hardwood flooring; Full basement; 8 total rooms
Neighborhood map
What this means for you Summary
Snapshot
- This is a 2-bed/1.0-bath single-family listed at $105k.
Deal economics
- At list price, monthly cash flow is $-25 ($-296/yr) — negative.
- To cash-flow at today's rent, offer at most $101k (4.2% below list).
- To meet the 1% rule (rent ≥ 1% of price), the offer needs to be $85k (18.8% below list).
- Recommended offer: $85k (18.8% below list) — sets the bar for 1% rule.
Location & tenants
- Location reads 83/100 on livability (#109 in PA, #840 nationally) — a professional / high-income tenant draw. Strengths: amenities A+, commute A+, cost of living A+; Watch: crime D+, employment F.
- Erie City SD (urban): math 12% / reading 19% proficiency, ranked #510 of 539 in PA (top 95%) — low school quality limits family demand, transient renter base, plan for 1-2y turnover; 81% free/reduced lunch — lower-income household profile, screen leases tightly.
- Zoned schools: Mckinley El Sch (math 6% / reading 13%, grade F, #1,453 of 1,518 statewide, top 96%, 459 students, 100% FRL); Woodrow Wilson Ms (math 5% / reading 19%, grade F, #489 of 512 statewide, top 96%, 756 students, 100% FRL); Northwest Pa Collegiate Academy (math 82%, 753 students, 100% FRL) — zoned schools average 100% FRL vs 81% district-wide (19 pts higher); higher-poverty schools than district average — tighter screening recommended.
- Market conditions: 48 active listings in the ZIP; 6 comparable units currently listed for rent nearby; rentals lingering (median 46d on market — plan ~5-8 weeks vacancy on turnover, expect pricing pressure); 100% of comp listings sitting > 30 days — soft ceiling on asking rent; 364 units permitted in Erie County in 2024 (188 in 5+ unit buildings).
Forward outlook
- In year one you build about $7k of equity ($726 loan paydown + $6k appreciation (5.7% local appreciation)).
- Erie County population projected at -14% by 2050 — secular population decline; favor cash flow + early exit over multi-decade hold.
- At projected returns (5.7% appreciation + 3.0% rent growth), your $29k cash investment doubles in ~4 years — after that, you're playing with house money.
- By year 6, paydown + projected appreciation supports a ~$37k cash-out refi (75% LTV) — recoverable capital for the next deal without selling this one.
Negotiation context
- It's been on market 19 days — a 2% lower offer ($103k) is reasonable based on typical stale-listing flexibility.
- 2 sale attempts since 3y ago with the ask held roughly flat each time — persistent listings suggest the price (not the market) is what's stuck; bring a comps-based counter.
- Current owner paid $35k; list at $105k implies a 200% gain — meaningful room to come down on a strong offer.
Risks & watch-outs
- Watch-outs: built in 1920 — expect roof / HVAC / electrical / plumbing capex.
Questions for the listing agent
- What do current leases actually rent for vs. the listed asking? Can we see a recent rent roll and the last 12 months of T-12 income?
- Built in 1920 — when were the roof, HVAC, electrical panel, plumbing, and water heater last replaced?
- Is there a deadline driving the sale (1031 exchange, divorce, estate, relocation)? That informs how much negotiation room exists.
- Crime grade is D in this area — have there been break-ins, vandalism, or insurance claims at this property in the last 3 years? What carrier currently insures it and at what premium?
- What's the average days-on-market for RENTAL listings here right now (not sales)? A rising rental-DOM trend means longer vacancies and softer asking-rent achievability than the comps imply.
- What's the recent tenant-quality profile in this submarket — average credit score on applications, eviction rate, late-payment / NSF rate, and stable-employment percentage? A property-management company in the area should have these aggregated.
- How much new for-sale + rental construction is in the pipeline within 1–3 miles? Heavy new supply typically softens prices + rents 12–24 months out; constrained supply supports both.
Investment metrics
- 1% rule
- 0.81% ✗
- Cap rate
- 6.01%
- Cash-on-cash
- -1.01%
- DSCR
- 0.96
- GRM
- 10.3
CMA / ARV
- ARV (on-the-fly)
- $135,240
- Comps found
- 12
Show comp detail 12 sales within ~0.75 mi
| Address | Dist | Beds/Ba | Sqft | Sold | Price | $/sf | Match |
|---|---|---|---|---|---|---|---|
| 1246 E 28th St | 0.37mi | 2/1.0 | 1,176 (0%) | 0mo | $139,900 | $119 | 82 |
| 1060 E 24th St | 0.30mi | 3/1.0 (+1) | 1,200 (+2%) | 3mo | $35,000 | $29 | 75 |
| 2925 Pennsylvania Ave | 0.56mi | 3/1.0 (+1) | 1,157 (-2%) | 2mo | $133,000 | $115 | 65 |
| 1417 E 28th St | 0.44mi | 3/1.0 (+1) | 1,116 (-5%) | 2mo | $150,000 | $134 | 64 |
| 2807 East Ave | 0.55mi | 3/1.0 (+1) | 1,172 (-0%) | 7mo | $137,000 | $117 | 63 |
| 1021 E 31st St | 0.67mi | 3/1.0 (+1) | 1,176 (0%) | 2mo | $130,900 | $111 | 62 |
| 2623 Perry St | 0.60mi | 3/1.0 (+1) | 1,201 (+2%) | 6mo | $100,000 | $83 | 58 |
| 1033 E 29 St | 0.55mi | 3/2.0 (+1) | 1,232 (+5%) | 1mo | $180,000 | $146 | 56 |
| 972 E 32nd St | 0.74mi | 3/1.5 (+1) | 1,200 (+2%) | 4mo | $135,000 | $113 | 52 |
| 1250 E 32nd St | 0.64mi | 2/1.0 | 1,056 (-10%) | 4mo | $65,000 | $62 | 50 |
| 1449 E 31st St | 0.65mi | 3/1.0 (+1) | 1,056 (-10%) | 2mo | $171,500 | $162 | 46 |
| 834 E 28th St | 0.71mi | 3/1.0 (+1) | 1,320 (+12%) | 0mo | $60,000 | $45 | 42 |
Match score weights: distance 35% · size 25% · config 20% · recency 20%. Top-matched comps best support the ARV.
Projected returns pro-forma
5.73% appreciation · 3.0% rent growth · sell at horizon
- IRR
- 13.9%
- Equity multiple
- 1.92×
- Total profit
- $27,062
- Equity at exit
- $64,224
- IRR
- 14.4%
- Equity multiple
- 3.77×
- Total profit
- $81,296
- Equity at exit
- $114,958
Cash invested: $29,400 (down + closing). Projections, not guarantees.
Landlord ↔ Tenant lean methodology
- Overall (STATE)
- 62 Landlord-Friendly
- State Pennsylvania
- 62 Landlord-Friendly · EVEN
- County
- — inherits STATE
- City
- — inherits STATE
ZIP-level market 16503
- Home prices YoY
- 4.4%
- Active inventory
- 48
- Price-to-rent
- 10.3×
Monthly cashflow live
- Estimated rent
- $853 high interval (Pro) →
- Mortgage (P&I)
- −$551
- Tax from tax record
- −$104 /mo · $1,246/yr
- Insurance
- −$44
- HOA
- −$0
- Vacancy / Maint / Mgmt
- −$179
- Net cashflow
- $-25
Break-even live
Sensitivity live
| Price | -10% $35 | -5% $5 | +0% $-25 | +5% $-54 | +10% $-84 |
|---|---|---|---|---|---|
| Rent | -10% $-92 | -5% $-58 | +0% $-25 | +5% $9 | +10% $43 |
| Rate | -1.0pp $28 | -0.5pp $2 | base $-25 | +0.5pp $-52 | +1.0pp $-80 |
UW: 25.0% down · 7.5% · 30yr · 1.5% tax · 5.0% vac · 8.0% maint · 8.0% mgmt
Financing live
Cash to close
- Down payment
- $26,250
- Closing costs
- $3,150
- Reserves months
- —
- Total cash needed
- —
Loan-product check · same deal, 3 products live
Conventional
25% down · 7.5% · 30yr
- Down + closing
- —
- Monthly P&I
- —
- Monthly cashflow
- —
- DSCR
- —
- Eligible?
- —
Personal DTI + credit; lowest rate.
DSCR
20% down · 8.5% · 30yr
- Down + closing
- —
- Monthly P&I
- —
- Monthly cashflow
- —
- DSCR
- —
- Eligible?
- —
No personal income docs; deal must DSCR.
Hard money
10% down · 12.0% · 12mo
- Down + closing
- —
- Monthly P&I
- —
- Monthly cashflow
- —
- DSCR
- —
- Eligible?
- —
Short-term bridge; refi at stabilization.
Rent comps 6 comps
| Address | Beds | Baths | Sqft | Rent | $/sqft | DOM | Units | Dist |
|---|---|---|---|---|---|---|---|---|
| 626 E 23rd St Unit 2 Erie, PA | 3.0 | 1.0 | 850 | $800 | $0.94 | 45d | 1 | 0.89mi |
| 614 E 22nd St Unit 1 Erie, PA | 3.0 | 1.0 | 1300 | $1,000 | $0.77 | 45d | 1 | 0.91mi |
| 612 E 14th St #1 Erie, PA | 3.0 | 1.0 | 775 | $850 | $1.10 | 45d | 1 | 1.07mi |
| 1404 E Lake Rd Unit 2 Erie, PA | 2.0 | 1.0 | 800 | $750 | $0.94 | 45d | 1 | 1.15mi |
| 407 E 13th St Unit 2 Erie, PA | 2.0 | 1.0 | 750 | $850 | $1.13 | 45d | 1 | 1.33mi |
| 519 E 6th St Unit 3 Erie, PA | 2.0 | 1.0 | 900 | $775 | $0.86 | 45d | 1 | 1.50mi |
Listing history 15 events
-
2026-06-21days on market $105,000 Active 19 DOM
-
2026-06-19days on market $105,000 Active 17 DOM
-
2026-06-18days on market $105,000 Active 16 DOM
-
2026-06-17days on market $105,000 Active 15 DOM
-
2026-06-16days on market $105,000 Active 14 DOM
-
2026-06-15days on market $105,000 Active 13 DOM
-
2026-06-14days on market $105,000 Active 11 DOM
-
2026-06-13days on market $105,000 Active 10 DOM
-
2026-06-10days on market $105,000 Active 8 DOM
-
2026-06-09days on market $105,000 Active 7 DOM
-
2026-06-08days on market $105,000 Active 6 DOM
-
2026-06-07days on market $105,000 Active 5 DOM
-
2026-06-05days on market $105,000 Active 2 DOM
-
2026-06-03remarks 337-char remark
-
2026-06-03$105,000 Active 1 DOM
ⓘ Source: listings_history table (triggers on properties + properties_extension) + one-shot
backfill from property_details.listing_events for pre-trigger history.
Tax reassessment forecast PA · Partial reset (capped growth)
- Current annual tax
- $1,246 · $104/mo
- Projected year-2 tax
- $1,453 · $121/mo
- Expected delta
- +$206/yr (+$17/mo · 16.5%)
ⓘ Screening estimate from a state-policy table — verify with the county assessor before closing.
Climate risk First Street
- Flood 1/10 Low FEMA zone X (unshaded) · 0% chance over 30 yrs
- Wildfire 1/10 Low
- Heat 3/10 Moderate 7 d/yr ≥90°F today · 17 d/yr by 30 yrs out
- Wind 1/10 Low
- Air quality 4/10 Moderate 3 unhealthy d/yr today · 7 by 30 yrs out
Nearby sold comps map
Loading sold comps map…
Walkable amenities ~0.75 mi
Loading nearby amenities…
Taxation est. · year 1
- Rental income
- $10,231
- − Mortgage interest
- −$5,882
- − Property taxes
- −$1,246
- − Insurance
- −$525
- − Repairs & maintenance
- −$818
- − Management
- −$818
- − Depreciation
- −$3,055
- Taxable loss
- −$2,113
- Est. tax savings @ 24.0%
- +$507
- After-tax cash flow
- $211/yr
For passive investors: Depreciation is non-cash, so a rental often shows a tax loss while cash-flowing — sheltering income. Rental losses are passive: they offset passive income freely, and up to $25,000/yr can offset ordinary (W-2) income if you actively participate and your MAGI is under $100k (phasing out to $0 by $150k); unused losses carry forward. On sale, claimed depreciation is recaptured at up to 25%, and gains may owe capital-gains tax (a 1031 exchange can defer both). Figures are a year-1 estimate at your 24.0% rate — not tax advice; consult a CPA.
Schools (NCES district)
- District
- Erie City SD
- NCES district ID
- 4209300
- Math proficiency
- 12% ▼ -11.00%
- Reading proficiency
- 19% ▼ -16.00%
- Median HH income
- $33,625
- Composite
- 12.59/100
- National rank
- #9617
- State rank
- #510 of 539 in PA
Livability — Erie
- Score
- 83/100
- State rank
- #109
- US rank
- #840
Category grades
Schools grade is shown separately in the Schools card above.
Census & demographics
- Census place
- Erie, PA
- City population
- 92,215
- Population (ZIP)
- 15,204
Population outlook (Erie County) Hauer SSP2
- Today (2025)
- 272,159 people
- By 2030
- 266,299 · -2.2%
- By 2040
- 250,987 · -7.8%
- By 2050
- 234,925 · -13.7%
- By 2075
- 199,164 · -26.8%
- By 2100
- 162,985 · -40.1%
Race, ethnicity, and origin ACS 2023
- Neighborhood character
- Diverse neighborhood (Simpson 0.65)
- Race & ethnicity
- White 45% Black 37% Hispanic / Latino 10% Two or more races 8% Asian 2%
- Hispanic origin (detail)
- Mexican 2% Puerto Rican 7%
- Common ancestry
- Romanian 6% Scotch-Irish 1% Lithuanian 1%
- Foreign-born
- 6% · India, Canada
- Languages at home
- 90% English-only · Spanish 4% Arabic 2% Other Indo-European 2%
Political lean MEDSL · Erie
- 2024 margin
- Toss-up / Even · D 49.0% · R 50.0%
- 2008→2024 swing
- -20.9pp toward R · 2008: 19.9pp · 2024: -1.0pp
- All cycles
- 2024: R+1.0 2020: D+1.0 2016: R+2.0 2012: D+16.9 2008: D+19.9
Not yet ingested
- Civics
- —
Market trends
- HPI YoY
- ▲ 5.73%
- Current HPI
- 135.5955
- Rent YoY
- —
- Metro
- —
- State GDP YoY
- ▲ 1.68%
- F500 in state
- 34
Industry mix (Fortune 500 HQ in PA)
| Industry | F500 HQs | Revenue |
|---|---|---|
| Healthcare | 2 | $309B |
|
||
| Insurance | 2 | $27B |
|
||
| Telecommunications / Media | 1 | $124B |
|
||
| Industrial Distribution | 1 | $22B |
|
||
| Financial Services | 1 | $20B |
|
||
| Chemicals / Materials | 1 | $18B |
|
||
Price history
+144.8% since first listed4 events — show timeline
- 2026-06-02 Listed $105,000 GEBOR
- 2023-10-16 Sold (MLS) $35,000 GEBOR
- 2023-08-24 Pending — GEBOR
- 2023-08-07 Listed $42,900 GEBOR
Property tax history
+1.9%/yrLatest (2026): $1,246 · +3.4% YoY. Source: county tax records.
Cash-flow waterfall
monthlySold comps — $/sqft
last 12 mo · ≤1 miLoading sold comps…