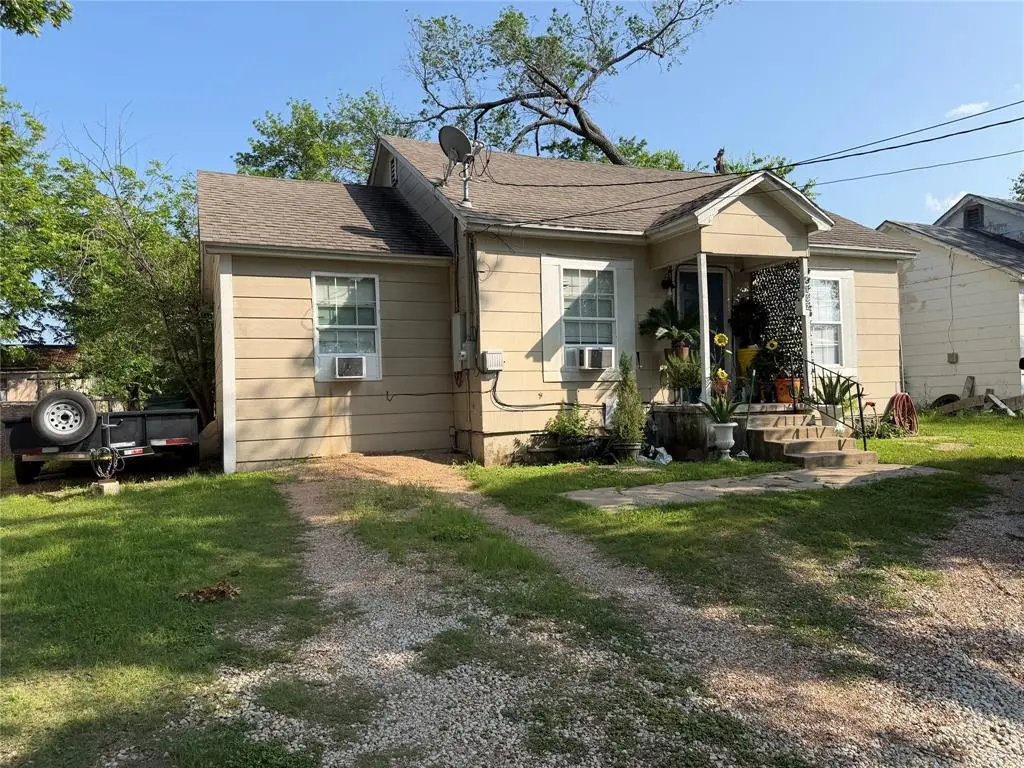
4102 Beverly Dr · Beverly Hills, TX
Flood risk 1/10 · Minimal
- FEMA flood zone
- X (unshaded)
- Chance of flooding over 30 yrs
- 0.0%
- Est. flood insurance / yr
- $507 – $1,088
Fire risk 1/10 · Minimal
- Est. fire insurance / yr
- $1,222 – $2,270
Heat risk 7/10 · Major
- Hot days now (above 108°F)
- 7 days/yr
- Hot days in 30 yrs
- 24 days/yr
Wind risk 6/10 · Moderate
- Chance of severe wind over 30 yrs
- 61.0%
Air-quality risk 2/10 · Minimal
- Unhealthy air days now
- 0 days/yr
- Unhealthy air days in 30 yrs
- 1 days/yr
Risk factors via First Street. Map © Google.
Why this score? — see what drove the F grade
The composite is a weighted blend of 9 inputs, each scored 0–100. Each bar is that input's sub-score; the figure is the points it added to the 100-point composite (weight × sub-score).
- Cash flow +6.9/30.0
- Appreciation +6.8/10.0
- Rent growth +3.2/5.0
- Livability +3.2/5.0
- Condition / age +2.5/5.0
- Schools +1.8/10.0
- 1% rule +1.5/10.0
- DSCR +1.1/10.0
- ARV discount +0.0/15.0
$169,000
🖨 Deal sheet (PDF) 📄 Offer letter ✓ Due diligence
Listing remarks
3 bedroom 1 bathroom home in 76711! Currently rented out, reach out to schedule a showing.
Key facts
- 0.25 acre lot
- Built 1942
- Listed 51 days
Property features AI
Finance
- Other: Property is vacant for sale (standard listing, possession at closing/funding); MLS status: Active
- Financial info: Treat as clear loan type; No second mortgage indicated
- HOA & community: No homeowner association
Exterior
- Parking: Driveway parking
- Utilities: City water; City sewer; No municipal utility district
- Home design: Single-family residence; Residential property; Built in 1942; One story
- Construction: Year built 1942
- Exterior features: Lot smaller than 0.5 acre (approximately 0.248 acres); Subdivision: Hiland
Interior
- Kitchen: No appliances included
- Bedrooms: 3 bedrooms (all on the main level)
- Bathrooms: 1 full bathroom
- Interior features: 6 total rooms; One-level layout; Living area with one living area and one dining area; Interior described as Other
- Laundry & utility: No specific laundry or utility appliances listed
Neighborhood map
What this means for you Summary
Snapshot
- This is a 2-bed/1.0-bath single-family listed at $169k.
Deal economics
- At list price, monthly cash flow is $-257 ($-3k/yr) — negative.
- To cash-flow at today's rent, offer at most $124k (26.9% below list).
- To meet the 1% rule (rent ≥ 1% of price), the offer needs to be $110k (34.6% below list).
- Recommended offer: $110k (34.6% below list) — sets the bar for 1% rule.
Location & tenants
- Location reads 63/100 on livability (#871 in TX) — a middle-class / working-renter tenant base. Strengths: cost of living A+, housing A+, health & safety A+; Watch: crime F, commute F, employment D-.
- Waco ISD (urban): math 20% / reading 24% proficiency, ranked #773 of 826 in TX (top 94%) — low school quality limits family demand, transient renter base, plan for 1-2y turnover; 81% free/reduced lunch — lower-income household profile, screen leases tightly.
- Zoned schools: Alta Vista El (math 12% / reading 12%, grade F, #4,207 of 4,322 statewide, top 98%, 545 students, 89% FRL, charter); Cesar Chavez Middle (math 16% / reading 24%, grade F, #1,428 of 1,662 statewide, top 87%, 840 students, 94% FRL); University H S (math 39% / reading 31%, grade F, #954 of 1,632 statewide, top 59%, 1,678 students, 89% FRL).
- Market conditions: Rents rising (+2.6%/yr); 43 active listings in the ZIP; 11 comparable units currently listed for rent nearby; rentals at typical pace (median 23d on market — plan ~3-4 weeks tenant-placement turnaround); 1,014 units permitted in McLennan County in 2024 (200 in 5+ unit buildings).
Forward outlook
- In year one you build about $7k of equity ($1k loan paydown + $6k appreciation (3.6% local appreciation)).
- McLennan County population projected at +17% by 2050 — long-run rental-demand tailwind backs the buy-and-hold thesis.
- By year 5, paydown + projected appreciation supports a ~$31k cash-out refi (75% LTV) — recoverable capital for the next deal without selling this one.
Negotiation context
- It's been on market 51 days — a 3% lower offer ($164k) is reasonable based on typical stale-listing flexibility.
Risks & watch-outs
- Watch-outs: built in 1942 — expect roof / HVAC / electrical / plumbing capex.
- Climate carrying-cost: major wind risk, 61% chance of damaging wind over 30y; extreme-heat days projected 7→24/yr by 2055 (HVAC capex compounding) — expect insurance premiums to compound above CPI over the hold.
Questions for the listing agent
- What do current leases actually rent for vs. the listed asking? Can we see a recent rent roll and the last 12 months of T-12 income?
- It's been on market 51 days. Have you received any prior offers? Is the seller open to a 35% concession, seller financing, or rate buy-down credit?
- Built in 1942 — when were the roof, HVAC, electrical panel, plumbing, and water heater last replaced?
- Is there a deadline driving the sale (1031 exchange, divorce, estate, relocation)? That informs how much negotiation room exists.
- Schools are F-rated, which usually means shorter tenancies and higher turnover. Who's the typical renter profile here, and what's been the actual vacancy rate?
- Crime grade is F in this area — have there been break-ins, vandalism, or insurance claims at this property in the last 3 years? What carrier currently insures it and at what premium?
- The area grade is low — what's the realistic commute time and amenity access for the typical tenant pool here? Any planned neighborhood developments (good or bad) we should know about?
- What's the average days-on-market for RENTAL listings here right now (not sales)? A rising rental-DOM trend means longer vacancies and softer asking-rent achievability than the comps imply.
- What's the recent tenant-quality profile in this submarket — average credit score on applications, eviction rate, late-payment / NSF rate, and stable-employment percentage? A property-management company in the area should have these aggregated.
- How much new for-sale + rental construction is in the pipeline within 1–3 miles? Heavy new supply typically softens prices + rents 12–24 months out; constrained supply supports both.
Investment metrics
- 1% rule
- 0.65% ✗
- Cap rate
- 4.47%
- Cash-on-cash
- -6.52%
- DSCR
- 0.71
- GRM
- 12.7
CMA / ARV
- ARV (median comp)
- $137,428
- List price
- $169,000
- Delta
- 22.97%
- Verdict
- OVERPRICED
- Comps
- 20 within 1.0 mi
Show comp detail 3 sales within ~0.75 mi
| Address | Dist | Beds/Ba | Sqft | Sold | Price | $/sf | Match |
|---|---|---|---|---|---|---|---|
| 1105 Spring Branch St | 0.37mi | 2/1.0 | 812 (+12%) | 10mo | $130,000 | $160 | 56 |
| 3513 James Ave | 0.69mi | 1/1.0 (-1) | 786 (+8%) | 6mo | $84,000 | $107 | 44 |
| 1801 Columbia St | 0.62mi | 2/1.0 | 811 (+11%) | 21mo | $168,000 | $207 | 35 |
Match score weights: distance 35% · size 25% · config 20% · recency 20%. Top-matched comps best support the ARV.
Projected returns pro-forma
3.57% appreciation · 2.62% rent growth · sell at horizon
- IRR
- 3.1%
- Equity multiple
- 1.18×
- Total profit
- $8,661
- Equity at exit
- $81,430
- IRR
- 6.2%
- Equity multiple
- 1.99×
- Total profit
- $47,045
- Equity at exit
- $129,898
Cash invested: $47,320 (down + closing). Projections, not guarantees.
Landlord ↔ Tenant lean methodology
- Overall (STATE)
- 87 Strongly Landlord-Friendly
- State Texas
- 87 Strongly Landlord-Friendly · R+5
- County
- — inherits STATE
- City
- — inherits STATE
ZIP-level market 76711
- Home prices YoY
- 1.4%
- Rents YoY
- 2.6%
- Active inventory
- 43
- Price-to-rent
- 12.7×
Monthly cashflow live
- Estimated rent
- $1,105 high interval (Pro) →
- Mortgage (P&I)
- −$886
- Tax from tax record
- −$173 /mo · $2,081/yr
- Insurance
- −$70
- HOA
- −$0
- Vacancy / Maint / Mgmt
- −$232
- Net cashflow
- $-257
Break-even live
Sensitivity live
| Price | -10% $-162 | -5% $-209 | +0% $-257 | +5% $-305 | +10% $-353 |
|---|---|---|---|---|---|
| Rent | -10% $-345 | -5% $-301 | +0% $-257 | +5% $-214 | +10% $-170 |
| Rate | -1.0pp $-172 | -0.5pp $-214 | base $-257 | +0.5pp $-301 | +1.0pp $-346 |
UW: 25.0% down · 7.5% · 30yr · 1.5% tax · 5.0% vac · 8.0% maint · 8.0% mgmt
Financing live
Cash to close
- Down payment
- $42,250
- Closing costs
- $5,070
- Reserves months
- —
- Total cash needed
- —
Loan-product check · same deal, 3 products live
Conventional
25% down · 7.5% · 30yr
- Down + closing
- —
- Monthly P&I
- —
- Monthly cashflow
- —
- DSCR
- —
- Eligible?
- —
Personal DTI + credit; lowest rate.
DSCR
20% down · 8.5% · 30yr
- Down + closing
- —
- Monthly P&I
- —
- Monthly cashflow
- —
- DSCR
- —
- Eligible?
- —
No personal income docs; deal must DSCR.
Hard money
10% down · 12.0% · 12mo
- Down + closing
- —
- Monthly P&I
- —
- Monthly cashflow
- —
- DSCR
- —
- Eligible?
- —
Short-term bridge; refi at stabilization.
Rent comps 11 comps
| Address | Beds | Baths | Sqft | Rent | $/sqft | DOM | Units | Dist |
|---|---|---|---|---|---|---|---|---|
| 700 S Valley Mills Dr Waco, TX | 1.0–2.0 | 1.0–1.5 | 850 | $995 | $1.17 | 15d | 2 | 0.54mi |
| 4900 Bagby Ave Waco, TX | 3.0 | 1.0–2.0 | 1026 | $1,525 | $1.49 | 23d | 1 | 0.97mi |
| 2201 Creekview Dr Waco, TX | 1.0–3.0 | 1.0–2.0 | 990 | $1,758 | $1.78 | 15d | 20 | 0.98mi |
| 3528 W Waco Dr Apt 207 Waco, TX | 1.0 | 1.0 | 500 | $950 | $1.90 | 23d | 1 | 1.06mi |
| 3638 W Waco Dr Waco, TX | 1.0 | 1.0 | 731 | $902 | $1.23 | 15d | 8 | 1.07mi |
| 508 N 38th St Waco, TX | 1.0 | 1.0 | 711 | $795 | $1.12 | 23d | 1 | 1.10mi |
| 508 N 38th St Unit 514-C Waco, TX | 1.0 | 1.0 | 711 | $750 | $1.05 | 23d | 1 | 1.10mi |
| 701 N New Rd Unit 201 Waco, TX | 1.0 | 1.0 | 650 | $795 | $1.22 | 45d | 1 | 1.29mi |
| 701 N New Rd Unit 101 Waco, TX | 1.0 | 1.0 | 598 | $995 | $1.66 | 23d | 1 | 1.29mi |
| 2812 W Waco Dr Unit 15 Waco, TX | 1.0 | 1.0 | 580 | $950 | $1.64 | 23d | 1 | 1.38mi |
| 3001 S New Rd Waco, TX | 1.0–3.0 | 1.0–2.0 | 885 | $1,490 | $1.68 | 15d | 15 | 1.47mi |
Listing history 20 events
-
2026-06-21days on market $169,000 Active 51 DOM
-
2026-06-18days on market $169,000 Active 48 DOM
-
2026-06-17days on market $169,000 Active 47 DOM
-
2026-06-16days on market $169,000 Active 46 DOM
-
2026-06-15days on market $169,000 Active 45 DOM
-
2026-06-14days on market $169,000 Active 43 DOM
-
2026-06-13days on market $169,000 Active 42 DOM
-
2026-06-10days on market $169,000 Active 40 DOM
-
2026-06-09days on market $169,000 Active 39 DOM
-
2026-06-08days on market $169,000 Active 38 DOM
-
2026-06-07days on market $169,000 Active 37 DOM
-
2026-06-05days on market $169,000 Active 34 DOM
-
2026-06-03days on market $169,000 Active 33 DOM
-
2026-06-02days on market $169,000 Active 32 DOM
-
2026-06-01days on market $169,000 Active 31 DOM
-
2026-05-31days on market $169,000 Active 30 DOM
-
2026-05-30days on market $169,000 Active 29 DOM
-
2026-05-01$169,000 Active 90-char remark
-
2017-11-27soldstatus
-
2009-06-05soldstatus
ⓘ Source: listings_history table (triggers on properties + properties_extension) + one-shot
backfill from property_details.listing_events for pre-trigger history.
Tax reassessment forecast TX · Resets to sale price
- Current annual tax
- $2,081 · $173/mo
- Projected year-2 tax
- $3,093 · $258/mo
- Expected delta
- +$1,011/yr (+$84/mo · 48.6%)
ⓘ Screening estimate from a state-policy table — verify with the county assessor before closing.
Climate risk First Street
- Flood 1/10 Low FEMA zone X (unshaded) · 0% chance over 30 yrs
- Wildfire 1/10 Low
- Heat 7/10 Severe 7 d/yr ≥108°F today · 24 d/yr by 30 yrs out
- Wind 6/10 Major 61% chance of damaging wind over 30 yrs
- Air quality 2/10 Low 0 unhealthy d/yr today · 1 by 30 yrs out
Nearby sold comps map
Loading sold comps map…
Walkable amenities ~0.75 mi
Loading nearby amenities…
Taxation est. · year 1
- Rental income
- $13,259
- − Mortgage interest
- −$9,467
- − Property taxes
- −$2,081
- − Insurance
- −$845
- − Repairs & maintenance
- −$1,061
- − Management
- −$1,061
- − Depreciation
- −$4,916
- Taxable loss
- −$6,172
- Est. tax savings @ 24.0%
- +$1,481
- After-tax cash flow
- $-1,606/yr
For passive investors: Depreciation is non-cash, so a rental often shows a tax loss while cash-flowing — sheltering income. Rental losses are passive: they offset passive income freely, and up to $25,000/yr can offset ordinary (W-2) income if you actively participate and your MAGI is under $100k (phasing out to $0 by $150k); unused losses carry forward. On sale, claimed depreciation is recaptured at up to 25%, and gains may owe capital-gains tax (a 1031 exchange can defer both). Figures are a year-1 estimate at your 24.0% rate — not tax advice; consult a CPA.
Schools (NCES district)
- District
- Waco ISD
- NCES district ID
- 4844280
- Math proficiency
- 20% ▼ -14.00%
- Reading proficiency
- 24% ▼ -6.00%
- Median HH income
- $29,208
- Composite
- 17.57/100
- National rank
- #9043
- State rank
- #773 of 826 in TX
Livability — Beverly Hills
- Score
- 63/100
- State rank
- #871
- US rank
- #15705
Category grades
Schools grade is shown separately in the Schools card above.
Census & demographics
- Census place
- Beverly Hills, TX
- County
- McLennan County · 213,088 people
- Metro
- Waco, TX
- Population (ZIP)
- 9,676
- Household income
- $53,185
- Rent vs Own
- Severe rent burden
- 424.0
Population outlook (McLennan County) Hauer SSP2
- Today (2025)
- 264,191 people
- By 2030
- 273,578 · +3.6%
- By 2040
- 291,506 · +10.3%
- By 2050
- 308,044 · +16.6%
- By 2075
- 349,648 · +32.3%
- By 2100
- 364,779 · +38.1%
Race, ethnicity, and origin ACS 2023
- Neighborhood character
- Diverse neighborhood (Simpson 0.56)
- Race & ethnicity
- Hispanic / Latino 61% Two or more races 43% White 23% Black 12% Native American 3% Asian 2%
- Hispanic origin (detail)
- Mexican 56%
- Common ancestry
- Lithuanian 1% Italian 1% Portuguese 1%
- Foreign-born
- 27% · Canada, China
- Languages at home
- 53% English-only · Spanish 45% Tagalog/Filipino 1% Other Indo-European 1%
Political lean MEDSL · McLennan
- 2024 margin
- Solid R (+30.9) · D 34.0% · R 64.9% · Other 1.0%
- 2008→2024 swing
- -7.0pp toward R · 2008: -23.9pp · 2024: -30.9pp
- All cycles
- 2024: R+30.9 2020: R+23.4 2016: R+27.1 2012: R+29.8 2008: R+23.9
Not yet ingested
- Civics
- —
Market trends
- HPI YoY
- ▲ 3.57%
- Current HPI
- 261.7166
- Rent YoY
- ▲ 2.62%
- Metro
- Waco, TX
- State GDP YoY
- ▲ 3.95%
- F500 in state
- 110
Industry mix (Fortune 500 HQ in TX)
| Industry | F500 HQs | Revenue |
|---|---|---|
| Energy | 16 | $1,198B |
|
||
| Technology | 5 | $198B |
|
||
| Engineering / Construction | 4 | $72B |
|
||
| Energy Services | 3 | $60B |
|
||
| Utilities | 3 | $41B |
|
||
| Healthcare | 2 | $330B |
|
||
Price history
3 events — show timeline
- 2026-05-01 Listed $169,000 NTREIS
- 2017-11-27 Sold (Public Records) — Public Records
- 2009-06-05 Sold (Public Records) — Public Records
Property tax history
+6.8%/yrLatest (2025): $2,081 · -4.7% YoY. Source: county tax records.
Cash-flow waterfall
monthlySold comps — $/sqft
last 12 mo · ≤1 miLoading sold comps…