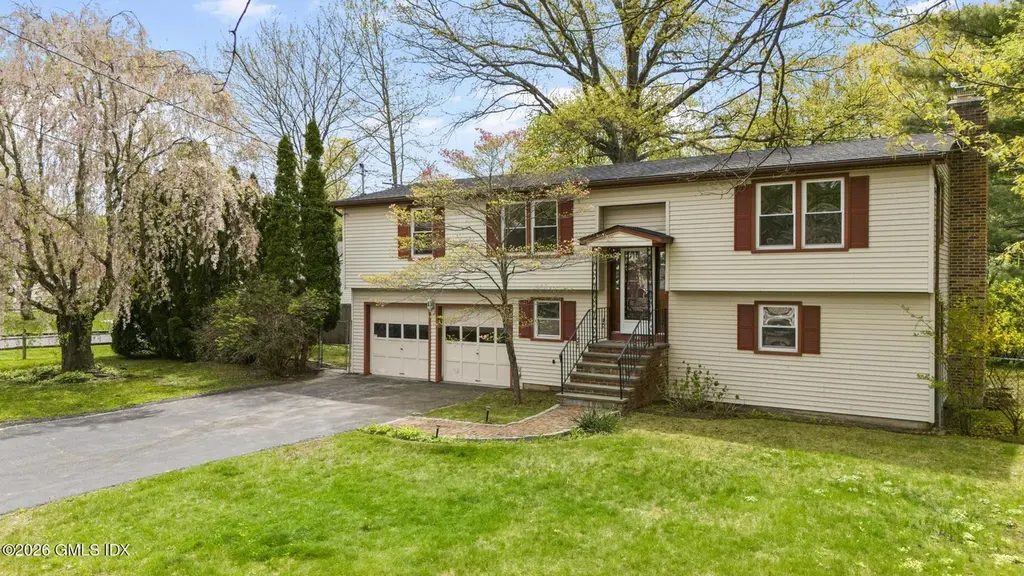
22 Carrona Dr · Riverside, CT
Flood risk 1/10 · Minimal
- FEMA flood zone
- X (unshaded)
- Chance of flooding over 30 yrs
- 0.0%
- Est. flood insurance / yr
- $473 – $860
Fire risk 1/10 · Minimal
- Est. fire insurance / yr
- $829 – $1,539
Heat risk 6/10 · Moderate
- Hot days now (above 98°F)
- 7 days/yr
- Hot days in 30 yrs
- 16 days/yr
Wind risk 6/10 · Moderate
- Chance of severe wind over 30 yrs
- 67.0%
Air-quality risk 6/10 · Moderate
- Unhealthy air days now
- 9 days/yr
- Unhealthy air days in 30 yrs
- 13 days/yr
Risk factors via First Street. Map © Google.
Why this score? — see what drove the C grade
The composite is a weighted blend of 9 inputs, each scored 0–100. Each bar is that input's sub-score; the figure is the points it added to the 100-point composite (weight × sub-score).
- ARV discount +15.0/15.0
- Cash flow +12.3/30.0
- Appreciation +8.6/10.0
- Schools +6.6/10.0
- Livability +3.8/5.0
- DSCR +3.7/10.0
- 1% rule +2.6/10.0
- Rent growth +2.5/5.0
- Condition / age +2.5/5.0
$1,295,000
🖨 Deal sheet (PDF) 📄 Offer letter ✓ Due diligence
Listing remarks
The address is Riverside. The opportunity is real. 22 Carrona Drive sits on a 1/3 acre in one of Greenwich's most convenient locations minutes from the Riverside train station, Riverside Elementary, and Eastern Middle School, with the shops and restaurants of the village close at hand. A newer roof and closed electrical permit mean the big-ticket unknowns are already behind you. With 1,885 sq ft, 4 bedrooms, 2 full baths, and a powder room, the layout is generous and with the interior taken down to the sheetrock, every finish choice is yours to make. With 4,528 sq ft of allowable FAR providing meaningful room to expand, and a location you simply can't replicate, this is the rare project whe
Key facts
- 0.33 acre lot
- 2 garage spots
- Built 1975
Property features AI
Finance
- Other: Property zoned R-12
Exterior
- Parking: 2-car garage with garage door opener
- Utilities: Public water; Natural gas available
- Home design: Single family residence; Built in 1975 (effective year 2000); Architectural shingle roof; Vinyl siding
- Construction: Vinyl siding construction; Architectural shingle roof; Year built: 1975 (effective 2000)
- Exterior features: Terrace; Deck; Fenced yard; Located on a cul-de-sac; Shed(s)
Interior
- Kitchen: Eat-in kitchen
- Bathrooms: Two full bathrooms and one half bathroom (2.5 total)
- Heating & cooling: Electric heating; Attic fan for cooling
- Interior features: Eat-in kitchen; One fireplace
Neighborhood map
What this means for you Summary
Snapshot
- This is a 4-bed/2.5-bath single-family listed at $1.29M.
Deal economics
- At list price, monthly cash flow is $-235 ($-3k/yr) — negative.
- To cash-flow at today's rent, offer at most $1.25M (3.2% below list).
- To meet the 1% rule (rent ≥ 1% of price), the offer needs to be $980k (24.3% below list).
- Recommended offer: $980k (24.3% below list) — sets the bar for 1% rule.
- Cap rate 6.1% vs local median 3.6% in Riverside — top-decile yield for the area; either an underpriced asset or a hidden risk that comps aren't pricing in. Stress-test before assuming the spread holds.
Location & tenants
- Location reads 76/100 on livability (#60 in CT, #3,626 nationally) — a middle-class / working-renter tenant base. Strengths: crime A+, commute A+, employment A+; Watch: amenities F, cost of living F.
- Greenwich School District (suburban): math 64% / reading 73% proficiency, ranked #12 of 153 in CT (top 8%) — acceptable for families but not a draw, mixed tenant base, ~2y average lease; only 11% free/reduced lunch — higher-income household profile.
- Zoned schools: Riverside School (math 84% / reading 89%, grade A+, #4 of 553 statewide, top 1%, 435 students, 2% FRL); Eastern Middle School (math 75% / reading 81%, grade A+, #2 of 175 statewide, top 1%, 784 students, 6% FRL); Greenwich High School (math 59% / reading 78%, grade B, #23 of 194 statewide, top 12%, 2,668 students, 20% FRL) — zoned schools at 9% FRL track the district average.
- Market conditions: 45 active listings in the ZIP; 30 comparable units currently listed for rent nearby; rentals at typical pace (median 24d on market — plan ~3-4 weeks tenant-placement turnaround); 1,151 units permitted in Western Connecticut Planning Region in 2024 (714 in 5+ unit buildings).
Forward outlook
- In year one you build about $103k of equity ($9k loan paydown + $94k appreciation (7.3% local appreciation)).
- By year 2, paydown + projected appreciation supports a ~$165k cash-out refi (75% LTV) — recoverable capital for the next deal without selling this one.
Negotiation context
- Only 12 days on market — expect competitive offers; lowballing is unlikely to land.
- 2 sale attempts since 21y ago with the ask held roughly flat each time — persistent listings suggest the price (not the market) is what's stuck; bring a comps-based counter.
Risks & watch-outs
- Climate carrying-cost: major wind risk, 67% chance of damaging wind over 30y; extreme-heat days projected 7→16/yr by 2055 (HVAC capex compounding) — expect insurance premiums to compound above CPI over the hold.
Questions for the listing agent
- What do current leases actually rent for vs. the listed asking? Can we see a recent rent roll and the last 12 months of T-12 income?
- Built in 1975 — when were the roof, HVAC, electrical panel, plumbing, and water heater last replaced?
- Is there a deadline driving the sale (1031 exchange, divorce, estate, relocation)? That informs how much negotiation room exists.
- Schools are A-rated — typically a magnet for longer-tenancy family renters. What's the average tenant stay here, and is there a school-zone premium baked into asking?
- What's the average days-on-market for RENTAL listings here right now (not sales)? A rising rental-DOM trend means longer vacancies and softer asking-rent achievability than the comps imply.
- What's the recent tenant-quality profile in this submarket — average credit score on applications, eviction rate, late-payment / NSF rate, and stable-employment percentage? A property-management company in the area should have these aggregated.
- How much new for-sale + rental construction is in the pipeline within 1–3 miles? Heavy new supply typically softens prices + rents 12–24 months out; constrained supply supports both.
Investment metrics
- 1% rule
- 0.76% ✗
- Cap rate
- 6.07%
- Cash-on-cash
- -0.78%
- DSCR
- 0.97
- GRM
- 11.0
CMA / ARV
- ARV (median comp)
- $2,015,296
- List price
- $1,295,000
- Delta
- -35.74%
- Verdict
- UNDERPRICED
- Comps
- 20 within 1.0 mi
Show comp detail 11 sales within ~0.75 mi
| Address | Dist | Beds/Ba | Sqft | Sold | Price | $/sf | Match |
|---|---|---|---|---|---|---|---|
| 22 Carrona Dr | 0.00mi | 4/2.5 | 1,885 (0%) | 1mo | $1,450,000 | $769 | 99 |
| 155 Riverside Ave | 0.24mi | 4/2.5 | 2,021 (+7%) | 8mo | $2,351,008 | $1,163 | 70 |
| 8 Somerset Ln | 0.34mi | 3/2.0 (-1) | 1,965 (+4%) | 12mo | $1,850,000 | $941 | 60 |
| 42 Mead Ave | 0.58mi | 3/2.0 (-1) | 1,833 (-3%) | 7mo | $1,125,000 | $614 | 55 |
| 33 Breezemont Ave | 0.58mi | 4/3.0 | 1,923 (+2%) | 21mo | $1,800,000 | $936 | 50 |
| 24 Riverside Ln | 0.74mi | 3/3.0 (-1) | 1,871 (-1%) | 13mo | $1,315,000 | $703 | 46 |
| 69 Riverside Ave | 0.29mi | 3/2.5 (-1) | 2,136 (+13%) | 18mo | $1,600,000 | $749 | 44 |
| 11 Mill Pond Ct | 0.73mi | 3/3.0 (-1) | 1,795 (-5%) | 10mo | $2,000,000 | $1,114 | 42 |
| 11 Hearthstone Dr | 0.49mi | 4/2.0 | 2,064 (+10%) | 22mo | $2,210,000 | $1,071 | 40 |
| 13 Riverside Ln | 0.66mi | 4/3.0 | 2,052 (+9%) | 14mo | $1,250,000 | $609 | 40 |
| 2 River Ln | 0.61mi | 3/2.0 (-1) | 1,613 (-14%) | 11mo | $1,200,000 | $744 | 31 |
Match score weights: distance 35% · size 25% · config 20% · recency 20%. Top-matched comps best support the ARV.
Projected returns pro-forma
7.28% appreciation · 3.0% rent growth · sell at horizon
- IRR
- 17.8%
- Equity multiple
- 2.27×
- Total profit
- $459,489
- Equity at exit
- $921,565
- IRR
- 17.0%
- Equity multiple
- 4.71×
- Total profit
- $1,343,984
- Equity at exit
- $1,772,893
Cash invested: $362,600 (down + closing). Projections, not guarantees.
Landlord ↔ Tenant lean methodology
- Overall (STATE)
- 27 Tenant-Leaning
- State Connecticut
- 27 Tenant-Leaning · D+7
- County
- — inherits STATE
- City
- — inherits STATE
ZIP-level market 06878
- Home prices YoY
- 3.8%
- Active inventory
- 45
- Price-to-rent
- 11.0×
Monthly cashflow live
- Estimated rent
- $9,802 high interval (Pro) →
- Mortgage (P&I)
- −$6,791
- Tax from tax record
- −$648 /mo · $7,782/yr
- Insurance
- −$540
- HOA
- −$0
- Vacancy / Maint / Mgmt
- −$2,059
- Net cashflow
- $-235
Break-even live
Sensitivity live
| Price | -10% $498 | -5% $131 | +0% $-235 | +5% $-602 | +10% $-968 |
|---|---|---|---|---|---|
| Rent | -10% $-1,010 | -5% $-622 | +0% $-235 | +5% $152 | +10% $539 |
| Rate | -1.0pp $417 | -0.5pp $94 | base $-235 | +0.5pp $-571 | +1.0pp $-912 |
UW: 25.0% down · 7.5% · 30yr · 1.5% tax · 5.0% vac · 8.0% maint · 8.0% mgmt
Financing live
Cash to close
- Down payment
- $323,750
- Closing costs
- $38,850
- Reserves months
- —
- Total cash needed
- —
Loan-product check · same deal, 3 products live
Conventional
25% down · 7.5% · 30yr
- Down + closing
- —
- Monthly P&I
- —
- Monthly cashflow
- —
- DSCR
- —
- Eligible?
- —
Personal DTI + credit; lowest rate.
DSCR
20% down · 8.5% · 30yr
- Down + closing
- —
- Monthly P&I
- —
- Monthly cashflow
- —
- DSCR
- —
- Eligible?
- —
No personal income docs; deal must DSCR.
Hard money
10% down · 12.0% · 12mo
- Down + closing
- —
- Monthly P&I
- —
- Monthly cashflow
- —
- DSCR
- —
- Eligible?
- —
Short-term bridge; refi at stabilization.
Rent comps 30 comps
| Address | Beds | Baths | Sqft | Rent | $/sqft | DOM | Units | Dist |
|---|---|---|---|---|---|---|---|---|
| 10 Miltiades Ave Riverside, CT | 3.0 | 2.0 | 1477 | $7,600 | $5.15 | 16d | 1 | 0.21mi |
| 3 River Rd Unit 3 Cos Cob, CT | 3.0 | 1.0 | 1500 | $3,150 | $2.10 | 46d | 1 | 0.49mi |
| 14 Shoalpoint Ln Riverside, CT | 4.0 | 2.5 | 2340 | $14,000 | $5.98 | 25d | 1 | 0.63mi |
| 25 Weston Hill Rd Riverside, CT | 3.0 | 3.0 | 2531 | $10,950 | $4.33 | 5d | 1 | 0.65mi |
| 78 River Rd #15 Cos Cob, CT | 3.0 | 2.5 | 2381 | $12,000 | $5.04 | 46d | 1 | 0.67mi |
| 78 River Rd #15 Cos Cob, CT | 3.0 | 3.5 | 2381 | $12,000 | $5.04 | 46d | 1 | 0.67mi |
| 45 Thornhill Rd Riverside, CT | 3.0 | 2.0 | 1386 | $6,500 | $4.69 | 25d | 1 | 0.77mi |
| 18 Cary Rd Riverside, CT | 3.0 | 2.0 | 1440 | $6,950 | $4.83 | 5d | 1 | 0.79mi |
| 38 Sheephill Rd Riverside, CT | 3.0 | 2.5 | 2600 | $8,200 | $3.15 | 46d | 1 | 0.81mi |
| 14 Cos Cob Ave Unit 3 Cos Cob, CT | 3.0 | 2.5 | 1900 | $6,500 | $3.42 | 46d | 1 | 0.86mi |
| 44 Riverside Ln Riverside, CT | 3.0 | 3.5 | 2404 | $19,000 | $7.90 | 5d | 1 | 0.86mi |
| 8 Potter Dr Old Greenwich, CT | 4.0 | 3.0 | 1979 | $10,500 | $5.31 | 46d | 1 | 0.87mi |
| 143 Sound Beach Ave Old Greenwich, CT | 1.0–3.0 | 1.0–3.0 | 1269 | $12,985 | $10.23 | 0d | 1 | 0.89mi |
| 1 Ernel Dr Riverside, CT | 5.0 | 3.5 | 2517 | $13,000 | $5.16 | 23d | 1 | 0.96mi |
| 45 N Sound Beach Ave Riverside, CT | 3.0 | 2.0 | 1344 | $9,500 | $7.07 | 25d | 1 | 0.99mi |
| 9 Valleywood Rd Cos Cob, CT | 5.0 | 3.0 | 2348 | $13,500 | $5.75 | 46d | 1 | 1.00mi |
| 25 Center Dr Old Greenwich, CT | 3.0 | 2.0 | 1616 | $8,950 | $5.54 | 23d | 1 | 1.01mi |
| 51 Forest Ave #19 Old Greenwich, CT | 3.0 | 2.5 | 1946 | $8,500 | $4.37 | 46d | 1 | 1.10mi |
| 51 Forest Ave Old Greenwich, CT | 3.0 | 3.0 | 1737 | $8,150 | $4.69 | 5d | 2 | 1.10mi |
| 51 Forest Ave #26 Old Greenwich, CT | 3.0 | 3.0 | 2194 | $9,500 | $4.33 | 4d | 1 | 1.10mi |
| 17 Circle Dr Greenwich, CT | 3.0 | 3.0 | 1911 | $7,500 | $3.92 | 16d | 1 | 1.11mi |
| 4 Highview Ave Old Greenwich, CT | 3.0 | 2.0 | 1542 | $10,000 | $6.49 | 21d | 1 | 1.12mi |
| 30 Mary Ln Riverside, CT | 3.0 | 1.5 | 1255 | $6,200 | $4.94 | 16d | 1 | 1.13mi |
| 81 Cos Cob Ave Unit A Cos Cob, CT | 3.0 | 2.0 | 1461 | $5,900 | $4.04 | 5d | 1 | 1.15mi |
| 28 Pleasant St Cos Cob, CT | 4.0 | 2.5 | 2140 | $6,250 | $2.92 | 14d | 1 | 1.16mi |
| 8 Perry Pl Riverside, CT | 4.0 | 3.0 | 2556 | $11,500 | $4.50 | 23d | 1 | 1.20mi |
| 11 Annjim Dr Greenwich, CT | 5.0 | 4.0 | 2417 | $19,500 | $8.07 | 16d | 1 | 1.22mi |
| 15 Dandy Dr Cos Cob, CT | 3.0 | 2.0 | 1762 | $6,500 | $3.69 | 23d | 1 | 1.31mi |
| 51 Benjamin St Old Greenwich, CT | 3.0 | 1.5 | 1462 | $8,500 | $5.81 | 21d | 1 | 1.33mi |
| 6 Irvine Rd Old Greenwich, CT | 3.0 | 3.0 | 2066 | $12,500 | $6.05 | 5d | 1 | 1.42mi |
Listing history 4 events
-
2026-05-18status Pending 738-char remark
-
2026-05-07$1,295,000 Active 738-char remark
-
2017-06-13historical
-
2005-08-15$995,000
ⓘ Source: listings_history table (triggers on properties + properties_extension) + one-shot
backfill from property_details.listing_events for pre-trigger history.
Tax reassessment forecast CT · Partial reset (capped growth)
- Current annual tax
- $7,782 · $648/mo
- Projected year-2 tax
- $17,748 · $1,479/mo
- Expected delta
- +$9,966/yr (+$830/mo · 128.1%)
ⓘ Screening estimate from a state-policy table — verify with the county assessor before closing.
Climate risk First Street
- Flood 1/10 Low FEMA zone X (unshaded) · 0% chance over 30 yrs
- Wildfire 1/10 Low
- Heat 6/10 Major 7 d/yr ≥98°F today · 16 d/yr by 30 yrs out
- Wind 6/10 Major 67% chance of damaging wind over 30 yrs
- Air quality 6/10 Major 9 unhealthy d/yr today · 13 by 30 yrs out
Nearby sold comps map
Loading sold comps map…
Walkable amenities ~0.75 mi
Loading nearby amenities…
Taxation est. · year 1
- Rental income
- $117,629
- − Mortgage interest
- −$72,540
- − Property taxes
- −$7,782
- − Insurance
- −$6,475
- − Repairs & maintenance
- −$9,410
- − Management
- −$9,410
- − Depreciation
- −$37,673
- Taxable loss
- −$25,661
- Est. tax savings @ 24.0%
- +$6,159
- After-tax cash flow
- $3,335/yr
For passive investors: Depreciation is non-cash, so a rental often shows a tax loss while cash-flowing — sheltering income. Rental losses are passive: they offset passive income freely, and up to $25,000/yr can offset ordinary (W-2) income if you actively participate and your MAGI is under $100k (phasing out to $0 by $150k); unused losses carry forward. On sale, claimed depreciation is recaptured at up to 25%, and gains may owe capital-gains tax (a 1031 exchange can defer both). Figures are a year-1 estimate at your 24.0% rate — not tax advice; consult a CPA.
Schools (NCES district)
- District
- Greenwich School District
- NCES district ID
- 0901710
- Math proficiency
- 64% ▼ -7.00%
- Reading proficiency
- 73% ▼ -5.00%
- Median HH income
- $129,257
- Composite
- 65.67/100
- National rank
- #461
- State rank
- #12 of 153 in CT
Livability — Riverside
- Score
- 76/100
- State rank
- #60
- US rank
- #3626
Category grades
Schools grade is shown separately in the Schools card above.
Census & demographics
- Census place
- Riverside, CT
- City population
- 8,446
- Population (ZIP)
- 8,446
Population outlook (Western Connecticut County) Hauer SSP2
- By 2040
- 685,031
Race, ethnicity, and origin ACS 2023
- Neighborhood character
- Diverse neighborhood (Simpson 0.57)
- Race & ethnicity
- White 62% Hispanic / Latino 16% Asian 13% Two or more races 12% Black 3% Native American 2%
- Hispanic origin (detail)
- Mexican 4% Salvadoran 5%
- Common ancestry
- Slovak 3% Italian 3% Lithuanian 3%
- Foreign-born
- 31% · Canada, Dominican Republic, China
- Languages at home
- 64% English-only · Spanish 16% Russian/Polish/Slavic 5% Other Indo-European 3%
Political lean MEDSL · Western Connecticut
- 2024 margin
- D (+19.1) · D 58.8% · R 39.7% · Other 1.6%
- All cycles
- 2024: D+19.1
Not yet ingested
- Civics
- —
Market trends
- HPI YoY
- ▲ 7.28%
- Current HPI
- 198.3808
- Rent YoY
- —
- Metro
- —
- State GDP YoY
- ▲ 1.06%
- F500 in state
- 38
Industry mix (Fortune 500 HQ in CT)
| Industry | F500 HQs | Revenue |
|---|---|---|
| Industrial Machinery | 4 | $38B |
|
||
| Insurance | 3 | $71B |
|
||
| Financial Services | 2 | $25B |
|
||
| Transportation / Logistics | 2 | $18B |
|
||
| Healthcare | 1 | $247B |
|
||
| Telecommunications | 1 | $55B |
|
||
Price history
+45.7% since first listed5 events — show timeline
- 2026-05-29 Sold (MLS) $1,450,000 GMLS
- 2026-05-18 Pending — GMLS
- 2026-05-07 Listed $1,295,000 GMLS
- 2017-06-13 Delisted — GMLS
- 2005-08-15 Listed $995,000 GMLS
Property tax history
+1.2%/yrLatest (2023): $7,782 · +0.9% YoY. Source: county tax records.
Cash-flow waterfall
monthlySold comps — $/sqft
last 12 mo · ≤1 miLoading sold comps…