 🏗️ New Construction
515 Stone Brook Pl · Brandon, MS
Flood risk 1/10 · Minimal
- FEMA flood zone
- X (unshaded)
- Chance of flooding over 30 yrs
- 0.0%
- Est. flood insurance / yr
- $507 – $1,088
Fire risk 4/10 · Minor
- Est. fire insurance / yr
- $1,241 – $2,305
Heat risk 8/10 · Major
- Hot days now (above 108°F)
- 7 days/yr
- Hot days in 30 yrs
- 22 days/yr
Wind risk 8/10 · Major
- Chance of severe wind over 30 yrs
- 80.0%
Air-quality risk 2/10 · Minimal
- Unhealthy air days now
- 0 days/yr
- Unhealthy air days in 30 yrs
- 1 days/yr
Risk factors via First Street. Map © Google.
Why this score? — see what drove the D- grade
The composite is a weighted blend of 9 inputs, each scored 0–100. Each bar is that input's sub-score; the figure is the points it added to the 100-point composite (weight × sub-score).
- Cash flow +9.2/30.0
- ARV discount +7.5/15.0
- Schools +4.6/10.0
- Rent growth +4.3/5.0
- Livability +4.0/5.0
- 1% rule +2.8/10.0
- DSCR +2.6/10.0
- Condition / age +1.0/5.0
- Appreciation +0.0/10.0
$294,999
🖨 Deal sheet (PDF) 📄 Offer letter ✓ Due diligence
Listing remarks
Come check out this NEW CONSTRUCTION home from a LOCAL BUILDER. This is a 3/2 split plan with an open feel. This home has a large family room with high ceilings that is open to the kitchen and eating area. The kitchen has a large island, pantry, custom built cabinets(no pre fab cabinets), and stainless steel appliances. The master bedroom has vaulted ceiling and has a door that leads into the master bath. The master bath has double vanities, seperate shower, and a large walk in closet with direct access to the laundry room. This home also has a nice covered porch to enjoy the back yard. The builder is offering concessions to be used for the buyers choice of an interest rate buy down, fen
Key facts
- Large family room
- New construction
- Vaulted ceiling
Tags
Property features AI
Finance
- Other: Builder model 406-1670
- HOA & community: Homeowners association present
Exterior
- Parking: 2-car garage with garage door opener and direct access; concrete driveway
- Utilities: Public water; Public sewer; Electricity available; Natural gas available
- Home design: Single-family house; One story; New construction; Living area according to plans
- Construction: Brick exterior; Architectural shingle roof; Slab foundation; Built by builder (new construction)
- Exterior features: Level lot
Interior
- Kitchen: Dishwasher; Disposal; Microwave; Plumbed for ice maker; Granite counters
- Bedrooms: Bedrooms not specified
- Flooring: Luxury vinyl
- Bathrooms: 2 full bathrooms
- Heating & cooling: Central heating (natural gas); Central air conditioning
- Interior features: Ceiling fans; Double vanity; Granite counters; Open floorplan; Walk-in closets; Soaking tub; Gas log fireplace with gas starter; Double pane windows
- Laundry & utility: Indoor laundry room with electric dryer hookup; Gas water heater; Tankless water heater
Neighborhood map
What this means for you Summary
Snapshot
- This is a 3-bed/2.0-bath single-family listed at $295k. Condition is rated poor.
Deal economics
- At list price, monthly cash flow is $-220 ($-3k/yr) — negative.
- To cash-flow at today's rent, offer at most $263k (10.8% below list).
- To meet the 1% rule (rent ≥ 1% of price), the offer needs to be $230k (21.9% below list).
- Recommended offer: $230k (21.9% below list) — sets the bar for 1% rule.
- Cap rate 5.4% vs local median 4.2% in Brandon — meaningfully above typical; check what's discounted (condition, days-on-market, listing class) to confirm the premium yield is real.
Location & tenants
- Location reads 81/100 on livability (#3 in MS, #1,514 nationally) — a professional / high-income tenant draw. Strengths: crime A+, employment A+, cost of living A+; Watch: amenities F, commute F.
- Rankin County School District (rural): math 56% / reading 48% proficiency, ranked #6 of 130 in MS (top 5%) — acceptable for families but not a draw, mixed tenant base, ~2y average lease.
- Zoned schools: Brandon Elementary School (math 69% / reading 65%, grade B+, #11 of 375 statewide, top 3%, 741 students, 100% FRL); Brandon Middle School (math 67% / reading 49%, grade B, #11 of 179 statewide, top 6%, 1,193 students, 100% FRL); Brandon High School (math 47% / reading 49%, grade D, #27 of 197 statewide, top 13%, 1,648 students, 100% FRL) — zoned schools average 100% FRL vs 35% district-wide (65 pts higher); higher-poverty schools than district average — tighter screening recommended.
- Market conditions: Rents rising fast (+7.1%/yr); 302 active listings in the ZIP; 2 comparable units currently listed for rent nearby; solid renter incomes; 343 units permitted in Rankin County in 2024 (0 in 5+ unit buildings).
- This rent runs 31% of the median local income ($89k/yr) — at the standard rent-burdened threshold; future hikes will face affordability resistance.
Forward outlook
- Local home prices are declining (-3.0%/yr); year-one equity from $2k of loan paydown is wiped out by about $9k of value loss. Plan a longer hold.
- Rankin County population projected at +17% by 2050 — long-run rental-demand tailwind backs the buy-and-hold thesis.
Negotiation context
- It's been on market 52 days — a 3% lower offer ($286k) is reasonable based on typical stale-listing flexibility.
Risks & watch-outs
- Climate carrying-cost: severe wind risk, 80% chance of damaging wind over 30y; extreme-heat days projected 7→22/yr by 2055 (HVAC capex compounding) — expect insurance premiums to compound above CPI over the hold.
Questions for the listing agent
- What do current leases actually rent for vs. the listed asking? Can we see a recent rent roll and the last 12 months of T-12 income?
- It's been on market 52 days. Have you received any prior offers? Is the seller open to a 22% concession, seller financing, or rate buy-down credit?
- Have any recent inspections been done? Can we get a copy of the seller's disclosures and any deferred-maintenance estimates?
- Is there a deadline driving the sale (1031 exchange, divorce, estate, relocation)? That informs how much negotiation room exists.
- Schools are A-rated — typically a magnet for longer-tenancy family renters. What's the average tenant stay here, and is there a school-zone premium baked into asking?
- The area grade is low — what's the realistic commute time and amenity access for the typical tenant pool here? Any planned neighborhood developments (good or bad) we should know about?
- What's the average days-on-market for RENTAL listings here right now (not sales)? A rising rental-DOM trend means longer vacancies and softer asking-rent achievability than the comps imply.
- What's the recent tenant-quality profile in this submarket — average credit score on applications, eviction rate, late-payment / NSF rate, and stable-employment percentage? A property-management company in the area should have these aggregated.
- How much new for-sale + rental construction is in the pipeline within 1–3 miles? Heavy new supply typically softens prices + rents 12–24 months out; constrained supply supports both.
Investment metrics
- 1% rule
- 0.78% ✗
- Cap rate
- 5.40%
- Cash-on-cash
- -3.20%
- DSCR
- 0.86
- GRM
- 10.7
CMA / ARV
- ARV (median comp)
- $295,116
- List price
- $294,999
- Delta
- -0.04%
- Verdict
- FAIR
- Comps
- 20 within 1.0 mi
Show comp detail 12 sales within ~0.75 mi
| Address | Dist | Beds/Ba | Sqft | Sold | Price | $/sf | Match |
|---|---|---|---|---|---|---|---|
| 503 Stone Brook Pl | 0.01mi | 3/2.0 | 1,675 (+0%) | 5mo | $292,999 | $175 | 95 |
| 535 Stone Brook Pl | 0.08mi | 3/2.0 | 1,675 (+0%) | 6mo | $292,999 | $175 | 91 |
| 507 Stone Brook Pl | 0.01mi | 3/2.0 | 1,750 (+5%) | 4mo | $299,999 | $171 | 88 |
| 217 Stonebridge Blvd | 0.10mi | 3/2.0 | 1,628 (-2%) | 5mo | $269,900 | $166 | 87 |
| 534 Stone Brook Pl | 0.08mi | 3/2.0 | 1,750 (+5%) | 2mo | $299,999 | $171 | 86 |
| 509 Stone Brook Pl | 0.01mi | 4/2.0 (+1) | 1,600 (-4%) | 2mo | $289,999 | $181 | 86 |
| 409 Sand Stone Pl | 0.17mi | 3/2.0 | 1,633 (-2%) | 5mo | $244,000 | $149 | 84 |
| 538 Stone Brook Pl | 0.10mi | 3/2.0 | 1,555 (-7%) | 1mo | $284,999 | $183 | 84 |
| 505 Stone Brook Pl | 0.01mi | 4/2.0 (+1) | 1,600 (-4%) | 6mo | $289,999 | $181 | 82 |
| 244 Stonebridge Blvd | 0.09mi | 3/2.0 | 1,531 (-8%) | 0mo | $270,000 | $176 | 82 |
| 544 Stone Brook Pl | 0.11mi | 3/2.0 | 1,750 (+5%) | 8mo | $299,999 | $171 | 80 |
| 309 Flagstone Dr | 0.15mi | 3/2.0 | 1,518 (-9%) | 2mo | $265,000 | $175 | 76 |
Match score weights: distance 35% · size 25% · config 20% · recency 20%. Top-matched comps best support the ARV.
Projected returns pro-forma
-3.0% appreciation · 7.13% rent growth · sell at horizon
- IRR
- -17.1%
- Equity multiple
- 0.37×
- Total profit
- $-51,843
- Equity at exit
- $44,003
- IRR
- -2.8%
- Equity multiple
- 0.78×
- Total profit
- $-18,521
- Equity at exit
- $25,516
Cash invested: $82,632 (down + closing). Projections, not guarantees.
Landlord ↔ Tenant lean methodology
- Overall (STATE)
- 90 Strongly Landlord-Friendly
- State Mississippi
- 90 Strongly Landlord-Friendly · R+11
- County
- — inherits STATE
- City
- — inherits STATE
ZIP-level market 39042
- Home prices YoY
- -34.3%
- Rents YoY
- 7.1%
- Active inventory
- 302
- Price-to-rent
- 10.7×
Monthly cashflow live
- Estimated rent
- $2,303 medium interval (Pro) →
- Mortgage (P&I)
- −$1,548
- Tax est. 1.5%
- −$369 /mo · $4,427/yr
- Insurance
- −$123
- HOA
- −$0
- Vacancy / Maint / Mgmt
- −$484
- Net cashflow
- $-220
Break-even live
Sensitivity live
| Price | -10% $-16 | -5% $-118 | +0% $-220 | +5% $-322 | +10% $-424 |
|---|---|---|---|---|---|
| Rent | -10% $-402 | -5% $-311 | +0% $-220 | +5% $-129 | +10% $-38 |
| Rate | -1.0pp $-72 | -0.5pp $-145 | base $-220 | +0.5pp $-297 | +1.0pp $-374 |
UW: 25.0% down · 7.5% · 30yr · 1.5% tax · 5.0% vac · 8.0% maint · 8.0% mgmt
Financing live
Cash to close
- Down payment
- $73,779
- Closing costs
- $8,853
- Reserves months
- —
- Total cash needed
- —
Loan-product check · same deal, 3 products live
Conventional
25% down · 7.5% · 30yr
- Down + closing
- —
- Monthly P&I
- —
- Monthly cashflow
- —
- DSCR
- —
- Eligible?
- —
Personal DTI + credit; lowest rate.
DSCR
20% down · 8.5% · 30yr
- Down + closing
- —
- Monthly P&I
- —
- Monthly cashflow
- —
- DSCR
- —
- Eligible?
- —
No personal income docs; deal must DSCR.
Hard money
10% down · 12.0% · 12mo
- Down + closing
- —
- Monthly P&I
- —
- Monthly cashflow
- —
- DSCR
- —
- Eligible?
- —
Short-term bridge; refi at stabilization.
Rent comps 2 comps
| Address | Beds | Baths | Sqft | Rent | $/sqft | DOM | Units | Dist |
|---|---|---|---|---|---|---|---|---|
| 610 Diamond Way Brandon, MS | 3.0 | 2.0 | 1810 | $2,595 | $1.43 | 44d | 1 | 0.21mi |
| 604 King Richard Rd Brandon, MS | 3.0 | 2.0 | 1152 | $1,125 | $0.98 | 14d | 1 | 1.07mi |
Listing history 16 events
-
2026-06-18days on market $294,999 Active 52 DOM
-
2026-06-17days on market $294,999 Active 51 DOM
-
2026-06-16days on market $294,999 Active 50 DOM
-
2026-06-15days on market $294,999 Active 49 DOM
-
2026-06-14days on market $294,999 Active 47 DOM
-
2026-06-13days on market $294,999 Active 46 DOM
-
2026-06-10days on market $294,999 Active 44 DOM
-
2026-06-09days on market $294,999 Active 43 DOM
-
2026-06-08days on market $294,999 Active 42 DOM
-
2026-06-07days on market $294,999 Active 41 DOM
-
2026-06-03days on market $294,999 Active 37 DOM
-
2026-06-02days on market $294,999 Active 36 DOM
-
2026-06-01days on market $294,999 Active 35 DOM
-
2026-05-31days on market $294,999 Active 34 DOM
-
2026-05-30days on market $294,999 Active 33 DOM
-
2026-04-27$294,999 Active 723-char remark
ⓘ Source: listings_history table (triggers on properties + properties_extension) + one-shot
backfill from property_details.listing_events for pre-trigger history.
Climate risk First Street
- Flood 1/10 Low FEMA zone X (unshaded) · 0% chance over 30 yrs
- Wildfire 4/10 Moderate
- Heat 8/10 Severe 7 d/yr ≥108°F today · 22 d/yr by 30 yrs out
- Wind 8/10 Severe 80% chance of damaging wind over 30 yrs
- Air quality 2/10 Low 0 unhealthy d/yr today · 1 by 30 yrs out
Nearby sold comps map
Loading sold comps map…
Walkable amenities ~0.75 mi
Loading nearby amenities…
Taxation est. · year 1
- Rental income
- $27,635
- − Mortgage interest
- −$16,531
- − Property taxes
- −$4,427
- − Insurance
- −$1,476
- − Repairs & maintenance
- −$2,211
- − Management
- −$2,211
- − Depreciation
- −$8,585
- Taxable loss
- −$7,805
- Est. tax savings @ 24.0%
- +$1,873
- After-tax cash flow
- $-769/yr
For passive investors: Depreciation is non-cash, so a rental often shows a tax loss while cash-flowing — sheltering income. Rental losses are passive: they offset passive income freely, and up to $25,000/yr can offset ordinary (W-2) income if you actively participate and your MAGI is under $100k (phasing out to $0 by $150k); unused losses carry forward. On sale, claimed depreciation is recaptured at up to 25%, and gains may owe capital-gains tax (a 1031 exchange can defer both). Figures are a year-1 estimate at your 24.0% rate — not tax advice; consult a CPA.
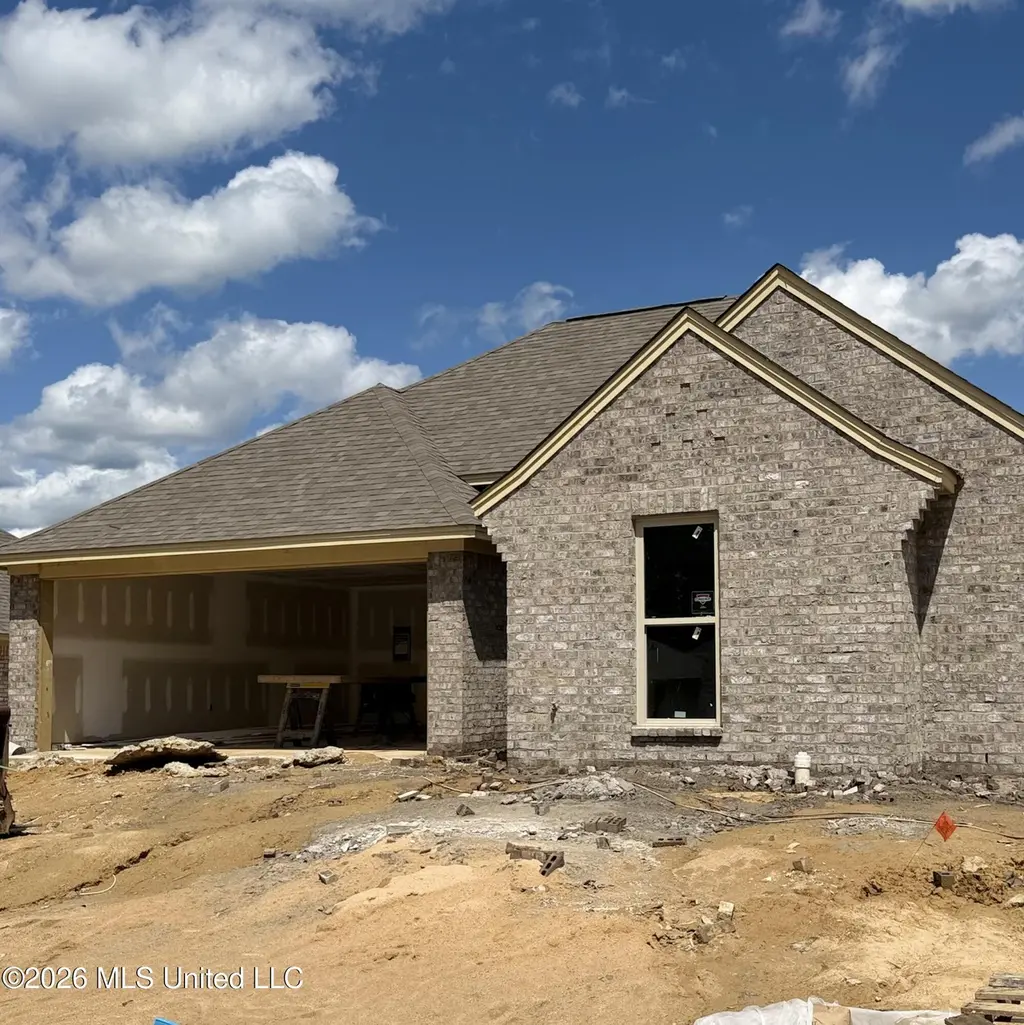
Condition & rehab AI · 1 photo
This is a new construction home in the early stages of completion. Significant work is needed to bring it to a move-in-ready condition, including finishing the exterior, interior, and appliances.
Repairs flagged
- Major roof — Exposed roof structure
- Major exterior — Exposed framing, no siding
- Major flooring — Exposed subfloor
- Major interior walls — Exposed framing, no drywall
- Major bathrooms — Exposed plumbing and fixtures
- Major kitchen — Exposed cabinets and appliances
- Major systems — Exposed electrical and HVAC systems
Value-add opportunities
- Both Complete construction and finishing — Fully finished home ready for occupancy
- Both Landscaping and curb appeal — Enhances home's appearance and appeal
- Both Paint and interior finishing — Improves home's aesthetic and value
- Both Appliance installation — Finishes kitchen and makes it move-in ready
Renovation cost estimate screening
| Repair item | Severity | Est. cost |
|---|---|---|
| roof · Exposed roof structure | Major | $15,000–50,000 |
| exterior · Exposed framing, no siding | Major | $15,000–50,000 |
| flooring · Exposed subfloor | Major | $15,000–50,000 |
| interior walls · Exposed framing, no drywall | Major | $15,000–50,000 |
| bathrooms · Exposed plumbing and fixtures | Major | $15,000–50,000 |
| kitchen · Exposed cabinets and appliances | Major | $15,000–50,000 |
| systems · Exposed electrical and HVAC systems | Major | $15,000–50,000 |
| Total estimated repair cost · 7 items | $105,000–350,000 |
Value-add ROI direction
- Both Complete construction and finishing — Fully finished home ready for occupancy ↑
- Both Landscaping and curb appeal — Enhances home's appearance and appeal ↑
- Both Paint and interior finishing — Improves home's aesthetic and value ↑
- Both Appliance installation — Finishes kitchen and makes it move-in ready ↑
ⓘ Cost ranges are severity-bucket heuristics (US national rule-of-thumb). Get contractor quotes + a written scope before underwriting a rehab budget.
Schools (NCES district)
- District
- Rankin County School District
- NCES district ID
- 2803830
- Math proficiency
- 56% ▼ -4.00%
- Reading proficiency
- 48% ▼ -6.00%
- Median HH income
- $61,867
- Composite
- 45.62/100
- National rank
- #2587
- State rank
- #6 of 130 in MS
Livability — Brandon
- Score
- 81/100
- State rank
- #3
- US rank
- #1514
Category grades
Schools grade is shown separately in the Schools card above.
Census & demographics
- County
- Rankin County · 123,614 people
- City population
- 79,950
- Metro
- Jackson, MS
- Population (ZIP)
- 39,142
- Household income
- $88,597
- Rent vs Own
- Severe rent burden
- 474.0
Population outlook (Rankin County) Hauer SSP2
- Today (2025)
- 164,317 people
- By 2030
- 171,013 · +4.1%
- By 2040
- 182,723 · +11.2%
- By 2050
- 192,376 · +17.1%
- By 2075
- 209,535 · +27.5%
- By 2100
- 209,534 · +27.5%
Race, ethnicity, and origin ACS 2023
- Neighborhood character
- Predominantly White (75%)
- Race & ethnicity
- White 75% Black 21% Hispanic / Latino 2% Two or more races 2%
- Common ancestry
- Italian 5% Slovak 2% Iranian 2%
- Foreign-born
- 2% · Canada
- Languages at home
- 97% English-only · Spanish 2%
Political lean MEDSL · Rankin
- 2024 margin
- Solid R (+47.1) · D 25.9% · R 73.0% · Other 1.0%
- 2008→2024 swing
- +6.4pp toward D · 2008: -53.5pp · 2024: -47.1pp
- All cycles
- 2024: R+47.1 2020: R+45.4 2016: R+52.9 2012: R+51.9 2008: R+53.5
Not yet ingested
- Civics
- —
Market trends
- HPI YoY
- ▼ -90.04%
- Current HPI
- 172.5248
- Rent YoY
- ▲ 7.13%
- Metro
- Jackson, MS
- State GDP YoY
- —
- F500 in state
- 0
Price history
1 event — show timeline
- 2026-04-27 Listed $294,999 MLSU
Cash-flow waterfall
monthlySold comps — $/sqft
last 12 mo · ≤1 miLoading sold comps…