109 Moss Rd · Nolanville, TX
Flood risk 1/10 · Minimal
- FEMA flood zone
- X (unshaded)
- Chance of flooding over 30 yrs
- 0.0%
- Est. flood insurance / yr
- $507 – $1,088
Fire risk 5/10 · Moderate
- Est. fire insurance / yr
- $1,222 – $2,270
Heat risk 8/10 · Major
- Hot days now (above 108°F)
- 7 days/yr
- Hot days in 30 yrs
- 25 days/yr
Wind risk 6/10 · Moderate
- Chance of severe wind over 30 yrs
- 67.0%
Air-quality risk 2/10 · Minimal
- Unhealthy air days now
- 0 days/yr
- Unhealthy air days in 30 yrs
- 1 days/yr
Risk factors via First Street. Map © Google.
Why this score? — see what drove the D- grade
The composite is a weighted blend of 9 inputs, each scored 0–100. Each bar is that input's sub-score; the figure is the points it added to the 100-point composite (weight × sub-score).
- ARV discount +14.4/15.0
- Cash flow +6.1/30.0
- Appreciation +5.0/10.0
- Livability +3.7/5.0
- Schools +3.0/10.0
- Rent growth +2.5/5.0
- Condition / age +2.5/5.0
- 1% rule +1.6/10.0
- DSCR +0.5/10.0
$197,000
🖨 Deal sheet (PDF) 📄 Offer letter ✓ Due diligence
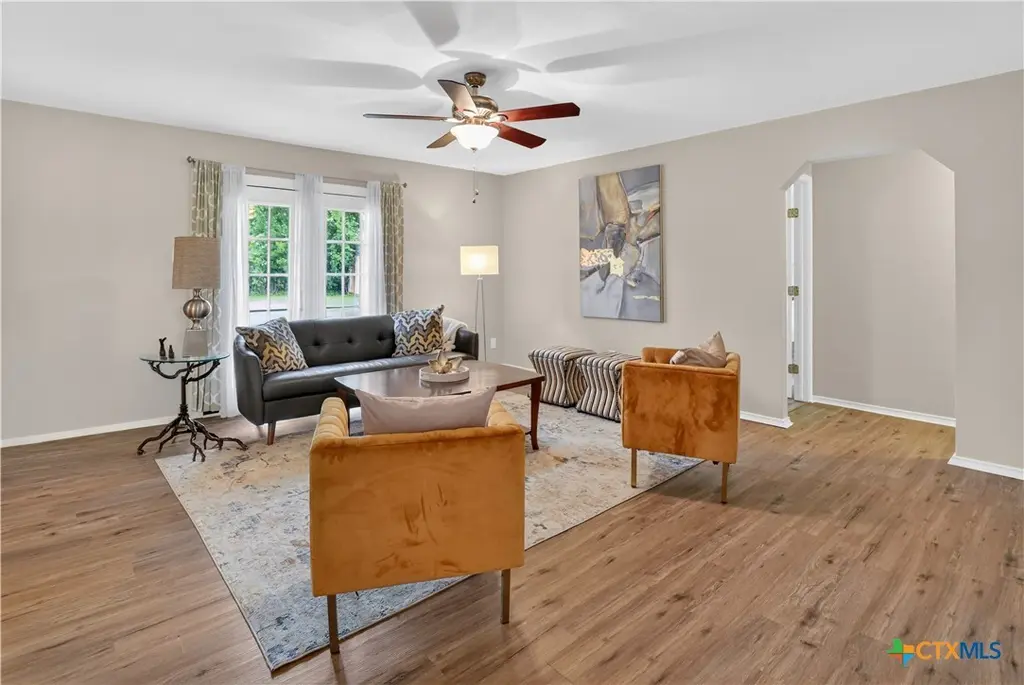
Listing remarks
Tucked away with no back neighbors and quick access to FM 439 and I-14, this updated Nolanville home offers comfort, convenience, and a little extra breathing room. Featuring 3 bedrooms and 1.5 baths, the home includes new LVP flooring, updated vanities, and a functional layout designed for everyday living. Enjoy a formal dining area perfect for gatherings, game nights, or a flexible second living space. Whether you're commuting to nearby shopping, dining, and Fort Hood or simply looking for a move-in ready home in a convenient location, 109 Moss Rd is ready to welcome you home.
Key facts
- 8,481 sq ft lot
- Garage
- Built 1983
Property features AI
Exterior
- Parking: Converted garage
- Security: Smoke detectors
- Utilities: Electricity available and on property; Public water; Public sewer; Public trash collection
- Home design: Single-story; Resale property
- Construction: Brick and wood siding exterior; Composition/shingle roof; Slab foundation; Built (year per assessor)
- Exterior features: Storage; Back yard with chain link fencing; City lot, level with mature trees; City street frontage; Asphalt road surface
Interior
- Kitchen: Dishwasher; Electric range; Microwave; Range
- Flooring: Luxury vinyl plank; Tile
- Bathrooms: 1 full bathroom; 1 half bathroom
- Heating & cooling: Central heating (electric); Central air (electric, one unit)
- Interior features: Ceiling fans; Dining area and separate/formal dining room; Kitchen/Family room combo and kitchen/dining combo; Pull-down attic stairs; Tub/shower; Vanity; Solid surface counters
- Laundry & utility: Washer hookup; Electric dryer hookup; Water heater
Neighborhood map
What this means for you Summary
Snapshot
- This is a 3-bed/2.0-bath single-family listed at $197k.
Deal economics
- At list price, monthly cash flow is $-366 ($-4k/yr) — negative.
- To cash-flow at today's rent, offer at most $132k (32.8% below list).
- To meet the 1% rule (rent ≥ 1% of price), the offer needs to be $129k (34.4% below list).
- Recommended offer: $129k (34.4% below list) — sets the bar for 1% rule.
Location & tenants
- Location reads 74/100 on livability (#176 in TX, #4,655 nationally) — a middle-class / working-renter tenant base. Strengths: crime A+, cost of living A+, housing A+; Watch: amenities F, commute F.
- Killeen ISD (urban): math 31% / reading 38% proficiency, ranked #524 of 826 in TX (top 63%) — families likely to look elsewhere, expect single-tenant / working-renter base with shorter leases.
- Zoned schools: Richard E Cavazos El (math 43% / reading 46%, grade F, #1,155 of 4,322 statewide, top 29%, 607 students, 66% FRL); Rancier Middle (math 24% / reading 26%, grade F, #1,258 of 1,662 statewide, top 77%, 722 students, 81% FRL); Killeen H S (math 29% / reading 40%, grade F, #963 of 1,632 statewide, top 61%, 2,076 students, 69% FRL) — zoned schools average 72% FRL vs 47% district-wide (25 pts higher); higher-poverty schools than district average — tighter screening recommended.
- Market conditions: 239 active listings in the ZIP; 5 comparable units currently listed for rent nearby; rentals lingering (median 46d on market — plan ~5-8 weeks vacancy on turnover, expect pricing pressure); 60% of comp listings sitting > 30 days — soft ceiling on asking rent; 3,222 units permitted in Bell County in 2024 (246 in 5+ unit buildings).
Forward outlook
- In year one you build about $1k of equity ($1k loan paydown + $73 appreciation (0.0% local appreciation)).
- Bell County population projected at +21% by 2050 — long-run rental-demand tailwind backs the buy-and-hold thesis.
Negotiation context
- It's been on market 45 days — a 3% lower offer ($191k) is reasonable based on typical stale-listing flexibility.
- 2 sale attempts since 8y ago with the ask held roughly flat each time — persistent listings suggest the price (not the market) is what's stuck; bring a comps-based counter.
Risks & watch-outs
- Climate carrying-cost: major wind risk, 67% chance of damaging wind over 30y; moderate wildfire risk; extreme-heat days projected 7→25/yr by 2055 (HVAC capex compounding) — expect insurance premiums to compound above CPI over the hold.
Questions for the listing agent
- What do current leases actually rent for vs. the listed asking? Can we see a recent rent roll and the last 12 months of T-12 income?
- It's been on market 45 days. Have you received any prior offers? Is the seller open to a 34% concession, seller financing, or rate buy-down credit?
- Is there a deadline driving the sale (1031 exchange, divorce, estate, relocation)? That informs how much negotiation room exists.
- Schools are D-rated, which usually means shorter tenancies and higher turnover. Who's the typical renter profile here, and what's been the actual vacancy rate?
- The area grade is low — what's the realistic commute time and amenity access for the typical tenant pool here? Any planned neighborhood developments (good or bad) we should know about?
- What's the average days-on-market for RENTAL listings here right now (not sales)? A rising rental-DOM trend means longer vacancies and softer asking-rent achievability than the comps imply.
- What's the recent tenant-quality profile in this submarket — average credit score on applications, eviction rate, late-payment / NSF rate, and stable-employment percentage? A property-management company in the area should have these aggregated.
- How much new for-sale + rental construction is in the pipeline within 1–3 miles? Heavy new supply typically softens prices + rents 12–24 months out; constrained supply supports both.
Investment metrics
- 1% rule
- 0.66% ✗
- Cap rate
- 4.07%
- Cash-on-cash
- -7.95%
- DSCR
- 0.65
- GRM
- 12.7
CMA / ARV
- ARV (median comp)
- $232,948
- List price
- $197,000
- Delta
- -15.43%
- Verdict
- UNDERPRICED
- Comps
- 20 within 1.0 mi
Show comp detail 3 sales within ~0.75 mi
| Address | Dist | Beds/Ba | Sqft | Sold | Price | $/sf | Match |
|---|---|---|---|---|---|---|---|
| 512 N Main St | 0.53mi | 3/1.5 | 1,008 (+1%) | 9mo | $160,000 | $159 | 65 |
| 101 E Avenue K St | 0.53mi | 3/1.0 | 1,008 (+1%) | 8mo | $135,000 | $134 | 64 |
| 408 N Main St | 0.58mi | 3/2.0 | 1,064 (+6%) | 8mo | $150,000 | $141 | 55 |
Match score weights: distance 35% · size 25% · config 20% · recency 20%. Top-matched comps best support the ARV.
Projected returns pro-forma
0.04% appreciation · 3.0% rent growth · sell at horizon
- IRR
- -11.1%
- Equity multiple
- 0.48×
- Total profit
- $-28,666
- Equity at exit
- $57,568
- IRR
- -4.9%
- Equity multiple
- 0.48×
- Total profit
- $-28,565
- Equity at exit
- $69,492
Cash invested: $55,160 (down + closing). Projections, not guarantees.
Landlord ↔ Tenant lean methodology
- Overall (STATE)
- 87 Strongly Landlord-Friendly
- State Texas
- 87 Strongly Landlord-Friendly · R+5
- County
- — inherits STATE
- City
- — inherits STATE
ZIP-level market 76559
- Home prices YoY
- 0.0%
- Active inventory
- 239
- Price-to-rent
- 12.7×
Monthly cashflow live
- Estimated rent
- $1,293 high interval (Pro) →
- Mortgage (P&I)
- −$1,033
- Tax from tax record
- −$271 /mo · $3,258/yr
- Insurance
- −$82
- HOA
- −$0
- Lot rent
- −$0
- Vacancy / Maint / Mgmt
- −$271
- Net cashflow
- $-366
Break-even live
Sensitivity live
| Price | -10% $-254 | -5% $-310 | +0% $-366 | +5% $-421 | +10% $-477 |
|---|---|---|---|---|---|
| Rent | -10% $-468 | -5% $-417 | +0% $-366 | +5% $-314 | +10% $-263 |
| Rate | -1.0pp $-266 | -0.5pp $-315 | base $-366 | +0.5pp $-417 | +1.0pp $-469 |
UW: 25.0% down · 7.5% · 30yr · 1.5% tax · 5.0% vac · 8.0% maint · 8.0% mgmt
Financing live
Cash to close
- Down payment
- $49,250
- Closing costs
- $5,910
- Reserves months
- —
- Total cash needed
- —
Loan-product check · same deal, 3 products live
Conventional
25% down · 7.5% · 30yr
- Down + closing
- —
- Monthly P&I
- —
- Monthly cashflow
- —
- DSCR
- —
- Eligible?
- —
Personal DTI + credit; lowest rate.
DSCR
20% down · 8.5% · 30yr
- Down + closing
- —
- Monthly P&I
- —
- Monthly cashflow
- —
- DSCR
- —
- Eligible?
- —
No personal income docs; deal must DSCR.
Hard money
10% down · 12.0% · 12mo
- Down + closing
- —
- Monthly P&I
- —
- Monthly cashflow
- —
- DSCR
- —
- Eligible?
- —
Short-term bridge; refi at stabilization.
Rent comps 5 comps
| Address | Beds | Baths | Sqft | Rent | $/sqft | DOM | Units | Dist |
|---|---|---|---|---|---|---|---|---|
| 310 10th St Unit B Nolanville, TX | 3.0 | 2.0 | 1281 | $1,095 | $0.85 | 46d | 1 | 0.40mi |
| 408 W St John Ave Apt A Nolanville, TX | 3.0 | 2.0 | 1250 | $1,100 | $0.88 | 46d | 1 | 0.61mi |
| 402 Topeka Ct Unit B Nolanville, TX | 3.0 | 2.0 | 1200 | $1,300 | $1.08 | 46d | 1 | 0.64mi |
| 240 W Elm St Unit A Nolanville, TX | 3.0 | 2.0 | 1200 | $1,600 | $1.33 | 25d | 1 | 0.67mi |
| 202 East Avenue H Unit H Nolanville, TX | 3.0 | 2.0 | 1384 | $1,550 | $1.12 | 25d | 1 | 0.77mi |
Listing history 24 events
-
2026-06-22days on market $197,000 Active 45 DOM
-
2026-06-18days on market $197,000 Active 42 DOM
-
2026-06-17days on market $197,000 Active 41 DOM
-
2026-06-16days on market $197,000 Active 40 DOM
-
2026-06-15days on market $197,000 Active 39 DOM
-
2026-06-14days on market $197,000 Active 37 DOM
-
2026-06-13days on market $197,000 Active 36 DOM
-
2026-06-10days on market $197,000 Active 34 DOM
-
2026-06-09days on market $197,000 Active 33 DOM
-
2026-06-08days on market $197,000 Active 32 DOM
-
2026-06-07days on market $197,000 Active 31 DOM
-
2026-06-03days on market $197,000 Active 27 DOM
-
2026-06-02days on market $197,000 Active 26 DOM
-
2026-06-01days on market $197,000 Active 25 DOM
-
2026-05-31days on market $197,000 Active 24 DOM
-
2026-05-30days on market $197,000 Active 23 DOM
-
2026-05-07$197,000 Active 585-char remark
-
2018-06-28historical
-
2018-05-18price $94,900
-
2018-04-20$99,000 Active
-
2015-07-17soldstatus
-
1998-05-14soldstatus
-
1996-07-03soldstatus
-
1995-12-15soldstatus
ⓘ Source: listings_history table (triggers on properties + properties_extension) + one-shot
backfill from property_details.listing_events for pre-trigger history.
Tax reassessment forecast TX · Resets to sale price
- Current annual tax
- $3,258 · $271/mo
- Projected year-2 tax
- $3,605 · $300/mo
- Expected delta
- +$347/yr (+$29/mo · 10.7%)
ⓘ Screening estimate from a state-policy table — verify with the county assessor before closing.
Climate risk First Street
- Flood 1/10 Low FEMA zone X (unshaded) · 0% chance over 30 yrs
- Wildfire 5/10 Major
- Heat 8/10 Severe 7 d/yr ≥108°F today · 25 d/yr by 30 yrs out
- Wind 6/10 Major 67% chance of damaging wind over 30 yrs
- Air quality 2/10 Low 0 unhealthy d/yr today · 1 by 30 yrs out
Nearby sold comps map
Loading sold comps map…
Walkable amenities ~0.75 mi
Loading nearby amenities…
Taxation est. · year 1
- Rental income
- $15,511
- − Mortgage interest
- −$11,035
- − Property taxes
- −$3,258
- − Insurance
- −$985
- − Repairs & maintenance
- −$1,241
- − Management
- −$1,241
- − Depreciation
- −$5,731
- Taxable loss
- −$7,980
- Est. tax savings @ 24.0%
- +$1,915
- After-tax cash flow
- $-2,471/yr
For passive investors: Depreciation is non-cash, so a rental often shows a tax loss while cash-flowing — sheltering income. Rental losses are passive: they offset passive income freely, and up to $25,000/yr can offset ordinary (W-2) income if you actively participate and your MAGI is under $100k (phasing out to $0 by $150k); unused losses carry forward. On sale, claimed depreciation is recaptured at up to 25%, and gains may owe capital-gains tax (a 1031 exchange can defer both). Figures are a year-1 estimate at your 24.0% rate — not tax advice; consult a CPA.
Schools (NCES district)
- District
- Killeen ISD
- NCES district ID
- 4825660
- Math proficiency
- 31% ▼ -16.00%
- Reading proficiency
- 38% ▼ -3.00%
- Median HH income
- $47,665
- Composite
- 29.69/100
- National rank
- #6458
- State rank
- #524 of 826 in TX
Livability — Nolanville
- Score
- 74/100
- State rank
- #176
- US rank
- #4655
Category grades
Schools grade is shown separately in the Schools card above.
Census & demographics
- Census place
- Nolanville, TX
- City population
- 6,896
- Population (ZIP)
- 6,896
Population outlook (Bell County) Hauer SSP2
- Today (2025)
- 371,114 people
- By 2030
- 389,104 · +4.8%
- By 2040
- 420,592 · +13.3%
- By 2050
- 447,779 · +20.7%
- By 2075
- 499,130 · +34.5%
- By 2100
- 505,680 · +36.3%
Race, ethnicity, and origin ACS 2023
- Neighborhood character
- Diverse neighborhood (Simpson 0.65)
- Race & ethnicity
- White 52% Hispanic / Latino 20% Black 20% Two or more races 6% Asian 5% Pacific Islander 2%
- Hispanic origin (detail)
- Mexican 16% Puerto Rican 1%
- Common ancestry
- Italian 2% Lithuanian 1% Danish 1%
- Foreign-born
- 8% · Canada, Vietnam, South Korea
- Languages at home
- 88% English-only · Spanish 9% Other Indo-European 1% Korean 1%
Political lean MEDSL · Bell
- 2024 margin
- R (+16.2) · D 41.3% · R 57.6% · Other 1.1%
- 2008→2024 swing
- -6.5pp toward R · 2008: -9.8pp · 2024: -16.2pp
- All cycles
- 2024: R+16.2 2020: R+8.5 2016: R+15.1 2012: R+16.4 2008: R+9.8
Not yet ingested
- Civics
- —
Market trends
- HPI YoY
- ▬ 0.04%
- Current HPI
- 170.1375
- Rent YoY
- —
- Metro
- —
- State GDP YoY
- ▲ 3.95%
- F500 in state
- 110
Industry mix (Fortune 500 HQ in TX)
| Industry | F500 HQs | Revenue |
|---|---|---|
| Energy | 16 | $1,198B |
|
||
| Technology | 5 | $198B |
|
||
| Engineering / Construction | 4 | $72B |
|
||
| Energy Services | 3 | $60B |
|
||
| Utilities | 3 | $41B |
|
||
| Healthcare | 2 | $330B |
|
||
Price history
+99.0% since first listed8 events — show timeline
- 2026-05-07 Listed $197,000 CTXMLS
- 2018-06-28 Listing Removed — CTXMLS
- 2018-05-18 Price Changed $94,900 CTXMLS
- 2018-04-20 Listed $99,000 CTXMLS
- 2015-07-17 Sold (Public Records) — Public Records
- 1998-05-14 Sold (Public Records) — Public Records
- 1996-07-03 Sold (Public Records) — Public Records
- 1995-12-15 Sold (Public Records) — Public Records
Property tax history
+7.7%/yrLatest (2026): $3,258 · -2.4% YoY. Source: county tax records.
Cash-flow waterfall
monthlySold comps — $/sqft
last 12 mo · ≤1 miLoading sold comps…