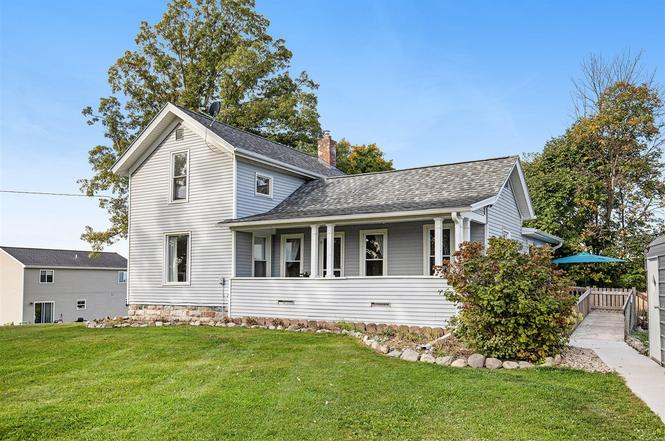
800 Bachman Rd · Hastings, MI
Flood risk 1/10 · Minimal
- FEMA flood zone
- X (unshaded)
- Chance of flooding over 30 yrs
- 0.0%
- Est. flood insurance / yr
- $507 – $1,088
Fire risk 1/10 · Minimal
- Est. fire insurance / yr
- $784 – $1,456
Heat risk 2/10 · Minimal
- Hot days now (above 98°F)
- 7 days/yr
- Hot days in 30 yrs
- 16 days/yr
Wind risk 2/10 · Minimal
- Chance of severe wind over 30 yrs
- —
Air-quality risk 2/10 · Minimal
- Unhealthy air days now
- 1 days/yr
- Unhealthy air days in 30 yrs
- 1 days/yr
Risk factors via First Street. Map © Google.
Why this score? — see what drove the C- grade
The composite is a weighted blend of 9 inputs, each scored 0–100. Each bar is that input's sub-score; the figure is the points it added to the 100-point composite (weight × sub-score).
- Cash flow +20.4/30.0
- ARV discount +7.3/15.0
- DSCR +6.5/10.0
- 1% rule +5.4/10.0
- Livability +4.0/5.0
- Schools +3.5/10.0
- Rent growth +2.5/5.0
- Condition / age +2.5/5.0
- Appreciation +0.0/10.0
$239,900
🖨 Deal sheet 📄 Offer letter ✓ Due diligence
Listing remarks MLS
Classic farmhouse on just under an acre with idyllic farm views. Blending old-world charm and modern updates, this home features original wood floors on the main level, a detached garage, and storage shed. New roof in 2025. Perfectly priced to finish the upstairs renovation and make it your own!
Key facts
- Original wood floors
- Storage shed
- New roof
Tags
Neighborhood map
What this means for you Summary
Snapshot
- This is a 4-bed/1.0-bath single-family listed at $240k.
Deal economics
- At list price, monthly cash flow is $313 ($4k/yr) — positive.
- The deal already cash-flows at list — no discount required.
- Meets the 1% rule at list price ($2k rent vs $240k).
- Cap rate 7.9% vs local median 4.0% in Hastings — top-decile yield for the area; either an underpriced asset or a hidden risk that comps aren't pricing in. Stress-test before assuming the spread holds.
Location & tenants
- Location reads 79/100 on livability (#95 in MI, #2,201 nationally) — a middle-class / working-renter tenant base. Strengths: amenities A+, cost of living A+, housing A+; Watch: schools C-, employment D, commute F.
- Hastings Area School District (town): math 33% / reading 48% proficiency, ranked #203 of 540 in MI (top 38%) — families likely to look elsewhere, expect single-tenant / working-renter base with shorter leases.
- Market conditions: 136 active listings in the ZIP; 1 comparable units currently listed for rent nearby; 171 units permitted in Barry County in 2024 (0 in 5+ unit buildings).
Forward outlook
- Local home prices are declining (-3.0%/yr); year-one equity from $2k of loan paydown is wiped out by about $7k of value loss. Plan a longer hold.
- Barry County population projected at -11% by 2050 — secular population decline; favor cash flow + early exit over multi-decade hold.
Negotiation context
- Only 6 days on market — expect competitive offers; lowballing is unlikely to land.
- 3 sale attempts with the ask held roughly flat each time — persistent listings suggest the price (not the market) is what's stuck; bring a comps-based counter.
Risks & watch-outs
- Watch-outs: built in 1873 — expect roof / HVAC / electrical / plumbing capex.
Questions for the listing agent
- Built in 1873 — when were the roof, HVAC, electrical panel, plumbing, and water heater last replaced?
- Is there a deadline driving the sale (1031 exchange, divorce, estate, relocation)? That informs how much negotiation room exists.
- What's the average days-on-market for RENTAL listings here right now (not sales)? A rising rental-DOM trend means longer vacancies and softer asking-rent achievability than the comps imply.
- What's the recent tenant-quality profile in this submarket — average credit score on applications, eviction rate, late-payment / NSF rate, and stable-employment percentage? A property-management company in the area should have these aggregated.
- How much new for-sale + rental construction is in the pipeline within 1–3 miles? Heavy new supply typically softens prices + rents 12–24 months out; constrained supply supports both.
Investment metrics
- 1% rule
- 1.04% ✓
- Cap rate
- 7.86%
- Cash-on-cash
- 5.59%
- DSCR
- 1.25
- GRM
- 8.0
CMA / ARV
- ARV (on-the-fly)
- $238,887
- Comps found
- 7
Show comp detail 7 sales within ~0.75 mi
| Address | Dist | Beds/Ba | Sqft | Sold | Price | $/sf | Match |
|---|---|---|---|---|---|---|---|
| 515 E William St | 0.46mi | 3/1.5 (-1) | 1,373 (-2%) | 8mo | $270,000 | $197 | 62 |
| 727 N East St | 0.71mi | 3/1.0 (-1) | 1,384 (-1%) | 7mo | $174,000 | $126 | 54 |
| 1611 N Jefferson St | 0.58mi | 3/2.0 (-1) | 1,293 (-7%) | 13mo | $235,000 | $182 | 41 |
| 330 E Francis St | 0.52mi | 3/2.0 (-1) | 1,508 (+8%) | 20mo | $230,000 | $153 | 37 |
| 703 E Colfax St | 0.64mi | 3/1.0 (-1) | 1,302 (-7%) | 22mo | $225,000 | $173 | 35 |
| 409 E Colfax St | 0.71mi | 3/1.0 (-1) | 1,200 (-14%) | 18mo | $195,000 | $163 | 24 |
| 529 E Colfax St | 0.66mi | 3/1.0 (-1) | 1,200 (-14%) | 24mo | $205,000 | $171 | 21 |
Match score weights: distance 35% · size 25% · config 20% · recency 20%. Top-matched comps best support the ARV.
Projected returns pro-forma
-3.0% appreciation · 3.0% rent growth · sell at horizon
- IRR
- -7.6%
- Equity multiple
- 0.72×
- Total profit
- $-18,891
- Equity at exit
- $35,770
- IRR
- 2.0%
- Equity multiple
- 1.14×
- Total profit
- $9,385
- Equity at exit
- $20,742
Cash invested: $67,172 (down + closing). Projections, not guarantees.
Landlord ↔ Tenant lean methodology
- Overall (STATE)
- 62 Landlord-Friendly
- State Michigan
- 62 Landlord-Friendly · EVEN
- County
- — inherits STATE
- City
- — inherits STATE
ZIP-level market 49058
- Active inventory
- 136
- Price-to-rent
- 8.0×
Monthly cashflow live
- Estimated rent
- $2,495 medium interval (Pro) →
- Mortgage (P&I)
- −$1,258
- Tax est. 1.5%
- −$300 /mo · $3,598/yr
- Insurance
- −$100
- HOA
- −$0
- Vacancy / Maint / Mgmt
- −$524
- Net cashflow
- $313
Break-even live
UW: 25.0% down · 7.5% · 30yr · 1.5% tax · 5.0% vac · 8.0% maint · 8.0% mgmt
Financing live
Cash to close
- Down payment
- $59,975
- Closing costs
- $7,197
- Reserves months
- —
- Total cash needed
- —
Loan-product check · same deal, 3 products live
Conventional
25% down · 7.5% · 30yr
- Down + closing
- —
- Monthly P&I
- —
- Monthly cashflow
- —
- DSCR
- —
- Eligible?
- —
Personal DTI + credit; lowest rate.
DSCR
20% down · 8.5% · 30yr
- Down + closing
- —
- Monthly P&I
- —
- Monthly cashflow
- —
- DSCR
- —
- Eligible?
- —
No personal income docs; deal must DSCR.
Hard money
10% down · 12.0% · 12mo
- Down + closing
- —
- Monthly P&I
- —
- Monthly cashflow
- —
- DSCR
- —
- Eligible?
- —
Short-term bridge; refi at stabilization.
Rent comps 1 comps
| Address | Beds | Baths | Sqft | Rent | $/sqft | DOM | Units | Dist |
|---|---|---|---|---|---|---|---|---|
| 634 E North St Hastings, MI | 3.0 | 2.5 | 1840 | $2,495 | $1.36 | 3d | 1 | 0.13mi |
Listing history 10 events
-
2025-10-31soldstatus $245,000
-
2025-10-09status Pending 296-char remark
Show marketing remark (296 chars)
Classic farmhouse on just under an acre with idyllic farm views. Blending old-world charm and modern updates, this home features original wood floors on the main level, a detached garage, and storage shed. New roof in 2025. Perfectly priced to finish the upstairs renovation and make it your own!
-
2025-10-09status Pending
Show marketing remark (296 chars)
Classic farmhouse on just under an acre with idyllic farm views. Blending old-world charm and modern updates, this home features original wood floors on the main level, a detached garage, and storage shed. New roof in 2025. Perfectly priced to finish the upstairs renovation and make it your own!
-
2025-10-03$239,900 Active 296-char remark
Show marketing remark (296 chars)
Classic farmhouse on just under an acre with idyllic farm views. Blending old-world charm and modern updates, this home features original wood floors on the main level, a detached garage, and storage shed. New roof in 2025. Perfectly priced to finish the upstairs renovation and make it your own!
-
2025-10-03$239,900 Active
Show marketing remark (296 chars)
Classic farmhouse on just under an acre with idyllic farm views. Blending old-world charm and modern updates, this home features original wood floors on the main level, a detached garage, and storage shed. New roof in 2025. Perfectly priced to finish the upstairs renovation and make it your own!
-
2025-05-21soldstatus $230,000
-
2017-04-17soldstatus $55,000
-
2016-12-29soldstatus $275,000
ⓘ Source: listings_history table (triggers on properties + properties_extension) + one-shot
backfill from property_details.listing_events for pre-trigger history.
Climate risk First Street
- Flood 1/10 Low FEMA zone X (unshaded) · 0% chance over 30 yrs
- Wildfire 1/10 Low
- Heat 2/10 Low 7 d/yr ≥98°F today · 16 d/yr by 30 yrs out
- Wind 2/10 Low
- Air quality 2/10 Low 1 unhealthy d/yr today · 1 by 30 yrs out
Nearby sold comps map
Loading sold comps map…
Walkable amenities ~0.75 mi
Loading nearby amenities…
Taxation est. · year 1
- Rental income
- $29,940
- − Mortgage interest
- −$13,438
- − Property taxes
- −$3,598
- − Insurance
- −$1,200
- − Repairs & maintenance
- −$2,395
- − Management
- −$2,395
- − Depreciation
- −$6,979
- Taxable loss
- −$65
- Est. tax savings @ 24.0%
- +$16
- After-tax cash flow
- $3,774/yr
For passive investors: Depreciation is non-cash, so a rental often shows a tax loss while cash-flowing — sheltering income. Rental losses are passive: they offset passive income freely, and up to $25,000/yr can offset ordinary (W-2) income if you actively participate and your MAGI is under $100k (phasing out to $0 by $150k); unused losses carry forward. On sale, claimed depreciation is recaptured at up to 25%, and gains may owe capital-gains tax (a 1031 exchange can defer both). Figures are a year-1 estimate at your 24.0% rate — not tax advice; consult a CPA.
Schools (NCES district)
- District
- Hastings Area School District
- NCES district ID
- 2617970
- Math proficiency
- 33% ▼ -5.00%
- Reading proficiency
- 48% ▼ -2.00%
- Median HH income
- $48,478
- Composite
- 34.71/100
- National rank
- #5137
- State rank
- #203 of 540 in MI
Livability — Hastings
- Score
- 79/100
- State rank
- #95
- US rank
- #2201
Category grades
Schools grade is shown separately in the Schools card above.
Census & demographics
- Census place
- Hastings, MI
- City population
- 19,513
- Population (ZIP)
- 19,513
Population outlook (Barry County) Hauer SSP2
- Today (2025)
- 59,601 people
- By 2030
- 59,185 · -0.7%
- By 2040
- 57,121 · -4.2%
- By 2050
- 53,139 · -10.8%
- By 2075
- 42,814 · -28.2%
- By 2100
- 29,357 · -50.7%
Race, ethnicity, and origin ACS 2023
- Neighborhood character
- Predominantly White (92%)
- Race & ethnicity
- White 92% Two or more races 5% Hispanic / Latino 3%
- Common ancestry
- Iranian 8% Romanian 3% Lithuanian 3%
- Foreign-born
- 3% · Canada
- Languages at home
- 96% English-only · Spanish 2% German/W. Germanic 1%
Political lean MEDSL · Barry
- 2024 margin
- Solid R (+34.3) · D 32.1% · R 66.4% · Other 1.5%
- 2008→2024 swing
- -24.6pp toward R · 2008: -9.8pp · 2024: -34.3pp
- All cycles
- 2024: R+34.3 2020: R+32.5 2016: R+33.3 2012: R+18.1 2008: R+9.8
Not yet ingested
- Civics
- —
Market trends
- HPI YoY
- ▼ -137.56%
- Current HPI
- 224.6353
- Rent YoY
- —
- Metro
- —
- State GDP YoY
- ▲ 1.37%
- F500 in state
- 28
Industry mix (Fortune 500 HQ in MI)
| Industry | F500 HQs | Revenue |
|---|---|---|
| Automotive Parts | 3 | $48B |
|
||
| Automotive | 2 | $372B |
|
||
| Chemicals | 1 | $45B |
|
||
| Automotive Retail | 1 | $29B |
|
||
| Healthcare / Medical Devices | 1 | $23B |
|
||
| Automotive Technology | 1 | $20B |
|
||
Price history
-10.9% since first listed10 events — show timeline
- 2025-10-31 Sold (Public Records) $245,000 Public Records
- 2025-10-09 Pending — REALCOMP
- 2025-10-09 Pending — MiRealSource-MiMLS
- 2025-10-09 Pending — SW Michigan MLS
- 2025-10-03 Listed $239,900 REALCOMP
- 2025-10-03 Listed $239,900 SW Michigan MLS
- 2025-10-03 Listed $239,900 MiRealSource-MiMLS
- 2025-05-21 Sold (Public Records) $230,000 Public Records
- 2017-04-17 Sold (Public Records) $55,000 Public Records
- 2016-12-29 Sold (Public Records) $275,000 Public Records
Cash-flow waterfall
monthlySold comps — $/sqft
last 12 mo · ≤1 miLoading sold comps…