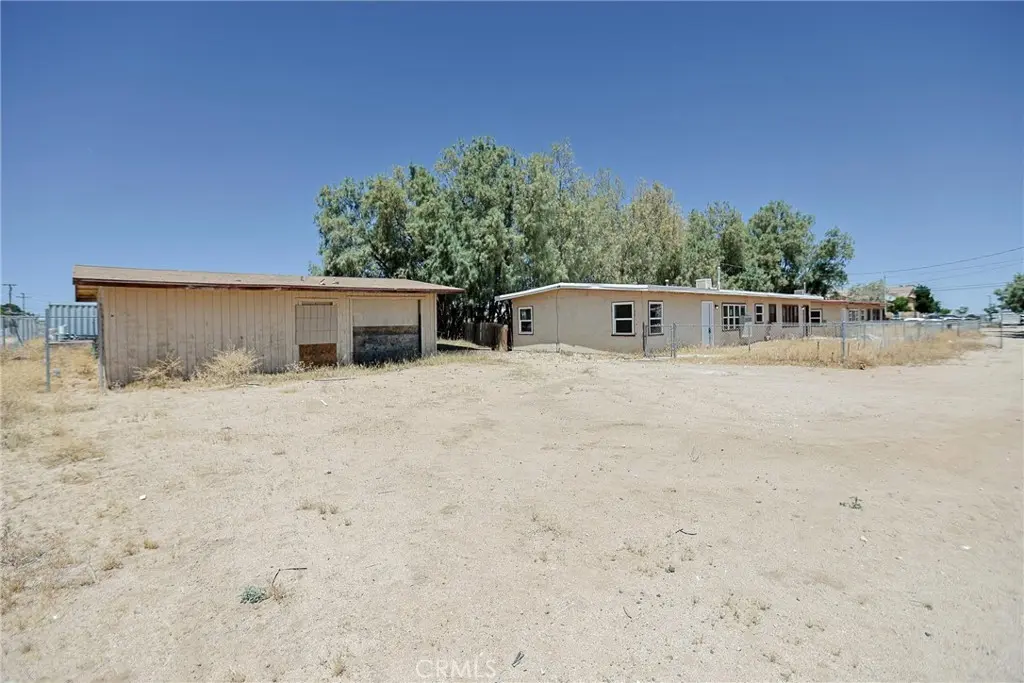
 Fourplex
11389 Lee · Adelanto, CA
Flood risk 1/10 · Minimal
- FEMA flood zone
- X (shaded)
- Chance of flooding over 30 yrs
- 0.0%
- Est. flood insurance / yr
- $507 – $1,088
Fire risk 4/10 · Minor
- Est. fire insurance / yr
- $659 – $1,223
Heat risk 7/10 · Major
- Hot days now (above 99°F)
- 5 days/yr
- Hot days in 30 yrs
- 13 days/yr
Wind risk 1/10 · Minimal
- Chance of severe wind over 30 yrs
- —
Air-quality risk 8/10 · Major
- Unhealthy air days now
- 16 days/yr
- Unhealthy air days in 30 yrs
- 20 days/yr
Risk factors via First Street. Map © Google.
Why this score? — see what drove the B+ grade
The composite is a weighted blend of 9 inputs, each scored 0–100. Each bar is that input's sub-score; the figure is the points it added to the 100-point composite (weight × sub-score).
- Cash flow +30.0/30.0
- DSCR +10.0/10.0
- Appreciation +10.0/10.0
- 1% rule +8.7/10.0
- ARV discount +7.5/15.0
- Rent growth +3.7/5.0
- Condition / age +2.5/5.0
- Livability +2.4/5.0
- Schools +2.2/10.0
$439,900
🖨 Deal sheet (PDF) 📄 Offer letter ✓ Due diligence
Multi-family units
County records classify this as Multi-Family (2-4 Unit). Listing-text estimate: 4 units. confirmed
Listing remarks
Investor Alert: Immediate cash flow with massive pro-forma upside and development flexibility. This 4-unit income property sits on a flat, usable 1.14-acre lot in Adelanto, featuring rare Mixed-Use (MU) zoning that opens the door for future expansion, higher-density residential additions, or a live-work commercial play. The Units & Income Potential:Unit 1 (3BR/1BA): Vacant. Light rehab completed April 2026. Move-in ready. (Projected Market Rent: $2089). Unit 2 (1BR/1BA): Vacant. Light rehab completed April 2026. Move-in ready. (Projected Market Rent: $1194). Unit 3 (1BR/1BA): Vacant and rental-ready. (Projected Market Rent: $1194). Unit 4 (1BR/1BA): Occupied. Current rent is $680, wel
Key facts
- Flat usable lot
- Mixed-use zoning
- Detached garage
Tags
Property features AI
Finance
- Other: Parcel and assessor data used for lot and year-built info
- Financial info: Total building area reported as 2,736; Total of 4 units; Gross scheduled income: $68,052; Gross income: $68,052; Net operating income: $52,375.57; Operating/annual expenses reported: $12,273 (operating expense); Expense details include insurance ($2,674), trash ($2,664), water/sewer ($1,200); At least one unit currently leased (1 leased unit); One unit reported with actual rent of $680
Exterior
- Parking: Two off-street parking spaces; Gated on-site parking; Driveway (unpaved)
- Security: Carbon monoxide and smoke detectors
- Utilities: Natural gas connected; Electricity connected; Water connected (district/public); Sewer not available (septic status unknown); Separate meters: 4 electric, 4 gas, 1 water
- Home design: Attached property; Updated/remodeled condition; Single-story; Two buildings on the parcel; Two or more common walls
- Construction: Concrete and block construction; Concrete slab foundation; Flat roof
- Exterior features: Flat roof; Chain link and wood fencing; No pool; Lot suitable for low-density development (0–1 unit/acre); Street lighting and sidewalks in the community; Unpaved road access
Interior
- Kitchen: Microwave; Refrigerator; Gas range; Freezer
- Bedrooms: Primary bedroom (main floor); Main floor bedroom; Units include one 3-bed unit and three 1-bed units
- Flooring: Vinyl flooring
- Bathrooms: Multiple units with one full bathroom each
- Heating & cooling: Wall heater; Evaporative cooling
- Interior features: Beamed ceilings; Ceiling fan; Unfurnished; Screens on windows; Carbon monoxide and smoke detectors; Single-level (one story); Ground-level entry
- Laundry & utility: Washer hookup; Gas dryer hookup; Laundry available
Neighborhood map
What this means for you Summary
Snapshot
- This is a 1×3.0bd/1.0ba + 3×1.0bd/1.0ba units multifamily listed at $440k.
Deal economics
- At list price, monthly cash flow is $2k ($22k/yr) — positive. Per door: $455/mo.
- The deal already cash-flows at list — no discount required.
- Meets the 1% rule at list price ($6k rent vs $440k).
- Recommended offer: $433k (1.5% below list) — sets the bar for market timing.
- Cap rate 11.3% vs local median 4.2% in Adelanto — top-decile yield for the area; either an underpriced asset or a hidden risk that comps aren't pricing in. Stress-test before assuming the spread holds.
Location & tenants
- Location reads 47/100 on livability (#1,250 in CA) — a working-class tenant base; expect higher turnover. Strengths: housing A+; Watch: crime D, amenities F, commute F.
- Victor Valley Union High (urban): math 25% / reading 25% proficiency, ranked #407 of 517 in CA (top 79%) — low school quality limits family demand, transient renter base, plan for 1-2y turnover; 72% free/reduced lunch — lower-income household profile, screen leases tightly.
- Zoned schools: Gus Franklin Jr. (math 24% / reading 24%, grade F, #973 of 1,571 statewide, top 73%, 549 students, 63% FRL); Mesa Linda Middle (775 students, 77% FRL); Adelanto High (2,223 students, 71% FRL) — zoned schools at 70% FRL track the district average.
- Market conditions: Rents rising fast (+4.7%/yr); 631 active listings in the ZIP; 5,458 units permitted in San Bernardino County in 2024 (1,500 in 5+ unit buildings).
Forward outlook
- In year one you build about $47k of equity ($3k loan paydown + $44k appreciation (10.0% local appreciation)).
- San Bernardino County population projected at +15% by 2050 — modest demand growth; plan on rents tracking national, not racing it.
- At projected returns (10.0% appreciation + 4.7% rent growth), your $123k cash investment doubles in ~2 years — after that, you're playing with house money.
- By year 2, paydown + projected appreciation supports a ~$76k cash-out refi (75% LTV) — recoverable capital for the next deal without selling this one.
Negotiation context
- It's been on market 25 days — a 2% lower offer ($433k) is reasonable based on typical stale-listing flexibility.
- 23 sale attempts since 19y ago with the ask held roughly flat each time — persistent listings suggest the price (not the market) is what's stuck; bring a comps-based counter.
Risks & watch-outs
- Watch-outs: built in 1956 — expect roof / HVAC / electrical / plumbing capex.
- Climate carrying-cost: extreme-heat days projected 5→13/yr by 2055 (HVAC capex compounding) — expect insurance premiums to compound above CPI over the hold.
Questions for the listing agent
- Can we see the unit-by-unit rent roll, current vacancy, and any below-market leases? What's the average tenancy length?
- What capital expenditures (roof, boiler, parking lot, exteriors) have been made in the last 5 years, and what's planned in the next 2?
- Built in 1956 — when were the roof, HVAC, electrical panel, plumbing, and water heater last replaced?
- Is there a deadline driving the sale (1031 exchange, divorce, estate, relocation)? That informs how much negotiation room exists.
- Schools are F-rated, which usually means shorter tenancies and higher turnover. Who's the typical renter profile here, and what's been the actual vacancy rate?
- Crime grade is D in this area — have there been break-ins, vandalism, or insurance claims at this property in the last 3 years? What carrier currently insures it and at what premium?
- What's the average days-on-market for RENTAL listings here right now (not sales)? A rising rental-DOM trend means longer vacancies and softer asking-rent achievability than the comps imply.
- What's the recent tenant-quality profile in this submarket — average credit score on applications, eviction rate, late-payment / NSF rate, and stable-employment percentage? A property-management company in the area should have these aggregated.
- How much new apartment / multifamily construction is in the pipeline within 1–3 miles? Heavy new supply (>2% of stock underway) typically softens rents 12–24 months out; light construction supports rent growth.
Investment metrics
- 1% rule
- 1.37% ✓
- Cap rate
- 11.26%
- Cash-on-cash
- 17.74%
- DSCR
- 1.79
- GRM
- 6.1
CMA / ARV
No comps found within radius.
Projected returns pro-forma
10.0% appreciation · 4.68% rent growth · sell at horizon
- IRR
- 38.3%
- Equity multiple
- 3.97×
- Total profit
- $365,971
- Equity at exit
- $396,297
- IRR
- 33.6%
- Equity multiple
- 9.19×
- Total profit
- $1,009,129
- Equity at exit
- $854,629
Cash invested: $123,172 (down + closing). Projections, not guarantees.
Landlord ↔ Tenant lean methodology
- Overall (STATE)
- 18 Strongly Tenant-Friendly
- State California
- 18 Strongly Tenant-Friendly · D+13
- County
- — inherits STATE
- City
- — inherits STATE
ZIP-level market 92301
- Home prices YoY
- 10.0%
- Rents YoY
- 4.7%
- Active inventory
- 631
- Price-to-rent
- 19.2×
Monthly cashflow live
- Estimated rent
- $6,037 medium interval (Pro) →
- Mortgage (P&I)
- −$2,307
- Tax from tax record
- −$458 /mo · $5,497/yr
- Insurance
- −$183
- HOA
- −$0
- Vacancy / Maint / Mgmt
- −$1,268
- Net cashflow
- $1,821
Break-even live
Sensitivity live
| Price | -10% $2,070 | -5% $1,946 | +0% $1,821 | +5% $1,696 | +10% $1,572 |
|---|---|---|---|---|---|
| Rent | -10% $1,344 | -5% $1,583 | +0% $1,821 | +5% $2,059 | +10% $2,298 |
| Rate | -1.0pp $2,043 | -0.5pp $1,933 | base $1,821 | +0.5pp $1,707 | +1.0pp $1,591 |
4-unit breakdown (identical units grouped — click to expand)
| Units | Beds | Baths | Est. rent |
|---|---|---|---|
| 1× unit | 3.0 | 1 | $1,911 |
| 3× units | 1.0 | 1 | $4,128 |
| #2 | 1.0 | 1 | $1,376 |
| #3 | 1.0 | 1 | $1,376 |
| #4 | 1.0 | 1 | $1,376 |
| Total (4 units) | $6,037 | ||
UW: 25.0% down · 7.5% · 30yr · 1.5% tax · 5.0% vac · 8.0% maint · 8.0% mgmt
Financing live
Cash to close
- Down payment
- $109,975
- Closing costs
- $13,197
- Reserves months
- —
- Total cash needed
- —
Loan-product check · same deal, 3 products live
Conventional
25% down · 7.5% · 30yr
- Down + closing
- —
- Monthly P&I
- —
- Monthly cashflow
- —
- DSCR
- —
- Eligible?
- —
Personal DTI + credit; lowest rate.
DSCR
20% down · 8.5% · 30yr
- Down + closing
- —
- Monthly P&I
- —
- Monthly cashflow
- —
- DSCR
- —
- Eligible?
- —
No personal income docs; deal must DSCR.
Hard money
10% down · 12.0% · 12mo
- Down + closing
- —
- Monthly P&I
- —
- Monthly cashflow
- —
- DSCR
- —
- Eligible?
- —
Short-term bridge; refi at stabilization.
Listing history 50 events
-
2026-06-21days on market $439,900 Active 25 DOM
-
2026-06-18days on market $439,900 Active 22 DOM
-
2026-06-17days on market $439,900 Active 21 DOM
-
2026-06-16days on market $439,900 Active 20 DOM
-
2026-06-15days on market $439,900 Active 19 DOM
-
2026-06-13days on market $439,900 Active 17 DOM
-
2026-06-09days on market $439,900 Active 13 DOM
-
2026-06-08days on market $439,900 Active 12 DOM
-
2026-06-07days on market $439,900 Active 11 DOM
-
2026-06-04days on market $439,900 Active 8 DOM
-
2026-06-03days on market $439,900 Active 7 DOM
-
2026-06-02days on market $439,900 Active 6 DOM
-
2026-06-01days on market $439,900 Active 5 DOM
-
2026-05-31days on market $439,900 Active 4 DOM
-
2026-05-27$439,900 Active
-
2026-03-20historical
-
2026-03-15status Active
-
2026-02-11historical Active Under Contract
-
2026-01-18status Active
-
2026-01-08historical Active Under Contract
-
2025-12-22historical
-
2025-12-21status Active
-
2025-12-20status Active
-
2025-12-20$475,000 Active
-
2025-12-19$475,000 Active
-
2025-12-19historical
-
2025-10-02historical
-
2025-04-30$569,000 Active
-
2025-04-08historical
-
2025-01-24price $599,990
-
2024-10-11$649,990 Active
-
2023-04-28soldstatus $441,000 Closed Sale
-
2023-04-27soldstatus $442,000
-
2023-03-16historical Active Under Contract
-
2022-08-27$449,900 Active
-
2021-11-25historical
-
2020-08-06historical
-
2020-04-23historical
-
2020-04-06$346,000 Active
-
2020-01-23$346,000
-
2020-01-06historical
-
2019-09-06$349,000
-
2019-07-22historical
-
2019-07-22historical
-
2019-06-11$360,000
-
2019-06-11$360,000
-
2018-10-30historical
-
2014-02-28soldstatus $125,000 Closed
-
2014-02-28soldstatus $125,000
-
2014-01-16status Pending
ⓘ Source: listings_history table (triggers on properties + properties_extension) + one-shot
backfill from property_details.listing_events for pre-trigger history.
Tax reassessment forecast CA · Resets to sale price
- Current annual tax
- $5,497 · $458/mo
- Projected year-2 tax
- $5,497 · $458/mo
- Expected delta
- $0/yr ($0/mo · 0.0%)
ⓘ Screening estimate from a state-policy table — verify with the county assessor before closing.
Climate risk First Street
- Flood 1/10 Low FEMA zone X (shaded) · 0% chance over 30 yrs
- Wildfire 4/10 Moderate
- Heat 7/10 Severe 5 d/yr ≥99°F today · 13 d/yr by 30 yrs out
- Wind 1/10 Low
- Air quality 8/10 Severe 16 unhealthy d/yr today · 20 by 30 yrs out
Nearby sold comps map
Loading sold comps map…
Walkable amenities ~0.75 mi
Loading nearby amenities…
Taxation est. · year 1
- Rental income
- $72,444
- − Mortgage interest
- −$24,641
- − Property taxes
- −$5,497
- − Insurance
- −$2,200
- − Repairs & maintenance
- −$5,796
- − Management
- −$5,796
- − Depreciation
- −$12,797
- Taxable income
- $15,718
- Est. tax owed @ 24.0%
- −$3,772
- After-tax cash flow
- $18,080/yr
For passive investors: Depreciation is non-cash, so a rental often shows a tax loss while cash-flowing — sheltering income. Rental losses are passive: they offset passive income freely, and up to $25,000/yr can offset ordinary (W-2) income if you actively participate and your MAGI is under $100k (phasing out to $0 by $150k); unused losses carry forward. On sale, claimed depreciation is recaptured at up to 25%, and gains may owe capital-gains tax (a 1031 exchange can defer both). Figures are a year-1 estimate at your 24.0% rate — not tax advice; consult a CPA.
Schools (NCES district)
- District
- Victor Valley Union High
- NCES district ID
- 0636972
- Math proficiency
- 25% ▲ 6.00%
- Reading proficiency
- 25% ▼ -12.00%
- Median HH income
- $45,112
- Composite
- 21.6/100
- National rank
- #8296
- State rank
- #407 of 517 in CA
Livability — Adelanto
- Score
- 47/100
- State rank
- #1250
- US rank
- #26338
Category grades
Schools grade is shown separately in the Schools card above.
Census & demographics
- Census place
- Adelanto, CA
- County
- San Bernardino County · 2,030,291 people
- City population
- 38,577
- Metro
- Riverside-San Bernardino-Ontario, CA
- Population (ZIP)
- 38,577
- Household income
- $68,676
- Rent vs Own
- Severe rent burden
- 1345.0
Population outlook (San Bernardino County) Hauer SSP2
- Today (2025)
- 2,300,329 people
- By 2030
- 2,378,907 · +3.4%
- By 2040
- 2,523,137 · +9.7%
- By 2050
- 2,642,388 · +14.9%
- By 2075
- 2,880,769 · +25.2%
- By 2100
- 2,909,436 · +26.5%
Race, ethnicity, and origin ACS 2023
- Neighborhood character
- Predominantly Hispanic (69%)
- Race & ethnicity
- Hispanic / Latino 69% Two or more races 34% Black 15% White 9% Asian 2% Native American 1%
- Hispanic origin (detail)
- Mexican 58%
- Foreign-born
- 18% · Canada
- Languages at home
- 52% English-only · Spanish 46%
Political lean MEDSL · San Bernardino
- 2024 margin
- Toss-up / Even · D 47.5% · R 49.7% · Other 2.8%
- 2008→2024 swing
- -8.5pp toward R · 2008: 6.3pp · 2024: -2.1pp
- All cycles
- 2024: R+2.1 2020: D+10.7 2016: D+9.8 2012: D+5.4 2008: D+6.3
Not yet ingested
- Civics
- —
Market trends
- HPI YoY
- ▲ 41.09%
- Current HPI
- 453.6071
- Rent YoY
- ▲ 4.68%
- Metro
- Riverside-San Bernardino-Ontario, CA
- State GDP YoY
- ▲ 3.21%
- F500 in state
- 116
Industry mix (Fortune 500 HQ in CA)
| Industry | F500 HQs | Revenue |
|---|---|---|
| Technology | 27 | $1,492B |
|
||
| Financial Services | 3 | $174B |
|
||
| Retail | 3 | $44B |
|
||
| Insurance | 3 | $26B |
|
||
| Media / Entertainment | 2 | $115B |
|
||
| Pharmaceuticals / Biotech | 2 | $62B |
|
||
Price history
+788.7% since first listed53 events — show timeline
- 2026-05-27 Listed $439,900 CRMLS
- 2026-03-20 Listing Removed — CRMLS
- 2026-03-15 Relisted — CRMLS
- 2026-02-11 Contingent — CRMLS
- 2026-01-18 Relisted — CRMLS
- 2026-01-08 Contingent — CRMLS
- 2025-12-22 Listing Removed — CRMLS
- 2025-12-21 Relisted — CRMLS
- 2025-12-20 Relisted — CRMLS
- 2025-12-20 Listed $475,000 CRMLS
- 2025-12-19 Listed $475,000 CRMLS
- 2025-12-19 Coming Soon — CRMLS
- 2025-10-02 Listing Removed — CRMLS
- 2025-04-30 Listed $569,000 CRMLS
- 2025-04-08 Listing Removed — CRMLS
- 2025-01-24 Price Changed $599,990 CRMLS
- 2024-10-11 Listed $649,990 CRMLS
- 2023-04-28 Sold (MLS) $441,000 CRMLS
- 2023-04-27 Sold (Public Records) $442,000 Public Records
- 2023-03-16 Contingent — CRMLS
- 2022-08-27 Listed $449,900 CRMLS
- 2021-11-25 Listing Removed — CRMLS
- 2020-08-06 Listing Removed — CRMLS
- 2020-04-23 Listing Removed — CRMLS
- 2020-04-06 Listed $346,000 CRMLS
- 2020-01-23 Listed $346,000 CRMLS
- 2020-01-06 Listing Removed — CRMLS
- 2019-09-06 Listed $349,000 CRMLS
- 2019-07-22 Listing Removed — CRMLS
- 2019-07-22 Listing Removed — SDMLS
- 2019-06-11 Listed $360,000 SDMLS
- 2019-06-11 Listed $360,000 CRMLS
- 2018-10-30 Listing Removed — SDMLS
- 2014-02-28 Sold (Public Records) $125,000 Public Records
- 2014-02-28 Sold (MLS) $125,000 CRMLS
- 2014-01-16 Pending — CRMLS
- 2013-12-31 Listing Removed — SDMLS
- 2013-12-31 Listing Removed — CRMLS
- 2013-09-16 Relisted — CRMLS
- 2013-09-16 Listed $125,000 SDMLS
- 2013-09-16 Listed $125,000 CRMLS
- 2013-08-14 Pending — CRMLS
- 2013-08-11 Relisted — CRMLS
- 2013-07-11 Delisted — CRMLS
- 2013-07-11 Price Changed $125,000 CRMLS
- 2013-06-29 Listed $99,000 CRMLS
- 2013-04-13 Listed $99,900 SDMLS
- 2013-04-13 Listed $99,900 CRMLS
- 2007-12-14 Sold (Public Records) $310,000 Public Records
- 2007-09-10 Listing Removed — CRMLS
- 2007-03-09 Listed $319,990 CRMLS
- 1990-09-14 Sold (Public Records) $104,681 Public Records
- 1982-04-19 Sold (Public Records) $49,500 Public Records
Property tax history
+2.7%/yrLatest (2025): $5,497 · +7.0% YoY. Source: county tax records.
Cash-flow waterfall
monthlySold comps — $/sqft
last 12 mo · ≤1 miLoading sold comps…