 5-Plex
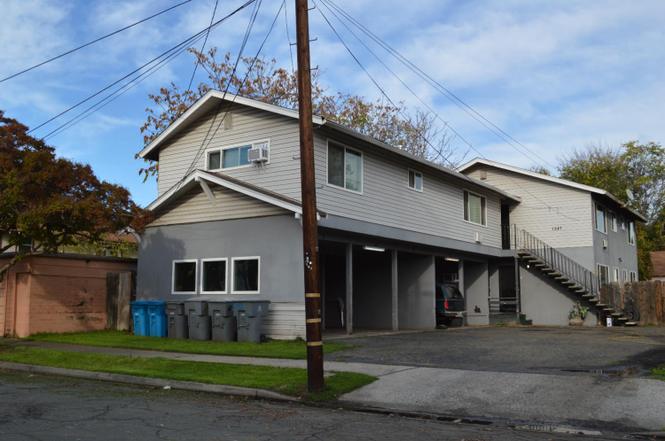
1547 2nd Ave · Oroville, CA
Flood risk 1/10 · Minimal
- FEMA flood zone
- X (unshaded)
- Chance of flooding over 30 yrs
- 0.0%
- Est. flood insurance / yr
- $507 – $1,088
Fire risk 8/10 · Major
- Est. fire insurance / yr
- $659 – $1,223
Heat risk 8/10 · Major
- Hot days now (above 105°F)
- 7 days/yr
- Hot days in 30 yrs
- 16 days/yr
Wind risk 1/10 · Minimal
- Chance of severe wind over 30 yrs
- —
Air-quality risk 10/10 · Severe
- Unhealthy air days now
- 34 days/yr
- Unhealthy air days in 30 yrs
- 39 days/yr
Risk factors via First Street. Map © Google.
Why this score? — see what drove the B- grade
The composite is a weighted blend of 9 inputs, each scored 0–100. Each bar is that input's sub-score; the figure is the points it added to the 100-point composite (weight × sub-score).
- Cash flow +30.0/30.0
- DSCR +10.0/10.0
- 1% rule +8.6/10.0
- ARV discount +7.5/15.0
- Rent growth +3.0/5.0
- Schools +2.8/10.0
- Livability +2.5/5.0
- Condition / age +2.5/5.0
- Appreciation +0.0/10.0
$425,000
🖨 Deal sheet (PDF) 📄 Offer letter ✓ Due diligence
Multi-family units
County records classify this as Multi-Family (5+ Unit). Listing-text estimate: 5 units. confirmed
5+ unit building — per-unit beds/baths from public records are typically unavailable; the breakdown below (if shown) is an estimate from the listing text.
Listing remarks MLS
alue add opportunity RENTS ARE 20% BELOW MARKET! This 5 unit residential apartment complex is comprised of four 1 bedroom/ 1 bathroom units and one 2 bedroom/1 bathroom unit.. Currently, three 1/1 units rent for $500/month and the 4th 1/1 rents for $550/month. The 2/1 is renting at $550. Market rents are $560/unit for the 1/1 units and $600 for the 2/1 units, increasing potential income to $2,840/month. Owners pay water, sewer, garbage and yard maintenance. Great opportunity for investor or small exchange
Key facts
- Renovated in 2019
- Own meter for gas
- New appliances
Tags
Property features AI
Finance
- Financial info: Property type: residential income with 5 or more units; Total of 5 units (4 one-bedroom units and 1 two-bedroom unit)
- HOA & community: No homeowners association
Exterior
- Parking: Five off-street parking spaces; Carport and covered parking
- Utilities: City utilities available; Natural gas connected; Public sewer; Public water with meter-paid water
- Home design: Multi-unit residential income property; Garden apartments; Two-story building; Built in 1959; Addressed as 1547 2nd Ave, Oroville, CA
- Construction: Originally constructed in 1959
- Exterior features: Sidewalks on the lot
Interior
- Kitchen: Free-standing gas oven; Free-standing gas range; Free-standing refrigerator
- Bedrooms: Four 1-bedroom units; One 2-bedroom unit
- Flooring: Wood flooring; Linoleum flooring
- Bathrooms: Four units with one full bathroom each (1-bed units); One unit with one full bathroom (2-bed unit)
- Heating & cooling: Wall furnace heating; Ceiling fans; Window air-conditioning units
- Interior features: Garden-apartment style residential income property; Shared laundry in common area; Ceiling fans and window cooling units; Wall furnace heating
- Laundry & utility: Laundry in a common area; Separate electric and gas meters
Neighborhood map
What this means for you Summary
Snapshot
- This is a 4×1bd/1.0ba + 1×2bd/1.0ba units multifamily listed at $425k.
Deal economics
- At list price, monthly cash flow is $2k ($20k/yr) — positive. Per door: $328/mo.
- The deal already cash-flows at list — no discount required.
- Meets the 1% rule at list price ($6k rent vs $425k).
- Recommended offer: $400k (6.0% below list) — sets the bar for market timing.
- Cap rate 10.9% vs local median 4.6% in Oroville — top-decile yield for the area; either an underpriced asset or a hidden risk that comps aren't pricing in. Stress-test before assuming the spread holds.
Location & tenants
- Location reads 50/100 on livability (#1,136 in CA) — a working-class tenant base; expect higher turnover. Watch: schools D, cost of living D, crime F.
- Oroville Union High (town): math 19% / reading 49% proficiency, ranked #300 of 517 in CA (top 58%) — families likely to look elsewhere, expect single-tenant / working-renter base with shorter leases.
- Market conditions: Rents rising (+1.9%/yr); 167 active listings in the ZIP; 946 units permitted in Butte County in 2024 (254 in 5+ unit buildings).
- At $5,785/mo this rent would consume 130% of the median local household income ($53k/yr) (locally 892% of renters already pay >50% of income on rent) — very limited rent-growth headroom before tenants either downsize or default.
Forward outlook
- Local home prices are declining (-3.0%/yr); year-one equity from $3k of loan paydown is wiped out by about $13k of value loss. Plan a longer hold.
- Butte County population projected at +10% by 2050 — modest demand growth; plan on rents tracking national, not racing it.
- At projected returns (-3.0% appreciation + 1.9% rent growth), your $119k cash investment doubles in ~8 years — after that, you're playing with house money.
Negotiation context
- It's been on market 77 days — a 6% lower offer ($400k) is reasonable based on typical stale-listing flexibility.
- 5 sale attempts since 8y ago; this cycle's ask has dropped $150k (26%) from the opening price — seller is motivated, your offer sets the floor, not the list.
- Current owner paid $285k; 49% above their basis — modest negotiation headroom, anchor on the comps not their cost.
Risks & watch-outs
- Watch-outs: built in 1959 — expect roof / HVAC / electrical / plumbing capex.
- Climate carrying-cost: severe wildfire risk; extreme-heat days projected 7→16/yr by 2055 (HVAC capex compounding) — expect insurance premiums to compound above CPI over the hold.
Questions for the listing agent
- It's been on market 77 days. Have you received any prior offers? Is the seller open to a 6% concession, seller financing, or rate buy-down credit?
- Can we see the unit-by-unit rent roll, current vacancy, and any below-market leases? What's the average tenancy length?
- What capital expenditures (roof, boiler, parking lot, exteriors) have been made in the last 5 years, and what's planned in the next 2?
- Built in 1959 — when were the roof, HVAC, electrical panel, plumbing, and water heater last replaced?
- Why hasn't it sold? Are there any deal-killer items the seller is aware of (foundation, flood, title, zoning, code violations)?
- Is there a deadline driving the sale (1031 exchange, divorce, estate, relocation)? That informs how much negotiation room exists.
- Schools are D-rated, which usually means shorter tenancies and higher turnover. Who's the typical renter profile here, and what's been the actual vacancy rate?
- Crime grade is F in this area — have there been break-ins, vandalism, or insurance claims at this property in the last 3 years? What carrier currently insures it and at what premium?
- What's the average days-on-market for RENTAL listings here right now (not sales)? A rising rental-DOM trend means longer vacancies and softer asking-rent achievability than the comps imply.
- What's the recent tenant-quality profile in this submarket — average credit score on applications, eviction rate, late-payment / NSF rate, and stable-employment percentage? A property-management company in the area should have these aggregated.
- How much new apartment / multifamily construction is in the pipeline within 1–3 miles? Heavy new supply (>2% of stock underway) typically softens rents 12–24 months out; light construction supports rent growth.
Investment metrics
- 1% rule
- 1.36% ✓
- Cap rate
- 10.92%
- Cash-on-cash
- 16.52%
- DSCR
- 1.73
- GRM
- 6.1
CMA / ARV
No comps found within radius.
Projected returns pro-forma
-3.0% appreciation · 1.88% rent growth · sell at horizon
- IRR
- 6.4%
- Equity multiple
- 1.24×
- Total profit
- $29,093
- Equity at exit
- $63,369
- IRR
- 14.7%
- Equity multiple
- 2.13×
- Total profit
- $134,145
- Equity at exit
- $36,746
Cash invested: $119,000 (down + closing). Projections, not guarantees.
Landlord ↔ Tenant lean methodology
- Overall (STATE)
- 18 Strongly Tenant-Friendly
- State California
- 18 Strongly Tenant-Friendly · D+13
- County
- — inherits STATE
- City
- — inherits STATE
ZIP-level market 95965
- Home prices YoY
- -31.6%
- Rents YoY
- 1.9%
- Active inventory
- 167
- Price-to-rent
- 31.0×
Monthly cashflow live
- Estimated rent
- $5,785 high interval (Pro) →
- Mortgage (P&I)
- −$2,229
- Tax from tax record
- −$526 /mo · $6,316/yr
- Insurance
- −$177
- HOA
- −$0
- Vacancy / Maint / Mgmt
- −$1,215
- Net cashflow
- $1,638
Break-even live
Sensitivity live
| Price | -10% $1,879 | -5% $1,758 | +0% $1,638 | +5% $1,518 | +10% $1,397 |
|---|---|---|---|---|---|
| Rent | -10% $1,181 | -5% $1,409 | +0% $1,638 | +5% $1,867 | +10% $2,095 |
| Rate | -1.0pp $1,852 | -0.5pp $1,746 | base $1,638 | +0.5pp $1,528 | +1.0pp $1,416 |
5-unit breakdown (identical units grouped — click to expand)
| Units | Beds | Baths | Est. rent |
|---|---|---|---|
| 4× units | 1 | 1 | $4,576 |
| #1 | 1 | 1 | $1,144 |
| #2 | 1 | 1 | $1,144 |
| #3 | 1 | 1 | $1,144 |
| #4 | 1 | 1 | $1,144 |
| 1× unit | 2 | 1 | $1,210 |
| Total (5 units) | $5,785 | ||
UW: 25.0% down · 7.5% · 30yr · 1.5% tax · 5.0% vac · 8.0% maint · 8.0% mgmt
Financing live
Cash to close
- Down payment
- $106,250
- Closing costs
- $12,750
- Reserves months
- —
- Total cash needed
- —
Loan-product check · same deal, 3 products live
Conventional
25% down · 7.5% · 30yr
- Down + closing
- —
- Monthly P&I
- —
- Monthly cashflow
- —
- DSCR
- —
- Eligible?
- —
Personal DTI + credit; lowest rate.
DSCR
20% down · 8.5% · 30yr
- Down + closing
- —
- Monthly P&I
- —
- Monthly cashflow
- —
- DSCR
- —
- Eligible?
- —
No personal income docs; deal must DSCR.
Hard money
10% down · 12.0% · 12mo
- Down + closing
- —
- Monthly P&I
- —
- Monthly cashflow
- —
- DSCR
- —
- Eligible?
- —
Short-term bridge; refi at stabilization.
Listing history 23 events
-
2026-06-07statusdays on market $425,000 Pending 77 DOM
-
2026-06-02days on market $425,000 Active 75 DOM
-
2026-06-01days on market $425,000 Active 74 DOM
-
2026-05-31days on market $425,000 Active 73 DOM
-
2026-05-30days on market $425,000 Active 72 DOM
-
2024-09-30historical
-
2024-08-08price $565,000
-
2024-07-04$575,000 Active
-
2023-11-10historical $860
-
2023-10-20$860
-
2018-08-31soldstatus $285,000 510-char remark
Show marketing remark (510 chars)
alue add opportunity RENTS ARE 20% BELOW MARKET! This 5 unit residential apartment complex is comprised of four 1 bedroom/ 1 bathroom units and one 2 bedroom/1 bathroom unit.. Currently, three 1/1 units rent for $500/month and the 4th 1/1 rents for $550/month. The 2/1 is renting at $550. Market rents are $560/unit for the 1/1 units and $600 for the 2/1 units, increasing potential income to $2,840/month. Owners pay water, sewer, garbage and yard maintenance. Great opportunity for investor or small exchange
-
2018-08-31soldstatus $285,000 Closed Sale
Show marketing remark (510 chars)
alue add opportunity RENTS ARE 20% BELOW MARKET! This 5 unit residential apartment complex is comprised of four 1 bedroom/ 1 bathroom units and one 2 bedroom/1 bathroom unit.. Currently, three 1/1 units rent for $500/month and the 4th 1/1 rents for $550/month. The 2/1 is renting at $550. Market rents are $560/unit for the 1/1 units and $600 for the 2/1 units, increasing potential income to $2,840/month. Owners pay water, sewer, garbage and yard maintenance. Great opportunity for investor or small exchange
-
2018-08-31soldstatus $285,000
Show marketing remark (510 chars)
alue add opportunity RENTS ARE 20% BELOW MARKET! This 5 unit residential apartment complex is comprised of four 1 bedroom/ 1 bathroom units and one 2 bedroom/1 bathroom unit.. Currently, three 1/1 units rent for $500/month and the 4th 1/1 rents for $550/month. The 2/1 is renting at $550. Market rents are $560/unit for the 1/1 units and $600 for the 2/1 units, increasing potential income to $2,840/month. Owners pay water, sewer, garbage and yard maintenance. Great opportunity for investor or small exchange
-
2018-08-23status Pending Sale
-
2018-07-24price $299,000
-
2018-06-22price $309,000
-
2018-05-29status Active
-
2018-05-16status Pending Sale
-
2018-04-25$299,000 510-char remark
Show marketing remark (510 chars)
alue add opportunity RENTS ARE 20% BELOW MARKET! This 5 unit residential apartment complex is comprised of four 1 bedroom/ 1 bathroom units and one 2 bedroom/1 bathroom unit.. Currently, three 1/1 units rent for $500/month and the 4th 1/1 rents for $550/month. The 2/1 is renting at $550. Market rents are $560/unit for the 1/1 units and $600 for the 2/1 units, increasing potential income to $2,840/month. Owners pay water, sewer, garbage and yard maintenance. Great opportunity for investor or small exchange
-
2018-04-25$335,000 Active
Show marketing remark (510 chars)
alue add opportunity RENTS ARE 20% BELOW MARKET! This 5 unit residential apartment complex is comprised of four 1 bedroom/ 1 bathroom units and one 2 bedroom/1 bathroom unit.. Currently, three 1/1 units rent for $500/month and the 4th 1/1 rents for $550/month. The 2/1 is renting at $550. Market rents are $560/unit for the 1/1 units and $600 for the 2/1 units, increasing potential income to $2,840/month. Owners pay water, sewer, garbage and yard maintenance. Great opportunity for investor or small exchange
-
2018-04-19soldstatus $215,000
-
2005-04-18soldstatus $150,000
-
2002-07-22soldstatus $150,000
ⓘ Source: listings_history table (triggers on properties + properties_extension) + one-shot
backfill from property_details.listing_events for pre-trigger history.
Tax reassessment forecast CA · Resets to sale price
- Current annual tax
- $6,316 · $526/mo
- Projected year-2 tax
- $6,316 · $526/mo
- Expected delta
- $0/yr ($0/mo · 0.0%)
ⓘ Screening estimate from a state-policy table — verify with the county assessor before closing.
Climate risk First Street
- Flood 1/10 Low FEMA zone X (unshaded) · 0% chance over 30 yrs
- Wildfire 8/10 Severe
- Heat 8/10 Severe 7 d/yr ≥105°F today · 16 d/yr by 30 yrs out
- Wind 1/10 Low
- Air quality 10/10 Extreme 34 unhealthy d/yr today · 39 by 30 yrs out
Nearby sold comps map
Loading sold comps map…
Walkable amenities ~0.75 mi
Loading nearby amenities…
Taxation est. · year 1
- Rental income
- $69,420
- − Mortgage interest
- −$23,807
- − Property taxes
- −$6,316
- − Insurance
- −$2,125
- − Repairs & maintenance
- −$5,554
- − Management
- −$5,554
- − Depreciation
- −$12,364
- Taxable income
- $13,702
- Est. tax owed @ 24.0%
- −$3,288
- After-tax cash flow
- $16,368/yr
For passive investors: Depreciation is non-cash, so a rental often shows a tax loss while cash-flowing — sheltering income. Rental losses are passive: they offset passive income freely, and up to $25,000/yr can offset ordinary (W-2) income if you actively participate and your MAGI is under $100k (phasing out to $0 by $150k); unused losses carry forward. On sale, claimed depreciation is recaptured at up to 25%, and gains may owe capital-gains tax (a 1031 exchange can defer both). Figures are a year-1 estimate at your 24.0% rate — not tax advice; consult a CPA.
Schools (NCES district)
- District
- Oroville Union High
- NCES district ID
- 0629130
- Math proficiency
- 19% ▼ -2.00%
- Reading proficiency
- 49% ▼ -4.00%
- Median HH income
- $38,085
- Composite
- 28.26/100
- National rank
- #6794
- State rank
- #300 of 517 in CA
Livability — Oroville
- Score
- 50/100
- State rank
- #1136
- US rank
- #25715
Category grades
Schools grade is shown separately in the Schools card above.
Census & demographics
- Census place
- Oroville, CA
- County
- Butte County · 175,030 people
- Metro
- Chico, CA
- Population (ZIP)
- 21,181
- Household income
- $53,198
- Rent vs Own
- Severe rent burden
- 892.0
Population outlook (Butte County) Hauer SSP2
- Today (2025)
- 237,527 people
- By 2030
- 243,804 · +2.6%
- By 2040
- 253,899 · +6.9%
- By 2050
- 262,561 · +10.5%
- By 2075
- 283,709 · +19.4%
- By 2100
- 282,689 · +19.0%
Race, ethnicity, and origin ACS 2023
- Neighborhood character
- Diverse neighborhood (Simpson 0.68)
- Race & ethnicity
- White 50% Hispanic / Latino 20% Asian 16% Two or more races 13% Black 3% Native American 3%
- Hispanic origin (detail)
- Mexican 19%
- Common ancestry
- Lithuanian 2% Iranian 2% Russian 1%
- Foreign-born
- 12% · Canada
- Languages at home
- 75% English-only · Spanish 13% Other Asian/Pacific 10% Tagalog/Filipino 1%
Political lean MEDSL · Butte
- 2024 margin
- Toss-up / Even · D 46.8% · R 49.9% · Other 3.3%
- 2008→2024 swing
- -5.5pp toward R · 2008: 2.4pp · 2024: -3.1pp
- All cycles
- 2024: R+3.1 2020: D+1.7 2016: R+4.0 2012: R+3.9 2008: D+2.4
Not yet ingested
- Civics
- —
Market trends
- HPI YoY
- ▼ -146.76%
- Current HPI
- 317.0277
- Rent YoY
- ▲ 1.88%
- Metro
- Chico, CA
- State GDP YoY
- ▲ 3.21%
- F500 in state
- 116
Industry mix (Fortune 500 HQ in CA)
| Industry | F500 HQs | Revenue |
|---|---|---|
| Technology | 27 | $1,492B |
|
||
| Financial Services | 3 | $174B |
|
||
| Retail | 3 | $44B |
|
||
| Insurance | 3 | $26B |
|
||
| Media / Entertainment | 2 | $115B |
|
||
| Pharmaceuticals / Biotech | 2 | $62B |
|
||
Price history
+276.7% since first listed18 events — show timeline
- 2024-09-30 Listing Removed — CRMLS
- 2024-08-08 Price Changed $565,000 CRMLS
- 2024-07-04 Listed $575,000 CRMLS
- 2023-11-10 Rental Removed $860 APPFOLIO
- 2023-10-20 Listed for Rent $860 APPFOLIO
- 2018-08-31 Sold (Public Records) $285,000 Public Records
- 2018-08-31 Sold (MLS) $285,000 CRMLS
- 2018-08-31 Sold (MLS) $285,000 SDMLS
- 2018-08-23 Pending — CRMLS
- 2018-07-24 Price Changed $299,000 CRMLS
- 2018-06-22 Price Changed $309,000 CRMLS
- 2018-05-29 Relisted — CRMLS
- 2018-05-16 Pending — CRMLS
- 2018-04-25 Listed $335,000 CRMLS
- 2018-04-25 Listed $299,000 SDMLS
- 2018-04-19 Sold (Public Records) $215,000 Public Records
- 2005-04-18 Sold (Public Records) $150,000 Public Records
- 2002-07-22 Sold (Public Records) $150,000 Public Records
Property tax history
+4.9%/yrLatest (2025): $6,316 · +3.2% YoY. Source: county tax records.
Cash-flow waterfall
monthlySold comps — $/sqft
last 12 mo · ≤1 miLoading sold comps…