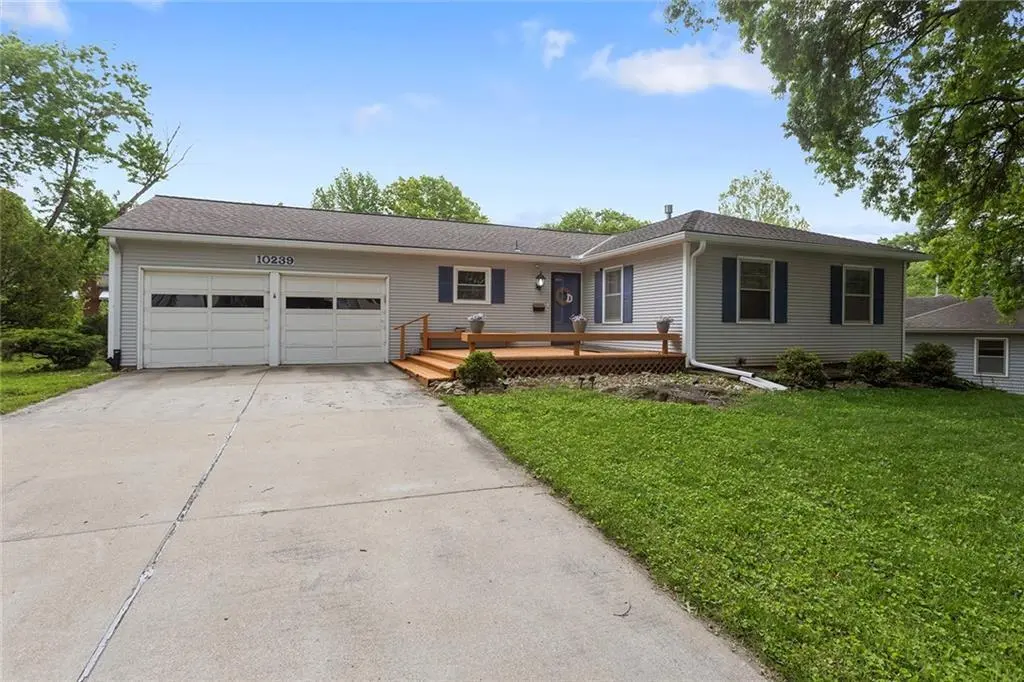
10239 Outlook Dr · Overland Park, KS
Flood risk 1/10 · Minimal
- FEMA flood zone
- X (unshaded)
- Chance of flooding over 30 yrs
- 0.0%
- Est. flood insurance / yr
- $473 – $860
Fire risk 1/10 · Minimal
- Est. fire insurance / yr
- $1,154 – $2,142
Heat risk 4/10 · Minor
- Hot days now (above 107°F)
- 7 days/yr
- Hot days in 30 yrs
- 17 days/yr
Wind risk 2/10 · Minimal
- Chance of severe wind over 30 yrs
- —
Air-quality risk 3/10 · Minor
- Unhealthy air days now
- 3 days/yr
- Unhealthy air days in 30 yrs
- 3 days/yr
Risk factors via First Street. Map © Google.
Why this score? — see what drove the D+ grade
The composite is a weighted blend of 9 inputs, each scored 0–100. Each bar is that input's sub-score; the figure is the points it added to the 100-point composite (weight × sub-score).
- ARV discount +15.0/15.0
- Cash flow +10.4/30.0
- Livability +4.0/5.0
- Schools +3.8/10.0
- Rent growth +3.7/5.0
- DSCR +3.0/10.0
- 1% rule +2.9/10.0
- Condition / age +2.5/5.0
- Appreciation +0.0/10.0
$320,000
🖨 Deal sheet 📄 Offer letter ✓ Due diligence
Listing remarks MLS
Adorable 3 bedroom ranch in Nall Hills. Hardwood floors thru most of the main level. Kitchen is open to dining and family room. Family room with fireplace walks out to deck and fenced in back yard. Laundry hookups on main level in 3rd bedroom as well as in lower level, you choose! Master bedroom has its own bath. Finished basement. Lots of storage space.
Key facts
- 9,600 sq ft lot
- 2 garage spots
- Built 1959
Property features AI
Finance
- HOA & community: Homeowners association with an annual fee of $264 covering trash
Exterior
- Parking: Attached garage with garage door opener, garage faces front; 2-car garage
- Security: Smoke detectors
- Utilities: Public water; Public sewer
- Home design: Single-family ranch residence; Lives on a single story main level with lower-level basement; Above-grade finished living area reported
- Construction: Lap siding exterior; Composition roof
- Exterior features: Deck; Metal fencing; Level lot; Not in a flood plain; Public road maintenance
Interior
- Kitchen: Ceramic tile floor in kitchen; Dishwasher; Disposal; Electric range; Country kitchen / kitchen-dining combo
- Bedrooms: 3 bedrooms (two on main level; one in lower level)
- Flooring: Carpet; Vinyl; Wood
- Bathrooms: 3 full bathrooms; Lower-level bathroom with ceramic tile and shower; Main-level bathroom with linoleum and shower-over-tub
- Heating & cooling: Forced air heating; Electric cooling
- Interior features: Ceiling fans; Stained cabinets; Thermal windows; Finished full basement with inside entrance; Family room built-ins and fireplace; Recreation room
- Laundry & utility: Laundry located in the basement
Neighborhood map
What this means for you Summary
Snapshot
- This is a 3-bed/3.0-bath single-family listed at $320k.
Deal economics
- At list price, monthly cash flow is $-169 ($-2k/yr) — negative.
- To cash-flow at today's rent, offer at most $290k (9.3% below list).
- To meet the 1% rule (rent ≥ 1% of price), the offer needs to be $252k (21.3% below list).
- Recommended offer: $252k (21.3% below list) — sets the bar for 1% rule.
- Cap rate 5.7% vs local median 3.9% in Overland Park — top-decile yield for the area; either an underpriced asset or a hidden risk that comps aren't pricing in. Stress-test before assuming the spread holds.
Location & tenants
- Location reads 80/100 on livability (#16 in KS, #1,851 nationally) — a professional / high-income tenant draw. Strengths: employment A+, housing A+, crime B; Watch: health & safety C-, commute D+.
- Shawnee Mission Pub Schools (suburban): math 38% / reading 46% proficiency, ranked #22 of 169 in KS (top 13%) — families likely to look elsewhere, expect single-tenant / working-renter base with shorter leases.
- Zoned schools: Trailwood Elem (math 65% / reading 68%, grade B+, #40 of 684 statewide, top 6%, 444 students, 12% FRL) — zoned schools average 12% FRL vs 29% district-wide (16 pts lower); this property's tenant base skews higher-income than the district average.
- Zoned-school proficiency averages 66% at this address vs 42% district-wide (+24 pts) — the actual schools serving this property are materially stronger than the Shawnee Mission Pub Schools average implies; a family-tenant draw the district grade alone would hide.
- Market conditions: Rents rising fast (+4.7%/yr); 61 active listings in the ZIP; 7 comparable units currently listed for rent nearby; rentals leasing fast (median 4d on market — plan ~1-2 weeks tenant-placement turnaround); high-income renter base; 2,969 units permitted in Johnson County in 2024 (1,066 in 5+ unit buildings).
Forward outlook
- Local home prices are declining (-3.0%/yr); year-one equity from $2k of loan paydown is wiped out by about $10k of value loss. Plan a longer hold.
- Johnson County population projected at +27% by 2050 — long-run rental-demand tailwind backs the buy-and-hold thesis.
Negotiation context
- Only 2 days on market — expect competitive offers; lowballing is unlikely to land.
- 6 sale attempts since 24y ago with the ask held roughly flat each time — persistent listings suggest the price (not the market) is what's stuck; bring a comps-based counter.
Risks & watch-outs
- Watch-outs: built in 1959 — expect roof / HVAC / electrical / plumbing capex.
Questions for the listing agent
- What do current leases actually rent for vs. the listed asking? Can we see a recent rent roll and the last 12 months of T-12 income?
- Built in 1959 — when were the roof, HVAC, electrical panel, plumbing, and water heater last replaced?
- What does the HOA fee cover, when was the last increase, and are there any pending special assessments or reserve-fund shortfalls?
- Is there a deadline driving the sale (1031 exchange, divorce, estate, relocation)? That informs how much negotiation room exists.
- Schools are B-rated — typically a magnet for longer-tenancy family renters. What's the average tenant stay here, and is there a school-zone premium baked into asking?
- The area grade is low — what's the realistic commute time and amenity access for the typical tenant pool here? Any planned neighborhood developments (good or bad) we should know about?
- What's the average days-on-market for RENTAL listings here right now (not sales)? A rising rental-DOM trend means longer vacancies and softer asking-rent achievability than the comps imply.
- What's the recent tenant-quality profile in this submarket — average credit score on applications, eviction rate, late-payment / NSF rate, and stable-employment percentage? A property-management company in the area should have these aggregated.
- How much new for-sale + rental construction is in the pipeline within 1–3 miles? Heavy new supply typically softens prices + rents 12–24 months out; constrained supply supports both.
Investment metrics
- 1% rule
- 0.79% ✗
- Cap rate
- 5.66%
- Cash-on-cash
- -2.26%
- DSCR
- 0.90
- GRM
- 10.6
CMA / ARV
- ARV (on-the-fly)
- $448,704
- Comps found
- 12
Show comp detail 12 sales within ~0.75 mi
| Address | Dist | Beds/Ba | Sqft | Sold | Price | $/sf | Match |
|---|---|---|---|---|---|---|---|
| 6000 W 101st Pl | 0.23mi | 4/2.5 (+1) | 2,001 (+2%) | 3mo | $449,000 | $224 | 77 |
| 10223 Dearborn Dr | 0.11mi | 3/2.0 | 1,822 (-7%) | 3mo | $415,000 | $228 | 76 |
| 5916 W 101 Pl | 0.22mi | 3/2.0 | 1,755 (-11%) | 2mo | $429,500 | $245 | 66 |
| 6432 W 101 St | 0.52mi | 3/2.0 | 1,888 (-4%) | 1mo | $430,000 | $228 | 64 |
| 5607 W 98th Ter | 0.57mi | 3/3.0 | 2,102 (+7%) | 1mo | $380,000 | $181 | 62 |
| 6401 W 102nd St | 0.41mi | 4/2.5 (+1) | 1,828 (-7%) | 1mo | $445,000 | $243 | 61 |
| 10300 Nall Ave | 0.14mi | 4/2.5 (+1) | 1,680 (-15%) | 2mo | $369,900 | $220 | 60 |
| 10120 Glenwood St | 0.61mi | 4/2.5 (+1) | 1,932 (-2%) | 2mo | $389,500 | $202 | 60 |
| 5428 W 102nd St | 0.18mi | 4/2.0 (+1) | 1,701 (-14%) | 3mo | $344,900 | $203 | 57 |
| 5704 W 100th Ter | 0.32mi | 3/2.0 | 1,705 (-13%) | 3mo | $450,000 | $264 | 56 |
| 5710 W 100th Ter | 0.33mi | 3/2.0 | 1,672 (-15%) | 1mo | $435,000 | $260 | 55 |
| 10128 Broadmoor St | 0.66mi | 3/2.0 | 1,738 (-12%) | 4mo | $479,000 | $276 | 43 |
Match score weights: distance 35% · size 25% · config 20% · recency 20%. Top-matched comps best support the ARV.
Projected returns pro-forma
-3.0% appreciation · 4.68% rent growth · sell at horizon
- IRR
- -18.2%
- Equity multiple
- 0.35×
- Total profit
- $-58,292
- Equity at exit
- $47,713
- IRR
- -7.6%
- Equity multiple
- 0.48×
- Total profit
- $-46,237
- Equity at exit
- $27,668
Cash invested: $89,600 (down + closing). Projections, not guarantees.
Landlord ↔ Tenant lean methodology
- Overall (STATE)
- 83 Strongly Landlord-Friendly
- State Kansas
- 83 Strongly Landlord-Friendly · R+10
- County
- — inherits STATE
- City
- — inherits STATE
ZIP-level market 66207
- Rents YoY
- 4.7%
- Active inventory
- 61
- Price-to-rent
- 10.6×
Monthly cashflow live
- Estimated rent
- $2,517 high interval (Pro) →
- Mortgage (P&I)
- −$1,678
- Tax from tax record
- −$324 /mo · $3,887/yr
- Insurance
- −$133
- HOA
- −$22
- Vacancy / Maint / Mgmt
- −$529
- Net cashflow
- $-169
Break-even live
UW: 25.0% down · 7.5% · 30yr · 1.5% tax · 5.0% vac · 8.0% maint · 8.0% mgmt
Financing live
Cash to close
- Down payment
- $80,000
- Closing costs
- $9,600
- Reserves months
- —
- Total cash needed
- —
Loan-product check · same deal, 3 products live
Conventional
25% down · 7.5% · 30yr
- Down + closing
- —
- Monthly P&I
- —
- Monthly cashflow
- —
- DSCR
- —
- Eligible?
- —
Personal DTI + credit; lowest rate.
DSCR
20% down · 8.5% · 30yr
- Down + closing
- —
- Monthly P&I
- —
- Monthly cashflow
- —
- DSCR
- —
- Eligible?
- —
No personal income docs; deal must DSCR.
Hard money
10% down · 12.0% · 12mo
- Down + closing
- —
- Monthly P&I
- —
- Monthly cashflow
- —
- DSCR
- —
- Eligible?
- —
Short-term bridge; refi at stabilization.
Rent comps 7 comps
| Address | Beds | Baths | Sqft | Rent | $/sqft | DOM | Units | Dist |
|---|---|---|---|---|---|---|---|---|
| 5020 Indian Creek Pkwy Overland Park, KS | 1.0–2.0 | 1.0–2.0 | 962 | $2,257 | $2.34 | 2d | 24 | 0.60mi |
| 9550 Ash St Overland Park, KS | 2.0 | 1.0–2.5 | 1012 | $2,192 | $2.16 | 3d | 11 | 0.82mi |
| 9514 Glenwood St Overland Park, KS | 3.0 | 2.5 | 1700 | $2,295 | $1.35 | 7d | 1 | 1.07mi |
| 9300 Outlook Dr Overland Park, KS | 3.0 | 2.0 | 1570 | $2,600 | $1.66 | 14d | 1 | 1.19mi |
| 9827 Mission Rd Leawood, KS | 4.0 | 2.5 | 1978 | $2,481 | $1.25 | 21d | 1 | 1.29mi |
| 4851 Meadowbrook Pkwy Prairie Village, KS | 3.0 | 1.0–3.0 | 1097 | $5,043 | $4.60 | 3d | 17 | 1.38mi |
| 4120 W 94th Ter Prairie Village, KS | 1.0–3.0 | 1.0–2.0 | 1345 | $2,830 | $2.10 | 2d | 17 | 1.45mi |
HOA detail
- Monthly dues
- $22 · $264/yr
Listing history 17 events
-
2026-05-16status Pending
-
2026-05-14$320,000 Active
-
2026-05-10historical $320,000
-
2016-03-03soldstatus
-
2016-03-01soldstatus Sold 357-char remark
Show marketing remark (357 chars)
Adorable 3 bedroom ranch in Nall Hills. Hardwood floors thru most of the main level. Kitchen is open to dining and family room. Family room with fireplace walks out to deck and fenced in back yard. Laundry hookups on main level in 3rd bedroom as well as in lower level, you choose! Master bedroom has its own bath. Finished basement. Lots of storage space.
-
2016-01-26status Pending 357-char remark
Show marketing remark (357 chars)
Adorable 3 bedroom ranch in Nall Hills. Hardwood floors thru most of the main level. Kitchen is open to dining and family room. Family room with fireplace walks out to deck and fenced in back yard. Laundry hookups on main level in 3rd bedroom as well as in lower level, you choose! Master bedroom has its own bath. Finished basement. Lots of storage space.
-
2016-01-16Contingent - Accepting Backup Offers 357-char remark
Show marketing remark (357 chars)
Adorable 3 bedroom ranch in Nall Hills. Hardwood floors thru most of the main level. Kitchen is open to dining and family room. Family room with fireplace walks out to deck and fenced in back yard. Laundry hookups on main level in 3rd bedroom as well as in lower level, you choose! Master bedroom has its own bath. Finished basement. Lots of storage space.
-
2015-12-28historical
-
2015-07-11$189,000
-
2009-03-31soldstatus
-
2009-03-30soldstatus
-
2009-01-22$185,000
-
2009-01-20historical
-
2008-11-19$187,500
-
2002-11-21soldstatus
-
2002-11-15soldstatus
-
2002-10-12$154,950
ⓘ Source: listings_history table (triggers on properties + properties_extension) + one-shot
backfill from property_details.listing_events for pre-trigger history.
Tax reassessment forecast KS · Resets to sale price
- Current annual tax
- $3,887 · $324/mo
- Projected year-2 tax
- $4,512 · $376/mo
- Expected delta
- +$625/yr (+$52/mo · 16.1%)
ⓘ Screening estimate from a state-policy table — verify with the county assessor before closing.
Climate risk First Street
- Flood 1/10 Low FEMA zone X (unshaded) · 0% chance over 30 yrs
- Wildfire 1/10 Low
- Heat 4/10 Moderate 7 d/yr ≥107°F today · 17 d/yr by 30 yrs out
- Wind 2/10 Low
- Air quality 3/10 Moderate 3 unhealthy d/yr today · 3 by 30 yrs out
Nearby sold comps map
Loading sold comps map…
Walkable amenities ~0.75 mi
Loading nearby amenities…
Taxation est. · year 1
- Rental income
- $30,202
- − Mortgage interest
- −$17,925
- − Property taxes
- −$3,887
- − Insurance
- −$1,600
- − Repairs & maintenance
- −$2,416
- − Management
- −$2,416
- − HOA
- −$264
- − Depreciation
- −$9,309
- Taxable loss
- −$7,615
- Est. tax savings @ 24.0%
- +$1,828
- After-tax cash flow
- $-201/yr
For passive investors: Depreciation is non-cash, so a rental often shows a tax loss while cash-flowing — sheltering income. Rental losses are passive: they offset passive income freely, and up to $25,000/yr can offset ordinary (W-2) income if you actively participate and your MAGI is under $100k (phasing out to $0 by $150k); unused losses carry forward. On sale, claimed depreciation is recaptured at up to 25%, and gains may owe capital-gains tax (a 1031 exchange can defer both). Figures are a year-1 estimate at your 24.0% rate — not tax advice; consult a CPA.
Schools (NCES district)
- District
- Shawnee Mission Pub Schools
- NCES district ID
- 2011640
- Math proficiency
- 38% ▼ -6.00%
- Reading proficiency
- 46% ▼ -2.00%
- Median HH income
- $64,923
- Composite
- 37.55/100
- National rank
- #4391
- State rank
- #22 of 169 in KS
Livability — Overland Park
- Score
- 80/100
- State rank
- #16
- US rank
- #1851
Category grades
Schools grade is shown separately in the Schools card above.
Census & demographics
- Census place
- Overland Park, KS
- County
- Johnson County · 574,662 people
- City population
- 180,138
- Metro
- Kansas City, MO-KS
- Population (ZIP)
- 15,739
- Household income
- $125,153
- Rent vs Own
- Severe rent burden
- 305.0
Population outlook (Johnson County) Hauer SSP2
- Today (2025)
- 663,396 people
- By 2030
- 702,585 · +5.9%
- By 2040
- 775,386 · +16.9%
- By 2050
- 841,772 · +26.9%
- By 2075
- 994,137 · +49.9%
- By 2100
- 1,073,036 · +61.7%
Race, ethnicity, and origin ACS 2023
- Neighborhood character
- Predominantly White (91%)
- Race & ethnicity
- White 91% Hispanic / Latino 6% Two or more races 5%
- Hispanic origin (detail)
- Mexican 2% Cuban 1%
- Common ancestry
- Italian 4% Slovak 3% Lithuanian 3%
- Foreign-born
- 3% · Canada, China
- Languages at home
- 97% English-only · Spanish 2% Chinese 1%
Political lean MEDSL · Johnson
- 2024 margin
- Lean D (+8.5) · D 53.4% · R 44.9% · Other 1.8%
- 2008→2024 swing
- +17.5pp toward D · 2008: -9.0pp · 2024: 8.5pp
- All cycles
- 2024: D+8.5 2020: D+8.2 2016: R+2.7 2012: R+17.8 2008: R+9.0
Not yet ingested
- Civics
- —
Market trends
- HPI YoY
- ▼ -286.42%
- Current HPI
- 274.6822
- Rent YoY
- ▲ 4.68%
- Metro
- Kansas City, MO-KS
- State GDP YoY
- —
- F500 in state
- 0
Price history
+106.5% since first listed17 events — show timeline
- 2026-05-16 Pending — Heartland MLS as Distributed by MLS Grid
- 2026-05-14 Listed $320,000 Heartland MLS as Distributed by MLS Grid
- 2026-05-10 Coming Soon $320,000 Heartland MLS as Distributed by MLS Grid
- 2016-03-03 Sold (Public Records) — Public Records
- 2016-03-01 Sold (MLS) — Heartland MLS as Distributed by MLS Grid
- 2016-01-26 Pending — Heartland MLS as Distributed by MLS Grid
- 2016-01-16 Listed — Heartland MLS as Distributed by MLS Grid
- 2015-12-28 Listing Removed — Heartland MLS as Distributed by MLS Grid
- 2015-07-11 Listed $189,000 Heartland MLS as Distributed by MLS Grid
- 2009-03-31 Sold (MLS) — Heartland MLS as Distributed by MLS Grid
- 2009-03-30 Sold (Public Records) — Public Records
- 2009-01-22 Listed $185,000 Heartland MLS as Distributed by MLS Grid
- 2009-01-20 Listing Removed — Heartland MLS as Distributed by MLS Grid
- 2008-11-19 Listed $187,500 Heartland MLS as Distributed by MLS Grid
- 2002-11-21 Sold (Public Records) — Public Records
- 2002-11-15 Sold (MLS) — Heartland MLS as Distributed by MLS Grid
- 2002-10-12 Listed $154,950 Heartland MLS as Distributed by MLS Grid
Property tax history
+5.2%/yrLatest (2025): $3,887 · +11.0% YoY. Source: county tax records.
Cash-flow waterfall
monthlySold comps — $/sqft
last 12 mo · ≤1 miLoading sold comps…