5007 Carlos Rd · Catawba, NC
Flood risk 1/10 · Minimal
- FEMA flood zone
- X (unshaded)
- Chance of flooding over 30 yrs
- 0.0%
- Est. flood insurance / yr
- $507 – $1,088
Fire risk 3/10 · Minor
- Est. fire insurance / yr
- $906 – $1,684
Heat risk 5/10 · Moderate
- Hot days now (above 103°F)
- 7 days/yr
- Hot days in 30 yrs
- 18 days/yr
Wind risk 2/10 · Minimal
- Chance of severe wind over 30 yrs
- 4.0%
Air-quality risk 2/10 · Minimal
- Unhealthy air days now
- 2 days/yr
- Unhealthy air days in 30 yrs
- 2 days/yr
Risk factors via First Street. Map © Google.
Why this score? — see what drove the D- grade
The composite is a weighted blend of 9 inputs, each scored 0–100. Each bar is that input's sub-score; the figure is the points it added to the 100-point composite (weight × sub-score).
- Cash flow +12.8/30.0
- ARV discount +7.5/15.0
- Schools +4.5/10.0
- DSCR +3.8/10.0
- Livability +3.1/5.0
- Rent growth +2.5/5.0
- Condition / age +2.5/5.0
- 1% rule +2.4/10.0
- Appreciation +0.0/10.0
$299,000
🖨 Deal sheet 📄 Offer letter ✓ Due diligence
Listing remarks
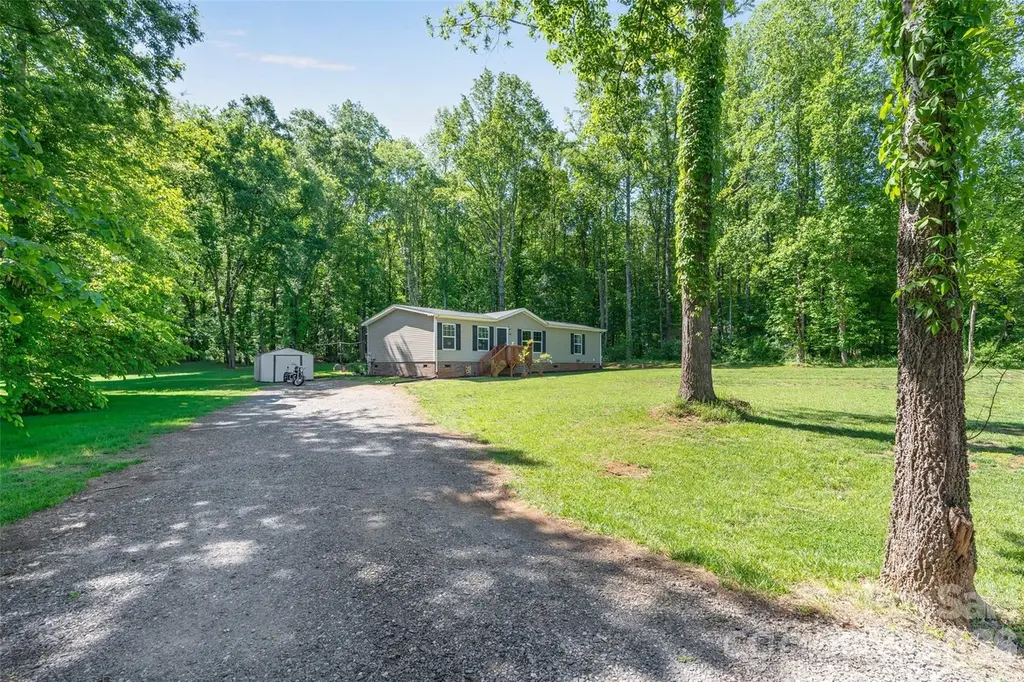
Welcome home to this wonderfully well-kept 2021 home that still feels like new just minutes from downtown Catawba. Tucked away in a private setting on a large lot, you are sure to get that "away from it all feeling". The interior boasts modern white and grey finishes; large rooms and each bedroom is equipped with a walk-in closet. The open floor plan allows for easy entertaining with the living room blending seamlessly into the kitchen and dining area. The house lives and feels cozy. Right off from the kitchen exiting outback, is a laundry room for dropping muddy shoes, or umbrellas on a rainy day. You will fall in love with the back screened in porch, showing off all of its capab
Key facts
- 0.73 acre lot
- Built 2021
- Listed 41 days
Property features AI
Finance
- Other: Zoned R-40; No restrictions
- HOA & community: No HOA
Exterior
- Parking: Driveway parking; Approximately 5 open parking spaces
- Security: Smoke detectors; Carbon monoxide detectors
- Utilities: Well water; Septic system
- Home design: Single-family manufactured doublewide; One story; Crawl space foundation; Residential property
- Construction: Manufactured construction; Vinyl exterior
- Exterior features: Covered front porch; Rear porch; Screened porch; Shed(s); Cleared and wooded lot; Gravel and paved road access (publicly maintained)
Interior
- Kitchen: Dishwasher; Electric oven; Electric range
- Bedrooms: 3 bedrooms on the main level
- Flooring: Vinyl flooring
- Bathrooms: 2 full bathrooms on the main level
- Heating & cooling: Central heating; Electric heating; Heat pump; Central air conditioning; Ceiling fans; ENERGY STAR qualified equipment
- Interior features: Insulated windows; ENERGY STAR qualified dishwasher and refrigerator
- Laundry & utility: Laundry room with washer and electric dryer hookups; Electric water heater
Neighborhood map
What this means for you Summary
Snapshot
- This is a 3-bed/2.0-bath other listed at $299k.
Deal economics
- At list price, monthly cash flow is $-27 ($-319/yr) — negative.
- To cash-flow at today's rent, offer at most $294k (1.6% below list).
- To meet the 1% rule (rent ≥ 1% of price), the offer needs to be $220k (26.4% below list).
- Recommended offer: $220k (26.4% below list) — sets the bar for 1% rule.
- Cap rate 6.2% vs local median 3.9% in Catawba — top-decile yield for the area; either an underpriced asset or a hidden risk that comps aren't pricing in. Stress-test before assuming the spread holds.
Location & tenants
- Location reads 61/100 on livability (#494 in NC) — a middle-class / working-renter tenant base. Strengths: cost of living A+, housing A-, health & safety B; Watch: crime F, amenities F, commute F.
- Catawba County Schools (rural): math 54% / reading 51% proficiency, ranked #54 of 178 in NC (top 30%) — acceptable for families but not a draw, mixed tenant base, ~2y average lease.
- Zoned schools: Oxford Elementary (math 42% / reading 36%, grade F, #746 of 1,410 statewide, top 53%, 588 students, 69% FRL); Bunker Hill High (math 52% / reading 61%, grade C, #261 of 535 statewide, top 49%, 828 students, 56% FRL) — zoned schools average 63% FRL vs 43% district-wide (20 pts higher); higher-poverty schools than district average — tighter screening recommended.
- Market conditions: 92 active listings in the ZIP; 1 comparable units currently listed for rent nearby; 2,016 units permitted in Catawba County in 2024 (255 in 5+ unit buildings).
Forward outlook
- Local home prices are declining (-3.0%/yr); year-one equity from $2k of loan paydown is wiped out by about $9k of value loss. Plan a longer hold.
- Catawba County population projected to shrink 7% by 2050 — rents likely to lag national; underwrite the cash flow, not the appreciation.
Negotiation context
- It's been on market 42 days — a 3% lower offer ($290k) is reasonable based on typical stale-listing flexibility.
- Current owner paid $16k; list at $299k implies a 1829% gain — meaningful room to come down on a strong offer.
Risks & watch-outs
- Climate carrying-cost: extreme-heat days projected 7→18/yr by 2055 (HVAC capex compounding) — expect insurance premiums to compound above CPI over the hold.
Questions for the listing agent
- What do current leases actually rent for vs. the listed asking? Can we see a recent rent roll and the last 12 months of T-12 income?
- It's been on market 42 days. Have you received any prior offers? Is the seller open to a 26% concession, seller financing, or rate buy-down credit?
- Is there a deadline driving the sale (1031 exchange, divorce, estate, relocation)? That informs how much negotiation room exists.
- Crime grade is F in this area — have there been break-ins, vandalism, or insurance claims at this property in the last 3 years? What carrier currently insures it and at what premium?
- The area grade is low — what's the realistic commute time and amenity access for the typical tenant pool here? Any planned neighborhood developments (good or bad) we should know about?
- What's the average days-on-market for RENTAL listings here right now (not sales)? A rising rental-DOM trend means longer vacancies and softer asking-rent achievability than the comps imply.
- What's the recent tenant-quality profile in this submarket — average credit score on applications, eviction rate, late-payment / NSF rate, and stable-employment percentage? A property-management company in the area should have these aggregated.
- How much new for-sale + rental construction is in the pipeline within 1–3 miles? Heavy new supply typically softens prices + rents 12–24 months out; constrained supply supports both.
Investment metrics
- 1% rule
- 0.74% ✗
- Cap rate
- 6.19%
- Cash-on-cash
- -0.38%
- DSCR
- 0.98
- GRM
- 11.3
CMA / ARV
No comps found within radius.
Projected returns pro-forma
-3.0% appreciation · 3.0% rent growth · sell at horizon
- IRR
- -17.0%
- Equity multiple
- 0.40×
- Total profit
- $-50,295
- Equity at exit
- $44,582
- IRR
- -9.0%
- Equity multiple
- 0.44×
- Total profit
- $-46,593
- Equity at exit
- $25,852
Cash invested: $83,720 (down + closing). Projections, not guarantees.
Landlord ↔ Tenant lean methodology
- Overall (STATE)
- 85 Strongly Landlord-Friendly
- State North Carolina
- 85 Strongly Landlord-Friendly · R+3
- County
- — inherits STATE
- City
- — inherits STATE
ZIP-level market 28609
- Home prices YoY
- -9.6%
- Active inventory
- 92
- Price-to-rent
- 11.3×
Monthly cashflow live
- Estimated rent
- $2,200 medium interval (Pro) →
- Mortgage (P&I)
- −$1,568
- Tax from tax record
- −$72 /mo · $864/yr
- Insurance
- −$125
- HOA
- −$0
- Vacancy / Maint / Mgmt
- −$462
- Net cashflow
- $-27
Break-even live
UW: 25.0% down · 7.5% · 30yr · 1.5% tax · 5.0% vac · 8.0% maint · 8.0% mgmt
Financing live
Cash to close
- Down payment
- $74,750
- Closing costs
- $8,970
- Reserves months
- —
- Total cash needed
- —
Loan-product check · same deal, 3 products live
Conventional
25% down · 7.5% · 30yr
- Down + closing
- —
- Monthly P&I
- —
- Monthly cashflow
- —
- DSCR
- —
- Eligible?
- —
Personal DTI + credit; lowest rate.
DSCR
20% down · 8.5% · 30yr
- Down + closing
- —
- Monthly P&I
- —
- Monthly cashflow
- —
- DSCR
- —
- Eligible?
- —
No personal income docs; deal must DSCR.
Hard money
10% down · 12.0% · 12mo
- Down + closing
- —
- Monthly P&I
- —
- Monthly cashflow
- —
- DSCR
- —
- Eligible?
- —
Short-term bridge; refi at stabilization.
Rent comps 1 comps
| Address | Beds | Baths | Sqft | Rent | $/sqft | DOM | Units | Dist |
|---|---|---|---|---|---|---|---|---|
| 133 Pumice Dr Statesville, NC | 3.0 | 2.5 | 1658 | $2,200 | $1.33 | 1d | 1 | 0.96mi |
Listing history 18 events
-
2026-06-18days on market $299,000 Active 42 DOM
-
2026-06-17days on market $299,000 Active 41 DOM
-
2026-06-16days on market $299,000 Active 40 DOM
-
2026-06-15days on market $299,000 Active 39 DOM
-
2026-06-13days on market $299,000 Active 37 DOM
-
2026-06-13days on market $299,000 Active 36 DOM
-
2026-06-09days on market $299,000 Active 33 DOM
-
2026-06-08days on market $299,000 Active 32 DOM
-
2026-06-07days on market $299,000 Active 31 DOM
-
2026-06-04days on market $299,000 Active 28 DOM
-
2026-06-03days on market $299,000 Active 27 DOM
-
2026-06-02days on market $299,000 Active 26 DOM
-
2026-06-01days on market $299,000 Active 25 DOM
-
2026-05-31days on market $299,000 Active 24 DOM
-
2026-05-08$299,000 Active
-
2026-04-28historical $299,000
-
2020-09-25soldstatus $15,500
-
2020-06-12soldstatus $17,000
ⓘ Source: listings_history table (triggers on properties + properties_extension) + one-shot
backfill from property_details.listing_events for pre-trigger history.
Tax reassessment forecast NC · Resets to sale price
- Current annual tax
- $864 · $72/mo
- Projected year-2 tax
- $2,452 · $204/mo
- Expected delta
- +$1,588/yr (+$132/mo · 183.8%)
ⓘ Screening estimate from a state-policy table — verify with the county assessor before closing.
Climate risk First Street
- Flood 1/10 Low FEMA zone X (unshaded) · 0% chance over 30 yrs
- Wildfire 3/10 Moderate
- Heat 5/10 Major 7 d/yr ≥103°F today · 18 d/yr by 30 yrs out
- Wind 2/10 Low 4% chance of damaging wind over 30 yrs
- Air quality 2/10 Low 2 unhealthy d/yr today · 2 by 30 yrs out
Nearby sold comps map
Loading sold comps map…
Walkable amenities ~0.75 mi
Loading nearby amenities…
Taxation est. · year 1
- Rental income
- $26,400
- − Mortgage interest
- −$16,749
- − Property taxes
- −$864
- − Insurance
- −$1,495
- − Repairs & maintenance
- −$2,112
- − Management
- −$2,112
- − Depreciation
- −$8,698
- Taxable loss
- −$5,630
- Est. tax savings @ 24.0%
- +$1,351
- After-tax cash flow
- $1,032/yr
For passive investors: Depreciation is non-cash, so a rental often shows a tax loss while cash-flowing — sheltering income. Rental losses are passive: they offset passive income freely, and up to $25,000/yr can offset ordinary (W-2) income if you actively participate and your MAGI is under $100k (phasing out to $0 by $150k); unused losses carry forward. On sale, claimed depreciation is recaptured at up to 25%, and gains may owe capital-gains tax (a 1031 exchange can defer both). Figures are a year-1 estimate at your 24.0% rate — not tax advice; consult a CPA.
Schools (NCES district)
- District
- Catawba County Schools
- NCES district ID
- 3700690
- Math proficiency
- 54% ▲ 9.00%
- Reading proficiency
- 51% ▲ 3.00%
- Median HH income
- $48,180
- Composite
- 44.71/100
- National rank
- #2754
- State rank
- #54 of 178 in NC
Livability — Catawba
- Score
- 61/100
- State rank
- #494
- US rank
- #18075
Category grades
Schools grade is shown separately in the Schools card above.
Census & demographics
- Population (ZIP)
- 6,617
Population outlook (Catawba County) Hauer SSP2
- Today (2025)
- 156,513 people
- By 2030
- 155,267 · -0.8%
- By 2040
- 151,110 · -3.5%
- By 2050
- 145,524 · -7.0%
- By 2075
- 134,047 · -14.4%
- By 2100
- 119,424 · -23.7%
Race, ethnicity, and origin ACS 2023
- Neighborhood character
- Predominantly White (78%)
- Race & ethnicity
- White 78% Hispanic / Latino 13% Two or more races 9% Black 5%
- Hispanic origin (detail)
- Mexican 9% Puerto Rican 2%
- Common ancestry
- Serbian 2% Italian 2% Romanian 2%
- Foreign-born
- 5% · Canada
- Languages at home
- 94% English-only · Spanish 5% Other Indo-European 1%
Political lean MEDSL · Catawba
- 2024 margin
- Solid R (+38.0) · D 30.6% · R 68.6%
- 2008→2024 swing
- -13.0pp toward R · 2008: -25.0pp · 2024: -38.0pp
- All cycles
- 2024: R+38.0 2020: R+37.0 2016: R+38.0 2012: R+29.6 2008: R+25.0
Not yet ingested
- Civics
- —
Market trends
- HPI YoY
- ▼ -29.61%
- Current HPI
- 277.7327
- Rent YoY
- —
- Metro
- —
- State GDP YoY
- ▲ 3.28%
- F500 in state
- 26
Industry mix (Fortune 500 HQ in NC)
| Industry | F500 HQs | Revenue |
|---|---|---|
| Financial Services | 2 | $213B |
|
||
| Retail | 2 | $95B |
|
||
| Industrial Conglomerate | 1 | $38B |
|
||
| Metals / Steel | 1 | $35B |
|
||
| Utilities | 1 | $30B |
|
||
| Industrial Machinery | 1 | $19B |
|
||
Price history
+1658.8% since first listed4 events — show timeline
- 2026-05-08 Listed $299,000 CANOPYMLS as Distributed by MLS Grid
- 2026-04-28 Coming Soon $299,000 CANOPYMLS as Distributed by MLS Grid
- 2020-09-25 Sold (Public Records) $15,500 Public Records
- 2020-06-12 Sold (Public Records) $17,000 Public Records
Property tax history
+31.0%/yrLatest (2024): $864 · +0.0% YoY. Source: county tax records.
Cash-flow waterfall
monthlySold comps — $/sqft
last 12 mo · ≤1 miLoading sold comps…