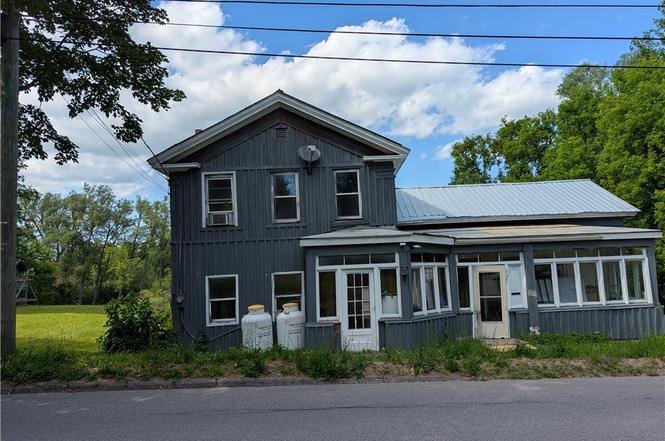
137 West St · Boonville, NY
Flood risk 1/10 · Minimal
- FEMA flood zone
- X (unshaded)
- Chance of flooding over 30 yrs
- 0.0%
- Est. flood insurance / yr
- $473 – $860
Fire risk 3/10 · Minor
- Est. fire insurance / yr
- $691 – $1,283
Heat risk 1/10 · Minimal
- Hot days now (above 89°F)
- 7 days/yr
- Hot days in 30 yrs
- 16 days/yr
Wind risk 1/10 · Minimal
- Chance of severe wind over 30 yrs
- —
Air-quality risk 2/10 · Minimal
- Unhealthy air days now
- 0 days/yr
- Unhealthy air days in 30 yrs
- 1 days/yr
Risk factors via First Street. Map © Google.
Why this score? — see what drove the C grade
The composite is a weighted blend of 9 inputs, each scored 0–100. Each bar is that input's sub-score; the figure is the points it added to the 100-point composite (weight × sub-score).
- Cash flow +14.9/30.0
- ARV discount +10.9/15.0
- Appreciation +10.0/10.0
- DSCR +4.6/10.0
- Schools +4.1/10.0
- Livability +4.0/5.0
- 1% rule +3.9/10.0
- Rent growth +2.5/5.0
- Condition / age +2.5/5.0
$140,000
🖨 Deal sheet (PDF) 📄 Offer letter ✓ Due diligence
Listing remarks
Welcome to this Boonville village home featuring an enclosed porch, refinished hardwood flooring and first floor bedroom and bathroom. The spacious country kitchen has a large center island and comes fully applianced with electric stove, refrigerator and dishwasher. At the back of the kitchen is a rear deck with new support beams overlooking the back yard. And off the kitchen is the laundry room and basement access. On the second level are two adjoining bedrooms and walk in attic space for storage. All of this comes with a circular driveway, barn style garage/storage space, 6 new windows, 2 new exterior doors, fresh paint throughout and over 4 acres of land with a stream running at the rea
Key facts
- Country kitchen
- Basement access
- Laundry room
Tags
Neighborhood map
What this means for you Summary
Snapshot
- This is a 3-bed/1.0-bath single-family listed at $140k.
Deal economics
- At list price, monthly cash flow is $40 ($486/yr) — positive.
- The deal already cash-flows at list — no discount required.
- To meet the 1% rule (rent ≥ 1% of price), the offer needs to be $125k (10.6% below list).
- Recommended offer: $123k (12.0% below list) — sets the bar for market timing.
- Cap rate 6.6% vs local median 3.6% in Boonville — top-decile yield for the area; either an underpriced asset or a hidden risk that comps aren't pricing in. Stress-test before assuming the spread holds.
Location & tenants
- Location reads 79/100 on livability (#146 in NY, #2,225 nationally) — a middle-class / working-renter tenant base. Strengths: cost of living A+, housing A+, health & safety A+; Watch: employment D, commute F.
- Adirondack Central School District (rural): math 41% / reading 54% proficiency, ranked #426 of 590 in NY (top 72%) — families likely to look elsewhere, expect single-tenant / working-renter base with shorter leases.
- Zoned schools: Adirondack Middle School (math 17% / reading 42%, grade F, #550 of 729 statewide, top 77%, 279 students, 55% FRL); Adirondack High School (math 92% / reading 92%, grade A+, #171 of 1,100 statewide, top 18%, 360 students, 58% FRL) — zoned schools average 56% FRL vs 39% district-wide (17 pts higher); higher-poverty schools than district average — tighter screening recommended.
- Zoned-school proficiency averages 61% at this address vs 48% district-wide (+13 pts) — the actual schools serving this property are materially stronger than the Adirondack Central School District average implies; a family-tenant draw the district grade alone would hide.
- Market conditions: 38 active listings in the ZIP; 204 units permitted in Oneida County in 2024 (68 in 5+ unit buildings).
Forward outlook
- In year one you build about $15k of equity ($968 loan paydown + $14k appreciation (10.0% local appreciation)).
- Oneida County population projected at -12% by 2050 — secular population decline; favor cash flow + early exit over multi-decade hold.
- At projected returns (10.0% appreciation + 3.0% rent growth), your $39k cash investment doubles in ~3 years — after that, you're playing with house money.
- By year 3, paydown + projected appreciation supports a ~$38k cash-out refi (75% LTV) — recoverable capital for the next deal without selling this one.
Negotiation context
- It's been on market 365 days — a 12% lower offer ($123k) is reasonable based on typical stale-listing flexibility.
- Current owner paid $69k; list at $140k implies a 103% gain — meaningful room to come down on a strong offer.
Risks & watch-outs
- Watch-outs: built in 1910 — expect roof / HVAC / electrical / plumbing capex.
Questions for the listing agent
- It's been on market 365 days. Have you received any prior offers? Is the seller open to a 12% concession, seller financing, or rate buy-down credit?
- Built in 1910 — when were the roof, HVAC, electrical panel, plumbing, and water heater last replaced?
- Why hasn't it sold? Are there any deal-killer items the seller is aware of (foundation, flood, title, zoning, code violations)?
- Is there a deadline driving the sale (1031 exchange, divorce, estate, relocation)? That informs how much negotiation room exists.
- What's the average days-on-market for RENTAL listings here right now (not sales)? A rising rental-DOM trend means longer vacancies and softer asking-rent achievability than the comps imply.
- What's the recent tenant-quality profile in this submarket — average credit score on applications, eviction rate, late-payment / NSF rate, and stable-employment percentage? A property-management company in the area should have these aggregated.
- How much new for-sale + rental construction is in the pipeline within 1–3 miles? Heavy new supply typically softens prices + rents 12–24 months out; constrained supply supports both.
Investment metrics
- 1% rule
- 0.89% ✗
- Cap rate
- 6.64%
- Cash-on-cash
- 1.24%
- DSCR
- 1.06
- GRM
- 9.3
CMA / ARV
- ARV (on-the-fly)
- $151,520
- Comps found
- 8
Show comp detail 8 sales within ~0.75 mi
| Address | Dist | Beds/Ba | Sqft | Sold | Price | $/sf | Match |
|---|---|---|---|---|---|---|---|
| 211 Summit St | 0.22mi | 3/2.0 | 1,750 (-8%) | 8mo | $190,000 | $109 | 66 |
| 133 Erwin St | 0.22mi | 4/1.5 (+1) | 1,902 (+0%) | 20mo | $155,000 | $81 | 66 |
| 123 Erwin St | 0.23mi | 3/2.5 | 2,004 (+6%) | 20mo | $159,650 | $80 | 56 |
| 130 Erwin St | 0.25mi | 4/2.0 (+1) | 2,126 (+12%) | 7mo | $45,000 | $21 | 53 |
| 101 Seiter St | 0.49mi | 3/1.0 | 1,617 (-15%) | 5mo | $103,000 | $64 | 49 |
| 310 Main St | 0.72mi | 3/2.0 | 1,866 (-2%) | 23mo | $66,950 | $36 | 41 |
| 8022 W Leyden Rd | 0.67mi | 4/2.5 (+1) | 2,120 (+12%) | 2mo | $330,000 | $156 | 37 |
| 308 Main St | 0.72mi | 4/1.5 (+1) | 1,702 (-10%) | 19mo | $30,000 | $18 | 27 |
Match score weights: distance 35% · size 25% · config 20% · recency 20%. Top-matched comps best support the ARV.
Projected returns pro-forma
10.0% appreciation · 3.0% rent growth · sell at horizon
- IRR
- 25.2%
- Equity multiple
- 3.01×
- Total profit
- $78,832
- Equity at exit
- $126,123
- IRR
- 22.2%
- Equity multiple
- 6.87×
- Total profit
- $230,134
- Equity at exit
- $271,989
Cash invested: $39,200 (down + closing). Projections, not guarantees.
Landlord ↔ Tenant lean methodology
- Overall (STATE)
- 15 Strongly Tenant-Friendly
- State New York
- 15 Strongly Tenant-Friendly · D+10
- County
- — inherits STATE
- City
- — inherits STATE
ZIP-level market 13309
- Home prices YoY
- 24.5%
- Active inventory
- 38
- Price-to-rent
- 9.3×
Monthly cashflow live
- Estimated rent
- $1,251 medium interval (Pro) →
- Mortgage (P&I)
- −$734
- Tax from tax record
- −$156 /mo · $1,868/yr
- Insurance
- −$58
- HOA
- −$0
- Vacancy / Maint / Mgmt
- −$263
- Net cashflow
- $40
Break-even live
Sensitivity live
| Price | -10% $120 | -5% $80 | +0% $40 | +5% $1 | +10% $-39 |
|---|---|---|---|---|---|
| Rent | -10% $-58 | -5% $-9 | +0% $40 | +5% $90 | +10% $139 |
| Rate | -1.0pp $111 | -0.5pp $76 | base $40 | +0.5pp $4 | +1.0pp $-33 |
UW: 25.0% down · 7.5% · 30yr · 1.5% tax · 5.0% vac · 8.0% maint · 8.0% mgmt
Financing live
Cash to close
- Down payment
- $35,000
- Closing costs
- $4,200
- Reserves months
- —
- Total cash needed
- —
Loan-product check · same deal, 3 products live
Conventional
25% down · 7.5% · 30yr
- Down + closing
- —
- Monthly P&I
- —
- Monthly cashflow
- —
- DSCR
- —
- Eligible?
- —
Personal DTI + credit; lowest rate.
DSCR
20% down · 8.5% · 30yr
- Down + closing
- —
- Monthly P&I
- —
- Monthly cashflow
- —
- DSCR
- —
- Eligible?
- —
No personal income docs; deal must DSCR.
Hard money
10% down · 12.0% · 12mo
- Down + closing
- —
- Monthly P&I
- —
- Monthly cashflow
- —
- DSCR
- —
- Eligible?
- —
Short-term bridge; refi at stabilization.
Listing history 13 events
-
2026-06-12statusdays on market $140,000 Pending 365 DOM
-
2026-06-09days on market $140,000 Active Under Contract 364 DOM
-
2026-06-08days on market $140,000 Active Under Contract 363 DOM
-
2026-06-07days on market $140,000 Active Under Contract 362 DOM
-
2026-06-07days on market $140,000 Active Under Contract 361 DOM
-
2026-06-04days on market $140,000 Active Under Contract 358 DOM
-
2026-06-02days on market $140,000 Active Under Contract 357 DOM
-
2026-06-01days on market $140,000 Active Under Contract 356 DOM
-
2026-05-31days on market $140,000 Active Under Contract 355 DOM
-
2026-02-17historical Active Under Contract
-
2026-02-02price $140,000
-
2025-06-10$150,000 Active
-
2003-10-30soldstatus $69,000
ⓘ Source: listings_history table (triggers on properties + properties_extension) + one-shot
backfill from property_details.listing_events for pre-trigger history.
Tax reassessment forecast NY · Partial reset (capped growth)
- Current annual tax
- $1,868 · $156/mo
- Projected year-2 tax
- $2,117 · $176/mo
- Expected delta
- +$249/yr (+$21/mo · 13.3%)
ⓘ Screening estimate from a state-policy table — verify with the county assessor before closing.
Climate risk First Street
- Flood 1/10 Low FEMA zone X (unshaded) · 0% chance over 30 yrs
- Wildfire 3/10 Moderate
- Heat 1/10 Low 7 d/yr ≥89°F today · 16 d/yr by 30 yrs out
- Wind 1/10 Low
- Air quality 2/10 Low 0 unhealthy d/yr today · 1 by 30 yrs out
Nearby sold comps map
Loading sold comps map…
Walkable amenities ~0.75 mi
Loading nearby amenities…
Taxation est. · year 1
- Rental income
- $15,017
- − Mortgage interest
- −$7,842
- − Property taxes
- −$1,868
- − Insurance
- −$700
- − Repairs & maintenance
- −$1,201
- − Management
- −$1,201
- − Depreciation
- −$4,073
- Taxable loss
- −$1,868
- Est. tax savings @ 24.0%
- +$448
- After-tax cash flow
- $934/yr
For passive investors: Depreciation is non-cash, so a rental often shows a tax loss while cash-flowing — sheltering income. Rental losses are passive: they offset passive income freely, and up to $25,000/yr can offset ordinary (W-2) income if you actively participate and your MAGI is under $100k (phasing out to $0 by $150k); unused losses carry forward. On sale, claimed depreciation is recaptured at up to 25%, and gains may owe capital-gains tax (a 1031 exchange can defer both). Figures are a year-1 estimate at your 24.0% rate — not tax advice; consult a CPA.
Schools (NCES district)
- District
- Adirondack Central School District
- NCES district ID
- 3605040
- Math proficiency
- 41% ▼ -5.00%
- Reading proficiency
- 54% ▲ 5.00%
- Median HH income
- $50,343
- Composite
- 40.7/100
- National rank
- #3669
- State rank
- #426 of 590 in NY
Livability — Boonville
- Score
- 79/100
- State rank
- #146
- US rank
- #2225
Category grades
Schools grade is shown separately in the Schools card above.
Census & demographics
- Census place
- Boonville, NY
- City population
- 5,828
- Population (ZIP)
- 5,828
Population outlook (Oneida County) Hauer SSP2
- Today (2025)
- 225,223 people
- By 2030
- 220,384 · -2.1%
- By 2040
- 209,071 · -7.2%
- By 2050
- 197,920 · -12.1%
- By 2075
- 175,541 · -22.1%
- By 2100
- 148,491 · -34.1%
Race, ethnicity, and origin ACS 2023
- Neighborhood character
- Predominantly White (95%)
- Race & ethnicity
- White 95% Two or more races 4%
- Common ancestry
- Romanian 10% Lithuanian 5% Slovak 3%
- Foreign-born
- 0%
Political lean MEDSL · Oneida
- 2024 margin
- Strong R (+21.3) · D 39.4% · R 60.6%
- 2008→2024 swing
- -15.2pp toward R · 2008: -6.1pp · 2024: -21.3pp
- All cycles
- 2024: R+21.3 2020: R+15.5 2016: R+21.1 2012: R+5.3 2008: R+6.1
Not yet ingested
- Civics
- —
Market trends
- HPI YoY
- ▲ 83.52%
- Current HPI
- 425.0098
- Rent YoY
- —
- Metro
- —
- State GDP YoY
- ▲ 2.60%
- F500 in state
- 92
Industry mix (Fortune 500 HQ in NY)
| Industry | F500 HQs | Revenue |
|---|---|---|
| Financial Services | 10 | $950B |
|
||
| Consumer Goods | 9 | $162B |
|
||
| Insurance | 4 | $225B |
|
||
| Telecommunications | 2 | $144B |
|
||
| Pharmaceuticals | 2 | $112B |
|
||
| Media / Entertainment | 2 | $69B |
|
||
Price history
+102.9% since first listed4 events — show timeline
- 2026-02-17 Contingent — CNYIS
- 2026-02-02 Price Changed $140,000 CNYIS
- 2025-06-10 Listed $150,000 CNYIS
- 2003-10-30 Sold (Public Records) $69,000 Public Records
Property tax history
-2.9%/yrLatest (2025): $1,868 · -26.3% YoY. Source: county tax records.
Cash-flow waterfall
monthlySold comps — $/sqft
last 12 mo · ≤1 miLoading sold comps…