58 Co Rd 6009 -- · St. Johns, AZ
Flood risk 1/10 · Minimal
- FEMA flood zone
- D
- Chance of flooding over 30 yrs
- 0.0%
- Est. flood insurance / yr
- $544 – $1,084
Fire risk 2/10 · Minimal
- Est. fire insurance / yr
- $610 – $1,132
Heat risk 4/10 · Minor
- Hot days now (above 92°F)
- 7 days/yr
- Hot days in 30 yrs
- 19 days/yr
Wind risk 1/10 · Minimal
- Chance of severe wind over 30 yrs
- —
Air-quality risk 4/10 · Minor
- Unhealthy air days now
- 4 days/yr
- Unhealthy air days in 30 yrs
- 4 days/yr
Risk factors via First Street. Map © Google.
Why this score? — see what drove the F grade
The composite is a weighted blend of 9 inputs, each scored 0–100. Each bar is that input's sub-score; the figure is the points it added to the 100-point composite (weight × sub-score).
- Cash flow +9.6/30.0
- Appreciation +5.7/10.0
- Schools +4.7/10.0
- 1% rule +2.9/10.0
- DSCR +2.7/10.0
- Rent growth +2.5/5.0
- Livability +2.5/5.0
- Condition / age +2.5/5.0
- ARV discount +0.0/15.0
$159,000
🖨 Deal sheet (PDF) 📄 Offer letter ✓ Due diligence
Listing remarks
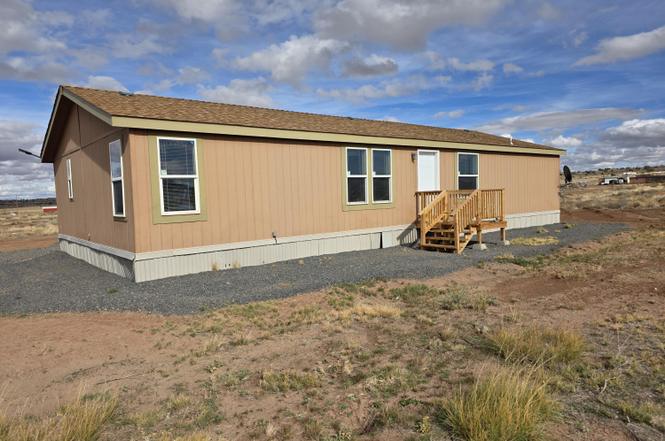
MOTIVATED SELLER!!! Don't miss this nice well maintained 2013 Modular Home, on two one acre parcels (Lot 153 AND 154 included), private registered well in San Juan Hacienda subdivision. Three Bedrooms with two full baths, appliances are included. Make this your perfect starter home!
Key facts
- Modular home
- Two one acre parcels
- 1.15 acre lot
Tags
Property features AI
Finance
- HOA & community: No association fees
Exterior
- Utilities: Private well water; Septic tank sewer; Other utilities
- Home design: Modular / pre-fab property; Fee simple ownership; Dirt road frontage
- Construction: Vinyl siding with wood frame construction; Composition roof
- Exterior features: Dirt front and back yard; County-maintained road access; Horses allowed; No fencing
Interior
- Kitchen: Kitchen island; Laminate counters; Refrigerator included
- Bedrooms: Up to 3 bedrooms
- Flooring: Carpet; Vinyl
- Bathrooms: 2 full bathrooms
- Heating & cooling: Propane heating; Cooling: see remarks
- Interior features: Vaulted ceilings; Kitchen island; Full bath in primary bedroom; Laminate countertops
Neighborhood map
What this means for you Summary
Snapshot
- This is a 3-bed/2.0-bath manufactured listed at $159k.
Deal economics
- At list price, monthly cash flow is $-108 ($-1k/yr) — negative.
- To cash-flow at today's rent, offer at most $143k (9.8% below list).
- To meet the 1% rule (rent ≥ 1% of price), the offer needs to be $125k (21.1% below list).
- Recommended offer: $125k (21.1% below list) — sets the bar for 1% rule.
- Cap rate 5.5% vs local median 2.8% in St. Johns — top-decile yield for the area; either an underpriced asset or a hidden risk that comps aren't pricing in. Stress-test before assuming the spread holds.
Location & tenants
- Location reads: area grade F — affects rentability + tenant quality, not the cash-flow math above.
- St Johns Unified District (4153) (town): math 59% / reading 52% proficiency, ranked #34 of 249 in AZ (top 14%) — acceptable for families but not a draw, mixed tenant base, ~2y average lease.
- Zoned schools: Coronado Elementary School (math 74% / reading 64%, grade A-, #59 of 1,109 statewide, top 6%, 290 students, 51% FRL); St Johns Middle School (math 63% / reading 53%, grade B, #5 of 218 statewide, top 2%, 340 students, 44% FRL); St Johns High School (math 37% / reading 42%, grade F, #72 of 381 statewide, top 20%, 317 students, 36% FRL) — zoned schools at 43% FRL track the district average.
- Market conditions: 190 active listings in the ZIP; 99 units permitted in Apache County in 2024 (0 in 5+ unit buildings).
Forward outlook
- In year one you build about $3k of equity ($1k loan paydown + $2k appreciation (1.4% local appreciation)).
- Apache County population projected at -12% by 2050 — secular population decline; favor cash flow + early exit over multi-decade hold.
- By year 10, paydown + projected appreciation supports a ~$34k cash-out refi (75% LTV) — recoverable capital for the next deal without selling this one.
Negotiation context
- It's been on market 123 days — a 12% lower offer ($140k) is reasonable based on typical stale-listing flexibility.
- 2 sale attempts; this cycle's ask has dropped $51k (24%) from the opening price — seller is motivated, your offer sets the floor, not the list.
- Current owner paid $100k; list at $159k implies a 59% gain — meaningful room to come down on a strong offer.
Questions for the listing agent
- What do current leases actually rent for vs. the listed asking? Can we see a recent rent roll and the last 12 months of T-12 income?
- It's been on market 123 days. Have you received any prior offers? Is the seller open to a 21% concession, seller financing, or rate buy-down credit?
- Why hasn't it sold? Are there any deal-killer items the seller is aware of (foundation, flood, title, zoning, code violations)?
- Is there a deadline driving the sale (1031 exchange, divorce, estate, relocation)? That informs how much negotiation room exists.
- The area grade is low — what's the realistic commute time and amenity access for the typical tenant pool here? Any planned neighborhood developments (good or bad) we should know about?
- What's the average days-on-market for RENTAL listings here right now (not sales)? A rising rental-DOM trend means longer vacancies and softer asking-rent achievability than the comps imply.
- What's the recent tenant-quality profile in this submarket — average credit score on applications, eviction rate, late-payment / NSF rate, and stable-employment percentage? A property-management company in the area should have these aggregated.
- How much new for-sale + rental construction is in the pipeline within 1–3 miles? Heavy new supply typically softens prices + rents 12–24 months out; constrained supply supports both.
Investment metrics
- 1% rule
- 0.79% ✗
- Cap rate
- 5.48%
- Cash-on-cash
- -2.91%
- DSCR
- 0.87
- GRM
- 10.6
CMA / ARV
- ARV (on-the-fly)
- $107,496
- Comps found
- 3
Show comp detail 3 sales within ~0.75 mi
| Address | Dist | Beds/Ba | Sqft | Sold | Price | $/sf | Match |
|---|---|---|---|---|---|---|---|
| 27 Trail Dr | 0.18mi | 3/1.0 | 1,400 (-6%) | 1mo | $159,000 | $114 | 76 |
| 33 Co Rd 6009 | 0.26mi | 3/2.0 | 1,536 (+3%) | 11mo | $110,000 | $72 | 74 |
| 8 Trail Dr | 0.46mi | 2/1.0 (-1) | 1,440 (-4%) | 8mo | $45,000 | $31 | 57 |
Match score weights: distance 35% · size 25% · config 20% · recency 20%. Top-matched comps best support the ARV.
Projected returns pro-forma
1.41% appreciation · 3.0% rent growth · sell at horizon
- IRR
- -0.3%
- Equity multiple
- 0.98×
- Total profit
- $-706
- Equity at exit
- $57,671
- IRR
- 4.3%
- Equity multiple
- 1.55×
- Total profit
- $24,446
- Equity at exit
- $79,334
Cash invested: $44,520 (down + closing). Projections, not guarantees.
Landlord ↔ Tenant lean methodology
- Overall (STATE)
- 87 Strongly Landlord-Friendly
- State Arizona
- 87 Strongly Landlord-Friendly · R+3
- County
- — inherits STATE
- City
- — inherits STATE
ZIP-level market 85936
- Home prices YoY
- 0.7%
- Active inventory
- 190
- Price-to-rent
- 10.6×
Monthly cashflow live
- Estimated rent
- $1,254 medium interval (Pro) →
- Mortgage (P&I)
- −$834
- Tax est. 1.5%
- −$199 /mo · $2,385/yr
- Insurance
- −$66
- HOA
- −$0
- Vacancy / Maint / Mgmt
- −$263
- Net cashflow
- $-108
Break-even live
Sensitivity live
| Price | -10% $2 | -5% $-53 | +0% $-108 | +5% $-163 | +10% $-218 |
|---|---|---|---|---|---|
| Rent | -10% $-207 | -5% $-158 | +0% $-108 | +5% $-59 | +10% $-9 |
| Rate | -1.0pp $-28 | -0.5pp $-68 | base $-108 | +0.5pp $-149 | +1.0pp $-191 |
UW: 25.0% down · 7.5% · 30yr · 1.5% tax · 5.0% vac · 8.0% maint · 8.0% mgmt
Financing live
Cash to close
- Down payment
- $39,750
- Closing costs
- $4,770
- Reserves months
- —
- Total cash needed
- —
Loan-product check · same deal, 3 products live
Conventional
25% down · 7.5% · 30yr
- Down + closing
- —
- Monthly P&I
- —
- Monthly cashflow
- —
- DSCR
- —
- Eligible?
- —
Personal DTI + credit; lowest rate.
DSCR
20% down · 8.5% · 30yr
- Down + closing
- —
- Monthly P&I
- —
- Monthly cashflow
- —
- DSCR
- —
- Eligible?
- —
No personal income docs; deal must DSCR.
Hard money
10% down · 12.0% · 12mo
- Down + closing
- —
- Monthly P&I
- —
- Monthly cashflow
- —
- DSCR
- —
- Eligible?
- —
Short-term bridge; refi at stabilization.
Listing history 8 events
-
2026-05-14status Active
-
2026-03-10status Pending
-
2026-02-27price $159,000
-
2026-01-13price $185,000
-
2025-12-02price $199,000
-
2025-11-18$210,000 Active
-
2025-01-23soldstatus $100,000
-
2005-05-25soldstatus $9,000
ⓘ Source: listings_history table (triggers on properties + properties_extension) + one-shot
backfill from property_details.listing_events for pre-trigger history.
Climate risk First Street
- Flood 1/10 Low FEMA zone D · 0% chance over 30 yrs
- Wildfire 2/10 Low
- Heat 4/10 Moderate 7 d/yr ≥92°F today · 19 d/yr by 30 yrs out
- Wind 1/10 Low
- Air quality 4/10 Moderate 4 unhealthy d/yr today · 4 by 30 yrs out
Nearby sold comps map
Loading sold comps map…
Walkable amenities ~0.75 mi
Loading nearby amenities…
Taxation est. · year 1
- Rental income
- $15,049
- − Mortgage interest
- −$8,906
- − Property taxes
- −$2,385
- − Insurance
- −$795
- − Repairs & maintenance
- −$1,204
- − Management
- −$1,204
- − Depreciation
- −$4,625
- Taxable loss
- −$4,071
- Est. tax savings @ 24.0%
- +$977
- After-tax cash flow
- $-320/yr
For passive investors: Depreciation is non-cash, so a rental often shows a tax loss while cash-flowing — sheltering income. Rental losses are passive: they offset passive income freely, and up to $25,000/yr can offset ordinary (W-2) income if you actively participate and your MAGI is under $100k (phasing out to $0 by $150k); unused losses carry forward. On sale, claimed depreciation is recaptured at up to 25%, and gains may owe capital-gains tax (a 1031 exchange can defer both). Figures are a year-1 estimate at your 24.0% rate — not tax advice; consult a CPA.
Schools (NCES district)
- District
- St Johns Unified District (4153)
- NCES district ID
- 0408080
- Math proficiency
- 59% ▲ 1.00%
- Reading proficiency
- 52% ▼ -3.00%
- Median HH income
- $43,578
- Composite
- 46.77/100
- National rank
- #2387
- State rank
- #34 of 249 in AZ
Livability — St. Johns
No livability data for this city. (Only ~50 U.S. cities are tracked.)
Census & demographics
- Population (ZIP)
- 3,966
Population outlook (Apache County) Hauer SSP2
- Today (2025)
- 70,338 people
- By 2030
- 69,279 · -1.5%
- By 2040
- 66,449 · -5.5%
- By 2050
- 61,904 · -12.0%
- By 2075
- 47,639 · -32.3%
- By 2100
- 30,279 · -57.0%
Race, ethnicity, and origin ACS 2023
- Neighborhood character
- Predominantly White (65%)
- Race & ethnicity
- White 65% Hispanic / Latino 24% Two or more races 9% Black 8% Native American 1%
- Hispanic origin (detail)
- Mexican 22%
- Common ancestry
- Lithuanian 11% Slovak 7% Italian 5%
- Foreign-born
- 3% · Canada
- Languages at home
- 90% English-only · Spanish 9%
Political lean MEDSL · Apache
- 2024 margin
- D (+19.0) · D 58.9% · R 40.0% · Other 1.1%
- 2008→2024 swing
- -9.2pp toward R · 2008: 28.2pp · 2024: 19.0pp
- All cycles
- 2024: D+19.0 2020: D+33.7 2016: D+36.9 2012: D+33.9 2008: D+28.2
Not yet ingested
- Civics
- —
Market trends
- HPI YoY
- ▲ 1.41%
- Current HPI
- 195.8896
- Rent YoY
- —
- Metro
- —
- State GDP YoY
- ▲ 4.54%
- F500 in state
- 20
Industry mix (Fortune 500 HQ in AZ)
| Industry | F500 HQs | Revenue |
|---|---|---|
| Technology | 2 | $13B |
|
||
| Mining / Metals | 1 | $23B |
|
||
| Environmental Services | 1 | $16B |
|
||
| Metals / Steel | 1 | $14B |
|
||
| Technology Distribution | 1 | $9B |
|
||
| Homebuilding | 1 | $8B |
|
||
Price history
+1666.7% since first listed8 events — show timeline
- 2026-05-14 Relisted — ARMLS
- 2026-03-10 Pending — ARMLS
- 2026-02-27 Price Changed $159,000 ARMLS
- 2026-01-13 Price Changed $185,000 ARMLS
- 2025-12-02 Price Changed $199,000 ARMLS
- 2025-11-18 Listed $210,000 ARMLS
- 2025-01-23 Sold (Public Records) $100,000 Public Records
- 2005-05-25 Sold (Public Records) $9,000 Public Records
Property tax history
-2.3%/yrLatest (2025): $17 · +4.4% YoY. Source: county tax records.
Cash-flow waterfall
monthlySold comps — $/sqft
last 12 mo · ≤1 miLoading sold comps…