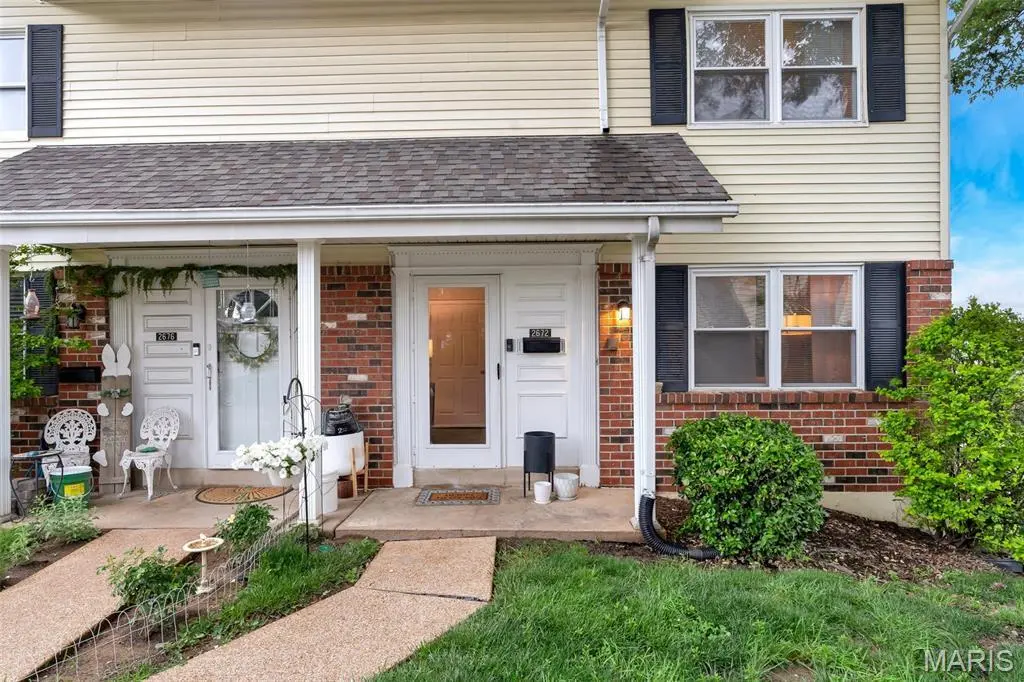
2672 Falcons Way #54 · St. Charles, MO
Flood risk 1/10 · Minimal
- FEMA flood zone
- X (unshaded)
- Chance of flooding over 30 yrs
- 0.0%
- Est. flood insurance / yr
- $507 – $1,088
Fire risk 1/10 · Minimal
- Est. fire insurance / yr
- $1,054 – $1,958
Heat risk 5/10 · Moderate
- Hot days now (above 107°F)
- 7 days/yr
- Hot days in 30 yrs
- 20 days/yr
Wind risk 2/10 · Minimal
- Chance of severe wind over 30 yrs
- 1.0%
Air-quality risk 3/10 · Minor
- Unhealthy air days now
- 2 days/yr
- Unhealthy air days in 30 yrs
- 3 days/yr
Risk factors via First Street. Map © Google.
Why this score? — see what drove the D- grade
The composite is a weighted blend of 9 inputs, each scored 0–100. Each bar is that input's sub-score; the figure is the points it added to the 100-point composite (weight × sub-score).
- Cash flow +8.9/30.0
- ARV discount +7.5/15.0
- 1% rule +4.9/10.0
- Schools +4.1/10.0
- Rent growth +3.3/5.0
- Livability +2.5/5.0
- Condition / age +2.5/5.0
- DSCR +2.4/10.0
- Appreciation +0.0/10.0
$185,000
🖨 Deal sheet (PDF) 📄 Offer letter ✓ Due diligence
Listing remarks MLS
For Comp purposes only
Key facts
- $395 HOA
- 2 parking spots
- Pool
Property features AI
Finance
- HOA & community: HOA: Hawks Nest Condominiums; Monthly association fee of $395; Association amenities include pool and common grounds; HOA fee covers exterior maintenance, roof, pool maintenance, common area maintenance, grounds maintenance, parking/road maintenance, sewer, water, trash, and snow removal
Exterior
- Parking: Assigned parking; Detached carport (1 car) — total parking for 2 vehicles
- Utilities: Public water; Public sewer; Electric service provided by Ameren; Electricity and natural gas connected
- Home design: Residential townhouse; Two levels; Private ownership
- Construction: Fiberglass siding
- Exterior features: Front porch; Rear porch; Community inground pool (private to the association)
Interior
- Kitchen: Stainless steel appliances; Cooktop (electric); Electric oven; Microwave; Dishwasher; Garbage disposal
- Bedrooms: Three bedrooms on the upper level
- Flooring: Laminate flooring
- Bathrooms: Three full bathrooms; One half bathroom (main level)
- Heating & cooling: Natural gas heating; Electric cooling
- Interior features: Partially finished basement with exterior entry and walk-out access; Basement includes a bathroom and 8 ft+ poured walls; One fireplace with insert and blower fan (serving living room and basement)
- Laundry & utility: Laundry located in the basement
Neighborhood map
What this means for you Summary
Snapshot
- This is a 3-bed/3.0-bath condo listed at $185k.
Deal economics
- At list price, monthly cash flow is $-150 ($-2k/yr) — negative.
- To cash-flow at today's rent, offer at most $158k (14.4% below list).
- To meet the 1% rule (rent ≥ 1% of price), the offer needs to be $182k (1.4% below list).
- Recommended offer: $158k (14.4% below list) — sets the bar for cash-flow.
- Cap rate 5.3% vs local median 3.4% in St. Charles — top-decile yield for the area; either an underpriced asset or a hidden risk that comps aren't pricing in. Stress-test before assuming the spread holds.
Location & tenants
- Location reads: area grade D — affects rentability + tenant quality, not the cash-flow math above.
- St. Charles R-VI (urban): math 44% / reading 52% proficiency, ranked #51 of 324 in MO (top 16%) — families likely to look elsewhere, expect single-tenant / working-renter base with shorter leases.
- Market conditions: Rents rising (+3.3%/yr); 202 active listings in the ZIP; 10 comparable units currently listed for rent nearby; rentals leasing fast (median 3d on market — plan ~1-2 weeks tenant-placement turnaround); solid renter incomes; 2,021 units permitted in St. Charles County in 2024 (568 in 5+ unit buildings).
Forward outlook
- Local home prices are declining (-3.0%/yr); year-one equity from $1k of loan paydown is wiped out by about $6k of value loss. Plan a longer hold.
- St. Charles County population projected at +22% by 2050 — long-run rental-demand tailwind backs the buy-and-hold thesis.
Negotiation context
- Only 3 days on market — expect competitive offers; lowballing is unlikely to land.
- 2 sale attempts since 5y ago with the ask held roughly flat each time — persistent listings suggest the price (not the market) is what's stuck; bring a comps-based counter.
- Current owner paid $156k; 19% above their basis — modest negotiation headroom, anchor on the comps not their cost.
Risks & watch-outs
- Watch-outs: HOA is 22% of rent.
- Climate carrying-cost: extreme-heat days projected 7→20/yr by 2055 (HVAC capex compounding) — expect insurance premiums to compound above CPI over the hold.
Questions for the listing agent
- What do current leases actually rent for vs. the listed asking? Can we see a recent rent roll and the last 12 months of T-12 income?
- Built in 1975 — when were the roof, HVAC, electrical panel, plumbing, and water heater last replaced?
- What does the HOA fee cover, when was the last increase, and are there any pending special assessments or reserve-fund shortfalls?
- Any open or pending special assessments — roof, HVAC, plumbing, elevator, façade? What's the per-unit balance and payoff schedule, and is the seller paying it off at close or rolling it to the buyer?
- Is there a deadline driving the sale (1031 exchange, divorce, estate, relocation)? That informs how much negotiation room exists.
- The area grade is low — what's the realistic commute time and amenity access for the typical tenant pool here? Any planned neighborhood developments (good or bad) we should know about?
- What's the average days-on-market for RENTAL listings here right now (not sales)? A rising rental-DOM trend means longer vacancies and softer asking-rent achievability than the comps imply.
- What's the recent tenant-quality profile in this submarket — average credit score on applications, eviction rate, late-payment / NSF rate, and stable-employment percentage? A property-management company in the area should have these aggregated.
- How much new apartment / multifamily construction is in the pipeline within 1–3 miles? Heavy new supply (>2% of stock underway) typically softens rents 12–24 months out; light construction supports rent growth.
Investment metrics
- 1% rule
- 0.99% ✗
- Cap rate
- 5.32%
- Cash-on-cash
- -3.48%
- DSCR
- 0.84
- GRM
- 8.5
CMA / ARV
No comps found within radius.
Projected returns pro-forma
-3.0% appreciation · 3.27% rent growth · sell at horizon
- IRR
- -21.6%
- Equity multiple
- 0.25×
- Total profit
- $-38,842
- Equity at exit
- $27,584
- IRR
- -14.2%
- Equity multiple
- 0.17×
- Total profit
- $-43,217
- Equity at exit
- $15,995
Cash invested: $51,800 (down + closing). Projections, not guarantees.
Landlord ↔ Tenant lean methodology
- Overall (STATE)
- 81 Strongly Landlord-Friendly
- State Missouri
- 81 Strongly Landlord-Friendly · R+10
- County
- — inherits STATE
- City
- — inherits STATE
ZIP-level market 63303
- Rents YoY
- 3.3%
- Active inventory
- 202
- Price-to-rent
- 8.5×
Monthly cashflow live
- Estimated rent
- $1,824 high interval (Pro) →
- Mortgage (P&I)
- −$970
- Tax from tax record
- −$149 /mo · $1,790/yr
- Insurance
- −$77
- HOA
- −$395
- Vacancy / Maint / Mgmt
- −$383
- Net cashflow
- $-150
Break-even live
Sensitivity live
| Price | -10% $-46 | -5% $-98 | +0% $-150 | +5% $-203 | +10% $-255 |
|---|---|---|---|---|---|
| Rent | -10% $-295 | -5% $-222 | +0% $-150 | +5% $-78 | +10% $-6 |
| Rate | -1.0pp $-57 | -0.5pp $-103 | base $-150 | +0.5pp $-198 | +1.0pp $-247 |
UW: 25.0% down · 7.5% · 30yr · 1.5% tax · 5.0% vac · 8.0% maint · 8.0% mgmt
Financing live
Cash to close
- Down payment
- $46,250
- Closing costs
- $5,550
- Reserves months
- —
- Total cash needed
- —
Loan-product check · same deal, 3 products live
Conventional
25% down · 7.5% · 30yr
- Down + closing
- —
- Monthly P&I
- —
- Monthly cashflow
- —
- DSCR
- —
- Eligible?
- —
Personal DTI + credit; lowest rate.
DSCR
20% down · 8.5% · 30yr
- Down + closing
- —
- Monthly P&I
- —
- Monthly cashflow
- —
- DSCR
- —
- Eligible?
- —
No personal income docs; deal must DSCR.
Hard money
10% down · 12.0% · 12mo
- Down + closing
- —
- Monthly P&I
- —
- Monthly cashflow
- —
- DSCR
- —
- Eligible?
- —
Short-term bridge; refi at stabilization.
Rent comps 10 comps
| Address | Beds | Baths | Sqft | Rent | $/sqft | DOM | Units | Dist |
|---|---|---|---|---|---|---|---|---|
| 2483 Falcons Way Saint Charles, MO | 2.0 | 1.5 | 1050 | $1,400 | $1.33 | 45d | 1 | 0.18mi |
| 2200 Lake Ct St Charles, MO | 1.0–2.0 | 1.0–2.0 | 860 | $1,749 | $2.03 | 0d | 15 | 0.45mi |
| 3405 Sherman Park Dr St Charles, MO | 2.0 | 2.5 | 1600 | $2,195 | $1.37 | 3d | 1 | 0.66mi |
| 2000 Sherman Square Dr St Charles, MO | 2.0 | 2.0 | 1092 | $1,612 | $1.48 | 3d | 3 | 0.66mi |
| 1400 Aberdeen Ct Saint Charles, MO | 1.0–2.0 | 1.0–2.0 | 950 | $1,985 | $2.09 | 0d | 25 | 0.68mi |
| 820 Saint Charles Ave Saint Charles, MO | 4.0 | 2.0 | 1288 | $1,800 | $1.40 | 45d | 1 | 1.02mi |
| 1517 Shadow Wood Dr Saint Charles, MO | 3.0 | 2.0 | 1064 | $2,250 | $2.11 | 12d | 1 | 1.05mi |
| 2717 Greenleaf Dr Saint Charles, MO | 3.0 | 2.0 | 1189 | $2,329 | $1.96 | 0d | 1 | 1.28mi |
| 10 San Miguel Dr St Charles, MO | 1.0–2.0 | 1.0–1.5 | 897 | $1,926 | $2.15 | 0d | 13 | 1.29mi |
| 317 S Pam Ave Saint Charles, MO | 4.0 | 2.5 | 1880 | $2,484 | $1.32 | 45d | 1 | 1.44mi |
HOA detail condo
- Monthly dues
- $395 · $4,740/yr
- Assessments
- None detected in remarks — confirm with the listing agent.
Listing history 13 events
-
2026-05-04status Pending 1231-char remark
-
2026-05-01$185,000 Active 1231-char remark
-
2026-04-30historical $185,000 1231-char remark
-
2021-03-26soldstatus $155,500
-
2021-03-25soldstatus Closed 22-char remark
Show marketing remark (22 chars)
For Comp purposes only
-
2021-03-19status Pending 22-char remark
Show marketing remark (22 chars)
For Comp purposes only
-
2021-02-25$155,500 22-char remark
Show marketing remark (22 chars)
For Comp purposes only
-
2020-11-04soldstatus $105,000
-
2020-09-28price $115,000
-
2001-01-24soldstatus $52,000
-
1994-07-01soldstatus $51,900
-
1984-07-01soldstatus $45,000
-
1982-01-01soldstatus $30,500
ⓘ Source: listings_history table (triggers on properties + properties_extension) + one-shot
backfill from property_details.listing_events for pre-trigger history.
Tax reassessment forecast MO · Resets to sale price
- Current annual tax
- $1,790 · $149/mo
- Projected year-2 tax
- $1,794 · $150/mo
- Expected delta
- +$5/yr ($0/mo · 0.3%)
ⓘ Screening estimate from a state-policy table — verify with the county assessor before closing.
Climate risk First Street
- Flood 1/10 Low FEMA zone X (unshaded) · 0% chance over 30 yrs
- Wildfire 1/10 Low
- Heat 5/10 Major 7 d/yr ≥107°F today · 20 d/yr by 30 yrs out
- Wind 2/10 Low 100% chance of damaging wind over 30 yrs
- Air quality 3/10 Moderate 2 unhealthy d/yr today · 3 by 30 yrs out
Nearby sold comps map
Loading sold comps map…
Walkable amenities ~0.75 mi
Loading nearby amenities…
Taxation est. · year 1
- Rental income
- $21,888
- − Mortgage interest
- −$10,363
- − Property taxes
- −$1,790
- − Insurance
- −$925
- − Repairs & maintenance
- −$1,751
- − Management
- −$1,751
- − HOA
- −$4,740
- − Depreciation
- −$5,382
- Taxable loss
- −$4,813
- Est. tax savings @ 24.0%
- +$1,155
- After-tax cash flow
- $-650/yr
For passive investors: Depreciation is non-cash, so a rental often shows a tax loss while cash-flowing — sheltering income. Rental losses are passive: they offset passive income freely, and up to $25,000/yr can offset ordinary (W-2) income if you actively participate and your MAGI is under $100k (phasing out to $0 by $150k); unused losses carry forward. On sale, claimed depreciation is recaptured at up to 25%, and gains may owe capital-gains tax (a 1031 exchange can defer both). Figures are a year-1 estimate at your 24.0% rate — not tax advice; consult a CPA.
Schools (NCES district)
- District
- St. Charles R-VI
- NCES district ID
- 2928920
- Math proficiency
- 44% ▼ -4.00%
- Reading proficiency
- 52% ▼ -1.00%
- Median HH income
- $52,897
- Composite
- 41.38/100
- National rank
- #3486
- State rank
- #51 of 324 in MO
Livability — St. Charles
No livability data for this city. (Only ~50 U.S. cities are tracked.)
Census & demographics
- Census place
- St. Charles, MO
- County
- Saint Charles County · 399,703 people
- Metro
- St. Louis, MO-IL
- Population (ZIP)
- 46,089
- Household income
- $99,138
- Rent vs Own
- Severe rent burden
- 1026.0
Population outlook (St. Charles County) Hauer SSP2
- Today (2025)
- 437,857 people
- By 2030
- 461,707 · +5.4%
- By 2040
- 503,222 · +14.9%
- By 2050
- 534,684 · +22.1%
- By 2075
- 597,047 · +36.4%
- By 2100
- 609,682 · +39.2%
Race, ethnicity, and origin ACS 2023
- Neighborhood character
- Predominantly White (79%)
- Race & ethnicity
- White 79% Black 6% Asian 6% Two or more races 6% Hispanic / Latino 5%
- Common ancestry
- Lithuanian 3% Romanian 3% Slovak 2%
- Foreign-born
- 7% · Canada, China, South Korea
- Languages at home
- 91% English-only · Spanish 3% Other Indo-European 1% Other Asian/Pacific 1%
Political lean MEDSL · St. Charles
- 2024 margin
- R (+17.0) · D 40.8% · R 57.8% · Other 1.4%
- 2008→2024 swing
- -7.2pp toward R · 2008: -9.7pp · 2024: -17.0pp
- All cycles
- 2024: R+17.0 2020: R+17.5 2016: R+26.4 2012: R+21.0 2008: R+9.7
Not yet ingested
- Civics
- —
Market trends
- HPI YoY
- ▼ -260.84%
- Current HPI
- 224.7406
- Rent YoY
- ▲ 3.27%
- Metro
- St. Louis, MO-IL
- State GDP YoY
- ▲ 1.84%
- F500 in state
- 20
Industry mix (Fortune 500 HQ in MO)
| Industry | F500 HQs | Revenue |
|---|---|---|
| Healthcare | 1 | $163B |
|
||
| Insurance | 1 | $21B |
|
||
| Industrial Technology | 1 | $17B |
|
||
| Retail | 1 | $16B |
|
||
| Industrial Distribution | 1 | $10B |
|
||
| Utilities | 1 | $9B |
|
||
Price history
+506.6% since first listed13 events — show timeline
- 2026-05-04 Pending — MARIS as Distributed by MLS Grid
- 2026-05-01 Listed $185,000 MARIS as Distributed by MLS Grid
- 2026-04-30 Coming Soon $185,000 MARIS as Distributed by MLS Grid
- 2021-03-26 Sold (Public Records) $155,500 Public Records
- 2021-03-25 Sold (MLS) — MARIS as Distributed by MLS Grid
- 2021-03-19 Pending — MARIS as Distributed by MLS Grid
- 2021-02-25 Listed $155,500 MARIS as Distributed by MLS Grid
- 2020-11-04 Sold (Public Records) $105,000 Public Records
- 2020-09-28 Price Changed $115,000 MARIS as Distributed by MLS Grid
- 2001-01-24 Sold (Public Records) $52,000 Public Records
- 1994-07-01 Sold (Public Records) $51,900 Public Records
- 1984-07-01 Sold (Public Records) $45,000 Public Records
- 1982-01-01 Sold (Public Records) $30,500 Public Records
Property tax history
+4.4%/yrLatest (2025): $1,790 · +4.6% YoY. Source: county tax records.
Cash-flow waterfall
monthlySold comps — $/sqft
last 12 mo · ≤1 miLoading sold comps…