 🌊 Lakefront
3100 Binnacle Dr #104 · Naples, FL
Flood risk 7/10 · Major
- FEMA flood zone
- X (shaded)
- Chance of flooding over 30 yrs
- 0.74%
- Est. flood insurance / yr
- $507 – $1,088
Fire risk 1/10 · Minimal
- Est. fire insurance / yr
- $947 – $1,759
Heat risk 10/10 · Severe
- Hot days now (above 107°F)
- 7 days/yr
- Hot days in 30 yrs
- 27 days/yr
Wind risk 10/10 · Severe
- Chance of severe wind over 30 yrs
- 99.0%
Air-quality risk 2/10 · Minimal
- Unhealthy air days now
- 2 days/yr
- Unhealthy air days in 30 yrs
- 2 days/yr
Risk factors via First Street. Map © Google.
Why this score? — see what drove the B grade
The composite is a weighted blend of 9 inputs, each scored 0–100. Each bar is that input's sub-score; the figure is the points it added to the 100-point composite (weight × sub-score).
- Cash flow +27.1/30.0
- 1% rule +10.0/10.0
- DSCR +9.4/10.0
- ARV discount +7.5/15.0
- Rent growth +5.0/5.0
- Schools +5.0/10.0
- Livability +4.0/5.0
- Condition / age +2.5/5.0
- Appreciation +0.0/10.0
$289,000
🖨 Deal sheet (PDF) 📄 Offer letter ✓ Due diligence
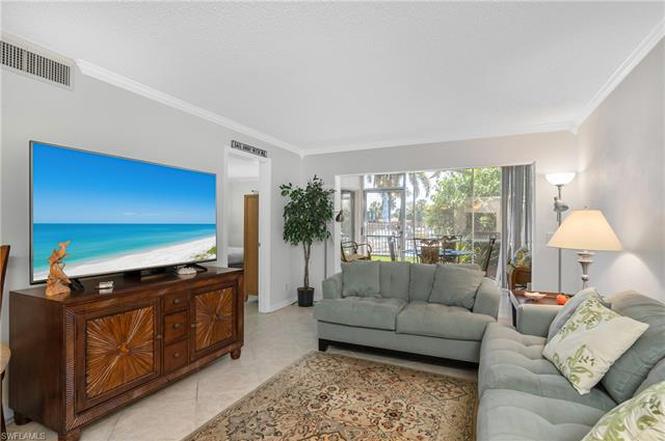
Listing remarks
Don't miss out on the opportunity to own in prestigious Moorings Community. This lovely condo is conveniently located on 1st floor, close to community pool and your parking spot. The living room is open floor plan with glass sliding doors out to the landscaped yard or pool. Lots of natural sunlight thru the large windows in each of the main rooms. Kitchen has ample space to move around and lots of storage. The pass thru to the dining area makes it convenient yet not crowded. Main bedroom is located separate from guest bedroom. Main has 2 closets, and an ensuite bath with updated shower. Guest bedroom is located just off the guest bath which has a tub/shower combo. Comfortable furnishings al
Key facts
- 1st floor
- Lots of storage
- Community pool
Tags
Property features AI
Finance
- Other: Complex has 24 units; 1 unit per floor; building has 1 floor
- Financial info: Land lease fee: $2,348 (semi-annually)
- HOA & community: Quarterly condo fee; Quarterly condo fee amount: $2,700; Professional management; Community amenities include beach club access, community pool, extra storage, internet access, sidewalk, underground utilities, vehicle wash area, and common laundry; Maintenance covers lawn/land, pest control (exterior), reserves, sewer, street maintenance, trash removal and water; Non-gated community; Total annual recurring fees: $15,496; Total one-time fees: $150; Land lease fee paid semi-annually
Exterior
- Parking: 1 assigned deeded parking space
- Utilities: Central water; Central sewer; Cable available
- Home design: Residential property in a low-rise (1-3) building; Built in 1974; Stucco exterior; Rear exposure faces east; Part of the MOORINGS / PORTSIDE CLUB development; Building description: see remarks
- Construction: Concrete block construction; Built-up or flat roof
- Exterior features: Pond on property; Lake waterfront; Views of pond and pool/club; Central irrigation; Zero lot line
Interior
- Kitchen: Dishwasher; Microwave; Range; Refrigerator; Breakfast bar; Dining area (family)
- Bedrooms: 2 bedrooms
- Flooring: Tile flooring
- Bathrooms: 2 full bathrooms; Master bath with shower only
- Heating & cooling: Central electric heat; Central electric cooling; Ceiling fans
- Interior features: Cable prewire and high-speed internet available; Smoke detectors; Window coverings; Great room floor plan; Family room; Glass porch; Turnkey furnished; Common elevator; 3 ceiling fans
- Laundry & utility: Common laundry (community)
Neighborhood map
What this means for you Summary
Snapshot
- This is a 2-bed/2.0-bath condo listed at $289k.
Deal economics
- At list price, monthly cash flow is $755 ($9k/yr) — positive.
- The deal already cash-flows at list — no discount required.
- Meets the 1% rule at list price ($5k rent vs $289k).
- Recommended offer: $263k (9.0% below list) — sets the bar for market timing.
Location & tenants
- Location reads 80/100 on livability (#126 in FL, #1,903 nationally) — a professional / high-income tenant draw. Strengths: crime A+, amenities A+, employment A+; Watch: commute D+, cost of living F.
- Collier (suburban): math 60% / reading 56% proficiency, ranked #16 of 73 in FL (top 22%) — acceptable for families but not a draw, mixed tenant base, ~2y average lease.
- Zoned schools: Sea Gate Elementary School (math 86% / reading 81%, grade A+, #60 of 2,144 statewide, top 3%, 703 students, 26% FRL); Naples High School (math 47% / reading 52%, grade D, #179 of 667 statewide, top 29%, 1,719 students, 39% FRL) — zoned schools average 32% FRL vs 55% district-wide (23 pts lower); this property's tenant base skews higher-income than the district average.
- Market conditions: Rents rising fast (+14.6%/yr); 480 active listings in the ZIP; 16 comparable units currently listed for rent nearby; rentals at typical pace (median 25d on market — plan ~3-4 weeks tenant-placement turnaround); high-income renter base; 3,520 units permitted in Collier County in 2024 (959 in 5+ unit buildings).
- At $4,556/mo this rent would consume 47% of the median local household income ($117k/yr) (locally 311% of renters already pay >50% of income on rent) — very limited rent-growth headroom before tenants either downsize or default.
Forward outlook
- Local home prices are declining (-3.0%/yr); year-one equity from $2k of loan paydown is wiped out by about $9k of value loss. Plan a longer hold.
- Collier County population projected at +30% by 2050 — long-run rental-demand tailwind backs the buy-and-hold thesis.
- At projected returns (-3.0% appreciation + 8.0% rent growth), your $81k cash investment doubles in ~7 years — after that, you're playing with house money.
Negotiation context
- It's been on market 113 days — a 9% lower offer ($263k) is reasonable based on typical stale-listing flexibility.
- 4 sale attempts since 3y ago; this cycle's ask has dropped $20k (6%) from the opening price — seller is motivated, your offer sets the floor, not the list.
- Current owner paid $225k; 28% above their basis — modest negotiation headroom, anchor on the comps not their cost.
Risks & watch-outs
- Watch-outs: flood insurance adds $66/mo.
- Climate carrying-cost: major flood risk; severe wind risk, 99% chance of damaging wind over 30y; extreme-heat days projected 7→27/yr by 2055 (HVAC capex compounding) — expect insurance premiums to compound above CPI over the hold.
Questions for the listing agent
- It's been on market 113 days. Have you received any prior offers? Is the seller open to a 9% concession, seller financing, or rate buy-down credit?
- Built in 1974 — when were the roof, HVAC, electrical panel, plumbing, and water heater last replaced?
- What's the actual annual flood-insurance premium (NFIP or private), and is the property in a SFHA with mandatory coverage?
- What does the HOA fee cover, when was the last increase, and are there any pending special assessments or reserve-fund shortfalls?
- Any open or pending special assessments — roof, HVAC, plumbing, elevator, façade? What's the per-unit balance and payoff schedule, and is the seller paying it off at close or rolling it to the buyer?
- Why hasn't it sold? Are there any deal-killer items the seller is aware of (foundation, flood, title, zoning, code violations)?
- Is there a deadline driving the sale (1031 exchange, divorce, estate, relocation)? That informs how much negotiation room exists.
- Schools are B-rated — typically a magnet for longer-tenancy family renters. What's the average tenant stay here, and is there a school-zone premium baked into asking?
- This sits on a lake — are riparian / water-frontage rights deeded with the parcel? Any dock permits, shoreline easements, or HOA water-use restrictions?
- What's the documented flood / surge / shoreline-erosion history here (FEMA AND non-FEMA — e.g., storm surge, creek backup, septic-field saturation)?
- Any water-quality or seasonal algae-bloom issues that affect tenant satisfaction or short-term-rental demand?
- What's the average days-on-market for RENTAL listings here right now (not sales)? A rising rental-DOM trend means longer vacancies and softer asking-rent achievability than the comps imply.
- What's the recent tenant-quality profile in this submarket — average credit score on applications, eviction rate, late-payment / NSF rate, and stable-employment percentage? A property-management company in the area should have these aggregated.
- How much new apartment / multifamily construction is in the pipeline within 1–3 miles? Heavy new supply (>2% of stock underway) typically softens rents 12–24 months out; light construction supports rent growth.
Investment metrics
- 1% rule
- 1.58% ✓
- Cap rate
- 9.70%
- Cash-on-cash
- 12.18%
- DSCR
- 1.54
- GRM
- 5.3
CMA / ARV
No comps found within radius.
Projected returns pro-forma
-3.0% appreciation · 8.0% rent growth · sell at horizon
- IRR
- 7.6%
- Equity multiple
- 1.32×
- Total profit
- $25,902
- Equity at exit
- $43,091
- IRR
- 21.8%
- Equity multiple
- 3.43×
- Total profit
- $196,422
- Equity at exit
- $24,987
Cash invested: $80,920 (down + closing). Projections, not guarantees.
Landlord ↔ Tenant lean methodology
- Overall (STATE)
- 87 Strongly Landlord-Friendly
- State Florida
- 87 Strongly Landlord-Friendly · R+3
- County
- — inherits STATE
- City
- — inherits STATE
ZIP-level market 34103
- Rents YoY
- 14.6%
- Active inventory
- 480
- Price-to-rent
- 5.3×
Monthly cashflow live
- Estimated rent
- $4,556 medium interval (Pro) →
- Mortgage (P&I)
- −$1,516
- Tax from tax record
- −$242 /mo · $2,903/yr
- Insurance
- −$120
- Flood insurance flood zone
- −$66 /mo · $798/yr
- HOA
- −$900
- Vacancy / Maint / Mgmt
- −$957
- Net cashflow
- $755
Break-even live
Sensitivity live
| Price | -10% $918 | -5% $836 | +0% $755 | +5% $673 | +10% $591 |
|---|---|---|---|---|---|
| Rent | -10% $395 | -5% $575 | +0% $755 | +5% $935 | +10% $1,115 |
| Rate | -1.0pp $900 | -0.5pp $828 | base $755 | +0.5pp $680 | +1.0pp $604 |
UW: 25.0% down · 7.5% · 30yr · 1.5% tax · 5.0% vac · 8.0% maint · 8.0% mgmt
Financing live
Cash to close
- Down payment
- $72,250
- Closing costs
- $8,670
- Reserves months
- —
- Total cash needed
- —
Loan-product check · same deal, 3 products live
Conventional
25% down · 7.5% · 30yr
- Down + closing
- —
- Monthly P&I
- —
- Monthly cashflow
- —
- DSCR
- —
- Eligible?
- —
Personal DTI + credit; lowest rate.
DSCR
20% down · 8.5% · 30yr
- Down + closing
- —
- Monthly P&I
- —
- Monthly cashflow
- —
- DSCR
- —
- Eligible?
- —
No personal income docs; deal must DSCR.
Hard money
10% down · 12.0% · 12mo
- Down + closing
- —
- Monthly P&I
- —
- Monthly cashflow
- —
- DSCR
- —
- Eligible?
- —
Short-term bridge; refi at stabilization.
Rent comps 16 comps
| Address | Beds | Baths | Sqft | Rent | $/sqft | DOM | Units | Dist |
|---|---|---|---|---|---|---|---|---|
| 3030 Binnacle Dr #201 Naples, FL | 2.0 | 2.0 | 1092 | $5,000 | $4.58 | 24d | 1 | 0.04mi |
| 820 Ketch Dr #3 Naples, FL | 2.0 | 2.0 | 1100 | $5,500 | $5.00 | 24d | 1 | 0.13mi |
| 820 Ketch Dr #2 Naples, FL | 2.0 | 2.0 | 1100 | $5,700 | $5.18 | 24d | 1 | 0.13mi |
| 45 High Point Cir S #303 Naples, FL | 2.0 | 2.0 | 1015 | $5,500 | $5.42 | 24d | 1 | 0.46mi |
| 788 Park Shore Dr Naples, FL | 1.0–2.0 | 1.5–2.0 | 931 | $5,500 | $5.90 | 15d | 3 | 0.46mi |
| 333 Harbour Dr #211 Naples, FL | 2.0 | 2.0 | 975 | $5,500 | $5.64 | 15d | 1 | 0.54mi |
| 3200 Gulf Shore Blvd N #105 Naples, FL | 2.0 | 2.0 | 1116 | $8,500 | $7.62 | 24d | 1 | 0.69mi |
| 2170 Gulf Shore Blvd N Unit 41E Naples, FL | 1.0 | 1.0 | 682 | $6,000 | $8.80 | 24d | 1 | 0.94mi |
| 600 Neapolitan Way Naples, FL | 1.0–2.0 | 2.0 | 832 | $5,200 | $6.25 | 24d | 2 | 1.04mi |
| 1950 Gulf Shore Blvd N Naples, FL | 2.0 | 2.0 | 1060 | $7,250 | $6.84 | 24d | 2 | 1.13mi |
| 2011 Gulf Shore Blvd N #45 Naples, FL | 2.0 | 2.0 | 1100 | $8,500 | $7.73 | 24d | 1 | 1.18mi |
| 1910 Gulf Shore Blvd N Naples, FL | 2.0 | 2.0 | 1290 | $9,200 | $7.13 | 24d | 2 | 1.18mi |
| 4523 Fluvia Ave Naples, FL | 2.0 | 1.0 | 1050 | $5,500 | $5.24 | 24d | 1 | 1.31mi |
| 4525 Fluvia Ave Naples, FL | 2.0 | 1.0 | 1050 | $5,500 | $5.24 | 24d | 1 | 1.31mi |
| 1550 Gulf Shore Blvd N Unit E6 Naples, FL | 1.0 | 1.0 | 817 | $7,000 | $8.57 | 15d | 1 | 1.43mi |
| 1550 Gulf Shore Blvd N Unit E6 Naples, FL | 1.0 | 1.0 | 817 | $7,000 | $8.57 | 22d | 1 | 1.43mi |
HOA detail condo
- Monthly dues
- $900 · $10,800/yr
- Likely covers
- pool
- Assessments
- None detected in remarks — confirm with the listing agent.
Listing history 38 events
-
2026-06-21days on market $289,000 Active 113 DOM
-
2026-06-18days on market $289,000 Active 110 DOM
-
2026-06-17days on market $289,000 Active 109 DOM
-
2026-06-16days on market $289,000 Active 108 DOM
-
2026-06-15days on market $289,000 Active 107 DOM
-
2026-06-14days on market $289,000 Active 105 DOM
-
2026-06-10days on market $289,000 Active 102 DOM
-
2026-06-09days on market $289,000 Active 101 DOM
-
2026-06-08days on market $289,000 Active 100 DOM
-
2026-06-07days on market $289,000 Active 99 DOM
-
2026-06-03days on market $289,000 Active 95 DOM
-
2026-06-02days on market $289,000 Active 94 DOM
-
2026-06-01days on market $289,000 Active 93 DOM
-
2026-06-01price $289,000 Active 92 DOM
-
2026-05-31days on market $294,900 Active 92 DOM
-
2026-05-30days on market $294,900 Active 91 DOM
-
2026-04-03price $294,900
-
2026-03-16price $304,000
-
2026-02-28$309,000 Active
-
2025-06-26historical $4,600
-
2025-03-15price $4,600
-
2025-02-05price $4,100
-
2025-01-21price $4,400
-
2024-11-24$4,500
-
2024-11-19historical
-
2024-08-01historical $5,000
-
2024-07-24price $375,000
-
2024-07-16price $384,000
-
2024-05-23$5,000
-
2024-04-22price $389,000
-
2024-04-06price $395,000
-
2024-01-11price $445,000
-
2023-11-13price $464,000
-
2023-08-31$469,000 Active
-
2005-04-05soldstatus $225,000
-
2002-12-13soldstatus $112,900
-
2000-05-05soldstatus $87,900
-
1991-10-01soldstatus $68,500
ⓘ Source: listings_history table (triggers on properties + properties_extension) + one-shot
backfill from property_details.listing_events for pre-trigger history.
Tax reassessment forecast FL · Resets to sale price
- Current annual tax
- $2,903 · $242/mo
- Projected year-2 tax
- $2,903 · $242/mo
- Expected delta
- $0/yr ($0/mo · 0.0%)
ⓘ Screening estimate from a state-policy table — verify with the county assessor before closing.
Climate risk First Street
- Flood 7/10 Severe FEMA zone X (shaded) · 74% chance over 30 yrs
- Wildfire 1/10 Low
- Heat 10/10 Extreme 7 d/yr ≥107°F today · 27 d/yr by 30 yrs out
- Wind 10/10 Extreme 99% chance of damaging wind over 30 yrs
- Air quality 2/10 Low 2 unhealthy d/yr today · 2 by 30 yrs out
Nearby sold comps map
Loading sold comps map…
Walkable amenities ~0.75 mi
Loading nearby amenities…
Taxation est. · year 1
- Rental income
- $54,668
- − Mortgage interest
- −$16,188
- − Property taxes
- −$2,903
- − Insurance
- −$2,242
- − Repairs & maintenance
- −$4,373
- − Management
- −$4,373
- − HOA
- −$10,800
- − Depreciation
- −$8,407
- Taxable income
- $5,381
- Est. tax owed @ 24.0%
- −$1,291
- After-tax cash flow
- $7,765/yr
For passive investors: Depreciation is non-cash, so a rental often shows a tax loss while cash-flowing — sheltering income. Rental losses are passive: they offset passive income freely, and up to $25,000/yr can offset ordinary (W-2) income if you actively participate and your MAGI is under $100k (phasing out to $0 by $150k); unused losses carry forward. On sale, claimed depreciation is recaptured at up to 25%, and gains may owe capital-gains tax (a 1031 exchange can defer both). Figures are a year-1 estimate at your 24.0% rate — not tax advice; consult a CPA.
Schools (NCES district)
- District
- Collier
- NCES district ID
- 1200330
- Math proficiency
- 60% ▼ -4.00%
- Reading proficiency
- 56% ▼ -2.00%
- Median HH income
- $58,275
- Composite
- 50.23/100
- National rank
- #1892
- State rank
- #16 of 73 in FL
Livability — Naples
- Score
- 80/100
- State rank
- #126
- US rank
- #1903
Category grades
Schools grade is shown separately in the Schools card above.
Census & demographics
- Census place
- Naples, FL
- County
- Collier County · 396,295 people
- City population
- 344,941
- Metro
- Naples-Marco Island, FL
- Population (ZIP)
- 11,299
- Household income
- $116,875
- Rent vs Own
- Severe rent burden
- 311.0
Population outlook (Collier County) Hauer SSP2
- Today (2025)
- 420,858 people
- By 2030
- 450,054 · +6.9%
- By 2040
- 502,232 · +19.3%
- By 2050
- 544,932 · +29.5%
- By 2075
- 627,203 · +49.0%
- By 2100
- 659,015 · +56.6%
Race, ethnicity, and origin ACS 2023
- Neighborhood character
- Predominantly White (87%)
- Race & ethnicity
- White 87% Hispanic / Latino 10% Two or more races 8% Asian 1%
- Hispanic origin (detail)
- Common ancestry
- Romanian 4% Lithuanian 2% Portuguese 2%
- Foreign-born
- 13% · Canada
- Languages at home
- 87% English-only · Spanish 9% Other Indo-European 2% German/W. Germanic 1%
Political lean MEDSL · Collier
- 2024 margin
- Solid R (+33.1) · D 33.1% · R 66.2%
- 2008→2024 swing
- -10.6pp toward R · 2008: -22.5pp · 2024: -33.1pp
- All cycles
- 2024: R+33.1 2020: R+24.7 2016: R+26.0 2012: R+30.1 2008: R+22.5
Not yet ingested
- Civics
- —
Market trends
- HPI YoY
- ▼ -327.53%
- Current HPI
- 315.1396
- Rent YoY
- ▲ 14.55%
- Metro
- Naples-Marco Island, FL
- State GDP YoY
- ▲ 3.28%
- F500 in state
- 36
Industry mix (Fortune 500 HQ in FL)
| Industry | F500 HQs | Revenue |
|---|---|---|
| Industrial Technology | 2 | $29B |
|
||
| Insurance | 2 | $17B |
|
||
| Retail | 1 | $60B |
|
||
| Technology Distribution | 1 | $58B |
|
||
| Homebuilding | 1 | $35B |
|
||
| Technology Manufacturing | 1 | $35B |
|
||
Price history
+330.5% since first listed22 events — show timeline
- 2026-04-03 Price Changed $294,900 NAPLESMLS
- 2026-03-16 Price Changed $304,000 NAPLESMLS
- 2026-02-28 Listed $309,000 NAPLESMLS
- 2025-06-26 Rental Removed $4,600 NAPLESMLS
- 2025-03-15 Price Changed $4,600 NAPLESMLS
- 2025-02-05 Price Changed $4,100 NAPLESMLS
- 2025-01-21 Price Changed $4,400 NAPLESMLS
- 2024-11-24 Listed for Rent $4,500 NAPLESMLS
- 2024-11-19 Listing Removed — NAPLESMLS
- 2024-08-01 Rental Removed $5,000 NAPLESMLS
- 2024-07-24 Price Changed $375,000 NAPLESMLS
- 2024-07-16 Price Changed $384,000 NAPLESMLS
- 2024-05-23 Listed for Rent $5,000 NAPLESMLS
- 2024-04-22 Price Changed $389,000 NAPLESMLS
- 2024-04-06 Price Changed $395,000 NAPLESMLS
- 2024-01-11 Price Changed $445,000 NAPLESMLS
- 2023-11-13 Price Changed $464,000 NAPLESMLS
- 2023-08-31 Listed $469,000 NAPLESMLS
- 2005-04-05 Sold (Public Records) $225,000 Public Records
- 2002-12-13 Sold (Public Records) $112,900 Public Records
- 2000-05-05 Sold (Public Records) $87,900 Public Records
- 1991-10-01 Sold (Public Records) $68,500 Public Records
Property tax history
+5.8%/yrLatest (2025): $2,903 · +1.3% YoY. Source: county tax records.
Cash-flow waterfall
monthlySold comps — $/sqft
last 12 mo · ≤1 miLoading sold comps…