452 Carvel Bch · Riviera Beach, MD
Flood risk 1/10 · Minimal
- FEMA flood zone
- X (unshaded)
- Chance of flooding over 30 yrs
- 0.0%
- Est. flood insurance / yr
- $507 – $1,088
Fire risk 1/10 · Minimal
- Est. fire insurance / yr
- $755 – $1,403
Heat risk 8/10 · Major
- Hot days now (above 103°F)
- 7 days/yr
- Hot days in 30 yrs
- 14 days/yr
Wind risk 6/10 · Moderate
- Chance of severe wind over 30 yrs
- 69.0%
Air-quality risk 5/10 · Moderate
- Unhealthy air days now
- 6 days/yr
- Unhealthy air days in 30 yrs
- 8 days/yr
Risk factors via First Street. Map © Google.
Why this score? — see what drove the F grade
The composite is a weighted blend of 9 inputs, each scored 0–100. Each bar is that input's sub-score; the figure is the points it added to the 100-point composite (weight × sub-score).
- Appreciation +8.9/10.0
- Schools +5.0/10.0
- Cash flow +4.4/30.0
- Livability +3.2/5.0
- Rent growth +2.5/5.0
- Condition / age +2.5/5.0
- 1% rule +0.0/10.0
- DSCR +0.0/10.0
- ARV discount +0.0/15.0
$675,000
🖨 Deal sheet (PDF) 📄 Offer letter ✓ Due diligence
Listing remarks
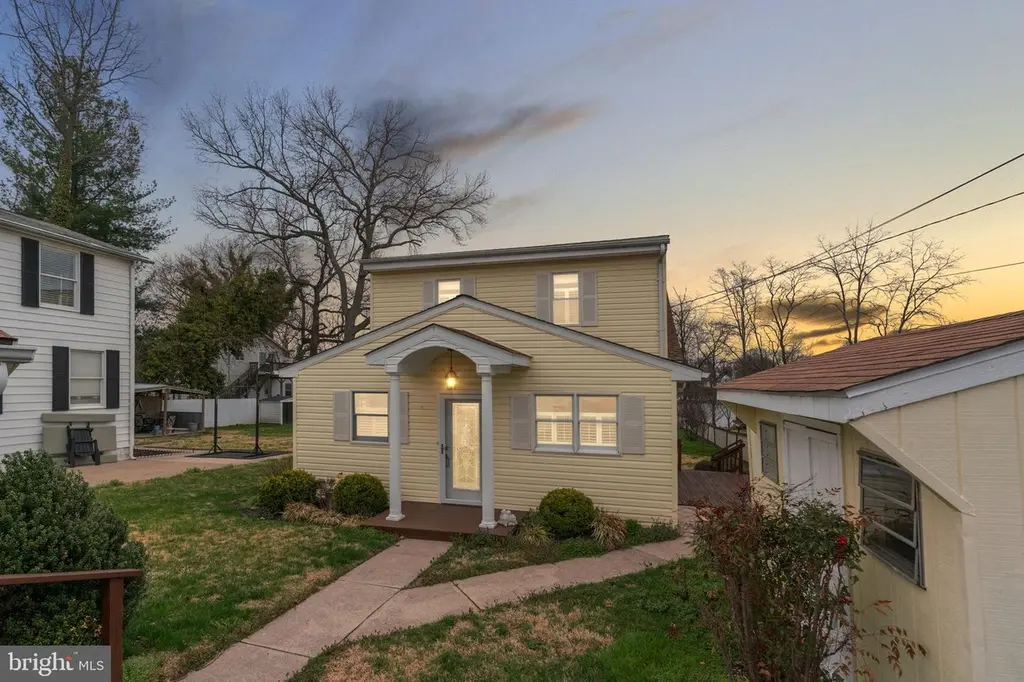
Fantastic opportunity to own this beautiful waterfront home in the highly sought after Carvel Beach area! Opportunities like this don't come along often so make sure you get out to see this one before it is gone! Have a boat or thinking about getting one? Wait until you see this private deep water pier with multiple slips & an electric lift! Three sheds (with electric) on the property makes it easy to store all of your fun water toys & accessories plus a workshop area in the largest shed! Home boasts an open floorplan that allows for tons of natural light and AMAZING views of the water from several rooms!!! The expansive upstairs master bedroom with vaulted ceilings has a wall o
Key facts
- 0.23 acre lot
- 6 parking spots
- Built 1950
Property features AI
Finance
- Other: Finished above-grade living area reported (Assessor); Private deeded dock with treated lumber pier and electric hoist/lift
Exterior
- Parking: Paved driveway with six off-street parking spaces (total 6)
- Utilities: Public water; Public sewer
- Home design: Detached property; Built/major remodel effective 1989; Fee simple ownership; Property in very good condition
- Construction: Vinyl siding; Other foundation; Shed on property
- Exterior features: Porches and screened patio(s); Boat storage; Stone retaining walls; Landscaping; Bulkheaded rear yard; Private water view and waterfront on a cove; Private dock site
Interior
- Kitchen: Dishwasher; Electric oven/range; Refrigerator; Stainless steel appliances; Kitchen island; Exhaust fan
- Bedrooms: One main-level bedroom; Three bedrooms on the upper level
- Bathrooms: Two full bathrooms (one on main level, one on upper level)
- Heating & cooling: Forced air heating (oil fuel); Central air conditioning; Ceiling fans
- Interior features: Open and traditional floor plan with formal dining area and dining area; Kitchen island; Walk-in closet(s); Ceiling fan(s); Chair railings and crown moldings; Window treatments; Bathroom with walk-in shower and tub/shower
- Laundry & utility: Front-loading washer and dryer; Washer/dryer stacked; Electric water heater
Neighborhood map
What this means for you Summary
Snapshot
- This is a 4-bed/1.5-bath single-family listed at $675k.
Deal economics
- At list price, monthly cash flow is $-2k ($-21k/yr) — negative.
- To cash-flow at today's rent, offer at most $361k (46.5% below list).
- To meet the 1% rule (rent ≥ 1% of price), the offer needs to be $301k (55.4% below list).
- Recommended offer: $301k (55.4% below list) — sets the bar for 1% rule.
- Cap rate 3.1% vs local median 5.7% in Riviera Beach — below-typical yield; the buyer is paying a premium for something (appreciation thesis, condition, location) that the cap rate doesn't capture.
Location & tenants
- Location reads 64/100 on livability (#280 in MD) — a middle-class / working-renter tenant base. Strengths: employment A+, housing A+; Watch: crime D, cost of living D, amenities F.
- Zoned schools: Monarch Global Academy Pcs Laurel Campus (math 13% / reading 28%, grade F, #341 of 860 statewide, top 40%, 830 students, 53% FRL); Northeast Middle (math 6% / reading 32%, grade F, #155 of 225 statewide, top 70%, 882 students, 49% FRL); Northeast High (math 24% / reading 57%, grade F, #130 of 222 statewide, top 58%, 1,390 students, 44% FRL).
- Market conditions: 45 active listings in the ZIP; 11 comparable units currently listed for rent nearby; rentals leasing fast (median 7d on market — plan ~1-2 weeks tenant-placement turnaround); 1,303 units permitted in Anne Arundel County in 2024 (299 in 5+ unit buildings).
Forward outlook
- In year one you build about $57k of equity ($5k loan paydown + $52k appreciation (7.8% local appreciation)).
- Anne Arundel County population projected at +17% by 2050 — long-run rental-demand tailwind backs the buy-and-hold thesis.
- By year 2, paydown + projected appreciation supports a ~$91k cash-out refi (75% LTV) — recoverable capital for the next deal without selling this one.
Negotiation context
- It's been on market 31 days — a 3% lower offer ($655k) is reasonable based on typical stale-listing flexibility.
- 3 sale attempts since 29y ago with the ask held roughly flat each time — persistent listings suggest the price (not the market) is what's stuck; bring a comps-based counter.
- Current owner paid $235k; list at $675k implies a 187% gain — meaningful room to come down on a strong offer.
Risks & watch-outs
- Watch-outs: built in 1950 — expect roof / HVAC / electrical / plumbing capex.
- Climate carrying-cost: major wind risk, 69% chance of damaging wind over 30y; extreme-heat days projected 7→14/yr by 2055 (HVAC capex compounding) — expect insurance premiums to compound above CPI over the hold.
Questions for the listing agent
- What do current leases actually rent for vs. the listed asking? Can we see a recent rent roll and the last 12 months of T-12 income?
- It's been on market 31 days. Have you received any prior offers? Is the seller open to a 55% concession, seller financing, or rate buy-down credit?
- Built in 1950 — when were the roof, HVAC, electrical panel, plumbing, and water heater last replaced?
- Is there a deadline driving the sale (1031 exchange, divorce, estate, relocation)? That informs how much negotiation room exists.
- Schools are D-rated, which usually means shorter tenancies and higher turnover. Who's the typical renter profile here, and what's been the actual vacancy rate?
- Crime grade is D in this area — have there been break-ins, vandalism, or insurance claims at this property in the last 3 years? What carrier currently insures it and at what premium?
- The area grade is low — what's the realistic commute time and amenity access for the typical tenant pool here? Any planned neighborhood developments (good or bad) we should know about?
- What's the average days-on-market for RENTAL listings here right now (not sales)? A rising rental-DOM trend means longer vacancies and softer asking-rent achievability than the comps imply.
- What's the recent tenant-quality profile in this submarket — average credit score on applications, eviction rate, late-payment / NSF rate, and stable-employment percentage? A property-management company in the area should have these aggregated.
- How much new for-sale + rental construction is in the pipeline within 1–3 miles? Heavy new supply typically softens prices + rents 12–24 months out; constrained supply supports both.
Investment metrics
- 1% rule
- 0.45% ✗
- Cap rate
- 3.14%
- Cash-on-cash
- -11.28%
- DSCR
- 0.50
- GRM
- 18.7
CMA / ARV
- ARV (on-the-fly)
- $553,344
- Comps found
- 12
Show comp detail 12 sales within ~0.75 mi
| Address | Dist | Beds/Ba | Sqft | Sold | Price | $/sf | Match |
|---|---|---|---|---|---|---|---|
| 452 Carvel Bch | 0.00mi | 4/2.0 | 2,112 (0%) | 1mo | $675,000 | $320 | 97 |
| 7810 Shelbourne | 0.40mi | 4/2.5 | 2,088 (-1%) | 8mo | $620,000 | $297 | 69 |
| 129 Carvel Bch | 0.26mi | 3/2.5 (-1) | 1,968 (-7%) | 4mo | $710,000 | $361 | 64 |
| 232 Matfield Ct | 0.22mi | 4/3.5 | 2,233 (+6%) | 11mo | $585,000 | $262 | 63 |
| 148 Carvel Beach Rd | 0.21mi | 4/3.0 | 2,250 (+6%) | 16mo | $416,000 | $185 | 60 |
| 204 Matfield Ct | 0.26mi | 4/3.5 | 2,254 (+7%) | 17mo | $557,500 | $247 | 54 |
| 981 Nabbs Creek Rd | 0.40mi | 4/3.0 | 2,200 (+4%) | 17mo | $490,000 | $223 | 54 |
| 213 Greenland Beach Rd | 0.19mi | 4/3.0 | 2,392 (+13%) | 11mo | $425,000 | $178 | 54 |
| Lot 0 Nabbs Crk | 0.34mi | 4/3.5 | 2,000 (-5%) | 20mo | $575,850 | $288 | 51 |
| 7655 Turnbrook Dr | 0.45mi | 3/2.0 (-1) | 1,830 (-13%) | 5mo | $310,000 | $169 | 46 |
| 8413 Geneva Rd | 0.69mi | 3/2.0 (-1) | 1,864 (-12%) | 16mo | $440,000 | $236 | 28 |
| 8426 Park Rd | 0.75mi | 3/3.0 (-1) | 2,381 (+13%) | 9mo | $624,000 | $262 | 25 |
Match score weights: distance 35% · size 25% · config 20% · recency 20%. Top-matched comps best support the ARV.
Projected returns pro-forma
7.75% appreciation · 3.0% rent growth · sell at horizon
- IRR
- 10.9%
- Equity multiple
- 1.81×
- Total profit
- $153,926
- Equity at exit
- $501,370
- IRR
- 11.8%
- Equity multiple
- 3.80×
- Total profit
- $529,851
- Equity at exit
- $984,491
Cash invested: $189,000 (down + closing). Projections, not guarantees.
Landlord ↔ Tenant lean methodology
- Overall (STATE)
- 27 Tenant-Leaning
- State Maryland
- 27 Tenant-Leaning · D+14
- County
- — inherits STATE
- City
- — inherits STATE
ZIP-level market 21226
- Home prices YoY
- 2.5%
- Active inventory
- 45
- Price-to-rent
- 18.7×
Monthly cashflow live
- Estimated rent
- $3,007 high interval (Pro) →
- Mortgage (P&I)
- −$3,540
- Tax from tax record
- −$331 /mo · $3,967/yr
- Insurance
- −$281
- HOA
- −$0
- Vacancy / Maint / Mgmt
- −$632
- Net cashflow
- $-1,776
Break-even live
Sensitivity live
| Price | -10% $-1,394 | -5% $-1,585 | +0% $-1,776 | +5% $-1,967 | +10% $-2,158 |
|---|---|---|---|---|---|
| Rent | -10% $-2,013 | -5% $-1,895 | +0% $-1,776 | +5% $-1,657 | +10% $-1,538 |
| Rate | -1.0pp $-1,436 | -0.5pp $-1,604 | base $-1,776 | +0.5pp $-1,951 | +1.0pp $-2,129 |
UW: 25.0% down · 7.5% · 30yr · 1.5% tax · 5.0% vac · 8.0% maint · 8.0% mgmt
Financing live
Cash to close
- Down payment
- $168,750
- Closing costs
- $20,250
- Reserves months
- —
- Total cash needed
- —
Loan-product check · same deal, 3 products live
Conventional
25% down · 7.5% · 30yr
- Down + closing
- —
- Monthly P&I
- —
- Monthly cashflow
- —
- DSCR
- —
- Eligible?
- —
Personal DTI + credit; lowest rate.
DSCR
20% down · 8.5% · 30yr
- Down + closing
- —
- Monthly P&I
- —
- Monthly cashflow
- —
- DSCR
- —
- Eligible?
- —
No personal income docs; deal must DSCR.
Hard money
10% down · 12.0% · 12mo
- Down + closing
- —
- Monthly P&I
- —
- Monthly cashflow
- —
- DSCR
- —
- Eligible?
- —
Short-term bridge; refi at stabilization.
Rent comps 11 comps
| Address | Beds | Baths | Sqft | Rent | $/sqft | DOM | Units | Dist |
|---|---|---|---|---|---|---|---|---|
| 950 Nabbs Creek Rd Glen Burnie, MD | 4.0 | 3.5 | 1752 | $6,500 | $3.71 | 26d | 1 | 0.36mi |
| 959 Mount Desert Harbour Pasadena, MD | 3.0 | 1.5 | 1400 | $2,600 | $1.86 | 26d | 1 | 0.82mi |
| 1346 Riverwood Way Stoney Beach, MD | 3.0 | 3.0 | 1500 | $2,700 | $1.80 | 0d | 1 | 0.97mi |
| 1346 Riverwood Way Stoney Beach, MD | 3.0 | 2.5 | 1500 | $2,700 | $1.80 | 4d | 1 | 0.97mi |
| 1346 Riverwood Way Stoney Beach, MD | 3.0 | 2.5 | 1500 | $2,700 | $1.80 | 5d | 1 | 0.97mi |
| 119 Cloverhill Rd Pasadena, MD | 3.0 | 2.5 | 2094 | $2,999 | $1.43 | 45d | 1 | 1.02mi |
| 8638 Gambier Harbour Pasadena, MD | 3.0 | 1.5 | 1400 | $2,700 | $1.93 | 0d | 1 | 1.04mi |
| 8561 Skipjack Pl Pasadena, MD | 3.0 | 2.5 | 1670 | $2,900 | $1.74 | 5d | 1 | 1.23mi |
| 8561 Skipjack Pl Pasadena, MD | 3.0 | 2.5 | 1670 | $2,900 | $1.74 | 7d | 1 | 1.23mi |
| 202 Glen Rd Pasadena, MD | 5.0 | 3.0 | 1510 | $4,999 | $3.31 | 45d | 1 | 1.24mi |
| 7257 Stallings Dr Glen Burnie, MD | 3.0 | 2.5 | 1950 | $3,300 | $1.69 | 45d | 1 | 1.36mi |
Listing history 12 events
-
2026-05-07status Pending
-
2026-04-29historical
-
2026-03-29$675,000 Active
-
2026-03-29historical $675,000
-
1997-11-10soldstatus $235,000
-
1997-11-10soldstatus $235,000
-
1997-10-15soldstatus $235,000
-
1997-08-28historical
-
1997-05-16historical
-
1997-05-12$249,900
-
1997-02-24
-
1991-08-28soldstatus $245,900
ⓘ Source: listings_history table (triggers on properties + properties_extension) + one-shot
backfill from property_details.listing_events for pre-trigger history.
Tax reassessment forecast MD · Partial reset (capped growth)
- Current annual tax
- $3,967 · $331/mo
- Projected year-2 tax
- $5,662 · $472/mo
- Expected delta
- +$1,695/yr (+$141/mo · 42.7%)
ⓘ Screening estimate from a state-policy table — verify with the county assessor before closing.
Climate risk First Street
- Flood 1/10 Low FEMA zone X (unshaded) · 0% chance over 30 yrs
- Wildfire 1/10 Low
- Heat 8/10 Severe 7 d/yr ≥103°F today · 14 d/yr by 30 yrs out
- Wind 6/10 Major 69% chance of damaging wind over 30 yrs
- Air quality 5/10 Major 6 unhealthy d/yr today · 8 by 30 yrs out
Nearby sold comps map
Loading sold comps map…
Walkable amenities ~0.75 mi
Loading nearby amenities…
Taxation est. · year 1
- Rental income
- $36,088
- − Mortgage interest
- −$37,810
- − Property taxes
- −$3,967
- − Insurance
- −$3,375
- − Repairs & maintenance
- −$2,887
- − Management
- −$2,887
- − Depreciation
- −$19,636
- Taxable loss
- −$34,476
- Est. tax savings @ 24.0%
- +$8,274
- After-tax cash flow
- $-13,036/yr
For passive investors: Depreciation is non-cash, so a rental often shows a tax loss while cash-flowing — sheltering income. Rental losses are passive: they offset passive income freely, and up to $25,000/yr can offset ordinary (W-2) income if you actively participate and your MAGI is under $100k (phasing out to $0 by $150k); unused losses carry forward. On sale, claimed depreciation is recaptured at up to 25%, and gains may owe capital-gains tax (a 1031 exchange can defer both). Figures are a year-1 estimate at your 24.0% rate — not tax advice; consult a CPA.
Schools (NCES district)
No district data.
Livability — Riviera Beach
- Score
- 64/100
- State rank
- #280
- US rank
- #14429
Category grades
Schools grade is shown separately in the Schools card above.
Census & demographics
- Census place
- Riviera Beach, MD
- Population (ZIP)
- 6,593
Population outlook (Anne Arundel County) Hauer SSP2
- Today (2025)
- 617,384 people
- By 2030
- 642,094 · +4.0%
- By 2040
- 686,621 · +11.2%
- By 2050
- 723,031 · +17.1%
- By 2075
- 809,346 · +31.1%
- By 2100
- 837,658 · +35.7%
Race, ethnicity, and origin ACS 2023
- Neighborhood character
- Diverse neighborhood (Simpson 0.61)
- Race & ethnicity
- White 59% Black 18% Two or more races 13% Hispanic / Latino 8% Asian 4%
- Hispanic origin (detail)
- Mexican 4% Puerto Rican 3%
- Common ancestry
- Slovak 7% Romanian 2% Scotch-Irish 1%
- Foreign-born
- 7% · Canada, Jamaica
- Languages at home
- 91% English-only · Spanish 7% Tagalog/Filipino 1% Other Indo-European 1%
Political lean MEDSL · Anne Arundel
- 2024 margin
- D (+13.9) · D 55.7% · R 41.7% · Other 2.6%
- 2008→2024 swing
- +15.7pp toward D · 2008: -1.8pp · 2024: 13.9pp
- All cycles
- 2024: D+13.9 2020: D+14.5 2016: D+0.7 2012: R+0.9 2008: R+1.8
Not yet ingested
- Civics
- —
Market trends
- HPI YoY
- ▲ 7.75%
- Current HPI
- 318.79
- Rent YoY
- —
- Metro
- —
- State GDP YoY
- ▲ 2.97%
- F500 in state
- 12
Industry mix (Fortune 500 HQ in MD)
| Industry | F500 HQs | Revenue |
|---|---|---|
| Aerospace / Defense | 1 | $71B |
|
||
| Utilities | 1 | $25B |
|
||
| Hotels | 1 | $24B |
|
||
| Consumer Goods | 1 | $7B |
|
||
| Real Estate | 1 | $6B |
|
||
| Chemicals | 1 | $2B |
|
||
Price history
+174.5% since first listed12 events — show timeline
- 2026-05-07 Pending — BRIGHT MLS
- 2026-04-29 Listing Removed — BRIGHT MLS
- 2026-03-29 Listed $675,000 BRIGHT MLS
- 2026-03-29 Coming Soon $675,000 BRIGHT MLS
- 1997-11-10 Sold (Public Records) $235,000 Public Records
- 1997-11-10 Sold (Public Records) $235,000 Public Records
- 1997-10-15 Sold (MLS) $235,000 MRIS
- 1997-08-28 Delisted — MRIS
- 1997-05-16 Delisted — MRIS
- 1997-05-12 Listed $249,900 MRIS
- 1997-02-24 Listed — MRIS
- 1991-08-28 Sold (Public Records) $245,900 Public Records
Property tax history
+3.7%/yrLatest (2025): $3,967 · +1.8% YoY. Source: county tax records.
Cash-flow waterfall
monthlySold comps — $/sqft
last 12 mo · ≤1 miLoading sold comps…