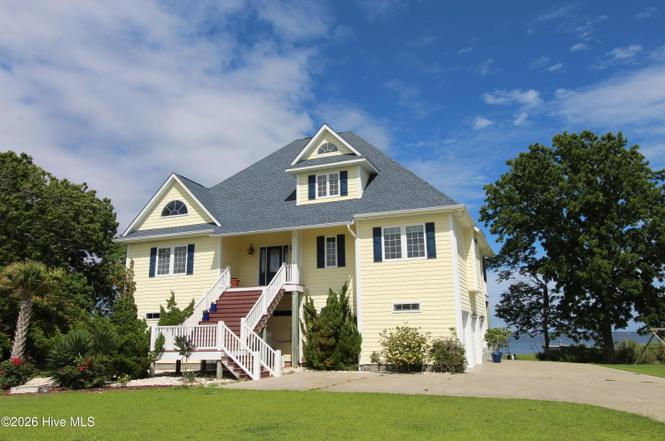
2944 Mill Creek Rd · Morehead City, NC
Flood risk 8/10 · Major
- FEMA flood zone
- X (shaded)
- Chance of flooding over 30 yrs
- 0.99%
- Est. flood insurance / yr
- $507 – $1,088
Fire risk 5/10 · Moderate
- Est. fire insurance / yr
- $906 – $1,684
Heat risk 9/10 · Severe
- Hot days now (above 103°F)
- 7 days/yr
- Hot days in 30 yrs
- 22 days/yr
Wind risk 9/10 · Severe
- Chance of severe wind over 30 yrs
- 99.0%
Air-quality risk 1/10 · Minimal
- Unhealthy air days now
- 0 days/yr
- Unhealthy air days in 30 yrs
- 0 days/yr
Risk factors via First Street. Map © Google.
Why this score? — see what drove the B grade
The composite is a weighted blend of 9 inputs, each scored 0–100. Each bar is that input's sub-score; the figure is the points it added to the 100-point composite (weight × sub-score).
- Cash flow +30.0/30.0
- 1% rule +10.0/10.0
- DSCR +10.0/10.0
- ARV discount +7.5/15.0
- Schools +5.1/10.0
- Livability +3.2/5.0
- Rent growth +2.5/5.0
- Condition / age +2.5/5.0
- Appreciation +0.0/10.0
$799,000
🖨 Deal sheet 📄 Offer letter ✓ Due diligence
Listing remarks
Enjoy Coastal North Carolina waterfront living at its finest. This custom-built 2009 home offers over 3,700 square feet of thoughtfully designed living space with sweeping waterfront views. The main level showcases a stunning great room with a dramatic 21-foot ceiling, built-ins, gas fireplace, and white oak flooring, flowing into the dining area framed by floor to ceiling windows that take advantage of the waterfront views. The well-appointed kitchen is designed for both everyday living and entertaining, with granite countertops, custom cabinetry, a large island, Dacor counter-depth refrigerator, Dacor 6-burner gas cooktop, double ovens, stainless steel range hood, pot filler, beverage coo
Key facts
- 0.53 acre lot
- 3 garage spots
- Built 2009
Property features AI
Finance
- Other: Pets allowed
- Financial info: Tax amount not included per instructions
- HOA & community: Homeowners association with annual fee (approximately $150/year); Community street lights
Exterior
- Parking: 3 total parking spaces; 3-car attached garage; Garage faces side; Concrete driveway/parking; Garage door opener
- Security: Generator for backup power
- Utilities: Well and public water available; Septic tank sewer; Generator (electric); Cable available; Underground utilities
- Home design: Single-family residence; Residential property; Three or more levels (3 stories total); Entry on level 2; On waterfront with creek and waterfront access; River frontage; Level lot with wetlands; Irregular lot shape; Paved road access (city street and state road)
- Construction: Vinyl siding and frame construction; Slab foundation; Built year not specified
- Exterior features: Outdoor shower; Private dock; Balcony; Covered deck; No fencing indicated; Shingle roof
Interior
- Kitchen: Gas cooktop; Double oven; Microwave; Dishwasher; Refrigerator; Water softener
- Bedrooms: Bedrooms count not specified
- Flooring: Tile; Wood
- Bathrooms: 3 full bathrooms; Accessible full bath
- Heating & cooling: Heat pump heating (electric); Central air; Zoned cooling
- Interior features: Walk-in closets; Vaulted and high ceilings; Bookcases; Kitchen island; Ceiling fans; Pantry; Wet bar; Shutters and window coverings; Insulated windows; Gas-log fireplace
- Laundry & utility: Washer; Washer hookup; Dedicated laundry room
Neighborhood map
What this means for you Summary
Snapshot
- This is a 3-bed/3.0-bath other listed at $799k.
Deal economics
- At list price, monthly cash flow is $5k ($61k/yr) — positive.
- The deal already cash-flows at list — no discount required.
- Meets the 1% rule at list price ($12k rent vs $799k).
- Recommended offer: $703k (12.0% below list) — sets the bar for market timing.
- Cap rate 14.0% vs local median 2.0% in Morehead City — top-decile yield for the area; either an underpriced asset or a hidden risk that comps aren't pricing in. Stress-test before assuming the spread holds.
Location & tenants
- Location reads 63/100 on livability (#412 in NC) — a middle-class / working-renter tenant base. Strengths: cost of living A-, housing B; Watch: employment D+, crime D-, amenities F.
- Carteret County Public Schools (rural): math 59% / reading 61% proficiency, ranked #31 of 178 in NC (top 17%) — acceptable for families but not a draw, mixed tenant base, ~2y average lease.
- Zoned schools: Newport Elementary (math 48% / reading 45%, grade D-, #542 of 1,410 statewide, top 39%, 645 students, 100% FRL); Newport Middle (math 39% / reading 56%, grade C-, #140 of 475 statewide, top 30%, 378 students, 98% FRL); West Carteret High (math 82% / reading 71%, grade A-, #89 of 535 statewide, top 16%, 1,146 students, 40% FRL) — zoned schools average 79% FRL vs 39% district-wide (40 pts higher); higher-poverty schools than district average — tighter screening recommended.
- Market conditions: 216 active listings in the ZIP; 935 units permitted in Carteret County in 2024 (360 in 5+ unit buildings).
Forward outlook
- Local home prices are declining (-3.0%/yr); year-one equity from $6k of loan paydown is wiped out by about $24k of value loss. Plan a longer hold.
- Carteret County population projected at +9% by 2050 — modest demand growth; plan on rents tracking national, not racing it.
- At projected returns (-3.0% appreciation + 3.0% rent growth), your $224k cash investment doubles in ~5 years — after that, you're playing with house money.
Negotiation context
- It's been on market 153 days — a 12% lower offer ($703k) is reasonable based on typical stale-listing flexibility.
- 6 sale attempts since 21y ago; this cycle's ask has dropped $190k (19%) from the opening price — seller is motivated, your offer sets the floor, not the list.
- Current owner paid $175k; list at $799k implies a 357% gain — meaningful room to come down on a strong offer.
Risks & watch-outs
- Watch-outs: flood insurance adds $66/mo.
- Climate carrying-cost: severe flood risk; severe wind risk, 99% chance of damaging wind over 30y; moderate wildfire risk; extreme-heat days projected 7→22/yr by 2055 (HVAC capex compounding) — expect insurance premiums to compound above CPI over the hold.
Questions for the listing agent
- It's been on market 153 days. Have you received any prior offers? Is the seller open to a 12% concession, seller financing, or rate buy-down credit?
- What's the actual annual flood-insurance premium (NFIP or private), and is the property in a SFHA with mandatory coverage?
- What does the HOA fee cover, when was the last increase, and are there any pending special assessments or reserve-fund shortfalls?
- Why hasn't it sold? Are there any deal-killer items the seller is aware of (foundation, flood, title, zoning, code violations)?
- Is there a deadline driving the sale (1031 exchange, divorce, estate, relocation)? That informs how much negotiation room exists.
- Crime grade is D in this area — have there been break-ins, vandalism, or insurance claims at this property in the last 3 years? What carrier currently insures it and at what premium?
- What's the average days-on-market for RENTAL listings here right now (not sales)? A rising rental-DOM trend means longer vacancies and softer asking-rent achievability than the comps imply.
- What's the recent tenant-quality profile in this submarket — average credit score on applications, eviction rate, late-payment / NSF rate, and stable-employment percentage? A property-management company in the area should have these aggregated.
- How much new for-sale + rental construction is in the pipeline within 1–3 miles? Heavy new supply typically softens prices + rents 12–24 months out; constrained supply supports both.
Investment metrics
- 1% rule
- 1.56% ✓
- Cap rate
- 13.98%
- Cash-on-cash
- 27.45%
- DSCR
- 2.22
- GRM
- 5.3
CMA / ARV
No comps found within radius.
Projected returns pro-forma
-3.0% appreciation · 3.0% rent growth · sell at horizon
- IRR
- 21.0%
- Equity multiple
- 1.86×
- Total profit
- $191,994
- Equity at exit
- $119,133
- IRR
- 29.2%
- Equity multiple
- 3.59×
- Total profit
- $580,450
- Equity at exit
- $69,083
Cash invested: $223,720 (down + closing). Projections, not guarantees.
Landlord ↔ Tenant lean methodology
- Overall (STATE)
- 85 Strongly Landlord-Friendly
- State North Carolina
- 85 Strongly Landlord-Friendly · R+3
- County
- — inherits STATE
- City
- — inherits STATE
ZIP-level market 28570
- Home prices YoY
- -16.2%
- Active inventory
- 216
- Price-to-rent
- 5.3×
Monthly cashflow live
- Estimated rent
- $12,495 medium interval (Pro) →
- Mortgage (P&I)
- −$4,190
- Tax from tax record
- −$217 /mo · $2,606/yr
- Insurance
- −$333
- Flood insurance flood zone
- −$66 /mo · $798/yr
- HOA
- −$13
- Vacancy / Maint / Mgmt
- −$2,624
- Net cashflow
- $5,051
Break-even live
UW: 25.0% down · 7.5% · 30yr · 1.5% tax · 5.0% vac · 8.0% maint · 8.0% mgmt
Financing live
Cash to close
- Down payment
- $199,750
- Closing costs
- $23,970
- Reserves months
- —
- Total cash needed
- —
Loan-product check · same deal, 3 products live
Conventional
25% down · 7.5% · 30yr
- Down + closing
- —
- Monthly P&I
- —
- Monthly cashflow
- —
- DSCR
- —
- Eligible?
- —
Personal DTI + credit; lowest rate.
DSCR
20% down · 8.5% · 30yr
- Down + closing
- —
- Monthly P&I
- —
- Monthly cashflow
- —
- DSCR
- —
- Eligible?
- —
No personal income docs; deal must DSCR.
Hard money
10% down · 12.0% · 12mo
- Down + closing
- —
- Monthly P&I
- —
- Monthly cashflow
- —
- DSCR
- —
- Eligible?
- —
Short-term bridge; refi at stabilization.
HOA detail
- Monthly dues
- $13 · $156/yr
- Likely covers
- watergas
Listing history 43 events
-
2026-06-19days on market $799,000 Active 153 DOM
-
2026-06-18days on market $799,000 Active 152 DOM
-
2026-06-17days on market $799,000 Active 151 DOM
-
2026-06-16days on market $799,000 Active 150 DOM
-
2026-06-16price $799,000 Active 149 DOM
-
2026-06-15days on market $828,000 Active 149 DOM
-
2026-06-14days on market $828,000 Active 147 DOM
-
2026-06-12days on market $828,000 Active 146 DOM
-
2026-06-09days on market $828,000 Active 143 DOM
-
2026-06-08days on market $828,000 Active 142 DOM
-
2026-06-07days on market $828,000 Active 141 DOM
-
2026-06-05days on market $828,000 Active 138 DOM
-
2026-06-03days on market $828,000 Active 137 DOM
-
2026-06-02days on market $828,000 Active 136 DOM
-
2026-06-01days on market $828,000 Active 135 DOM
-
2026-05-31days on market $828,000 Active 134 DOM
-
2026-05-30days on market $828,000 Active 133 DOM
-
2026-05-21price $828,000
-
2026-04-15price $835,900
-
2026-03-27price $848,800
-
2026-03-14price $879,000
-
2026-03-02price $928,900
-
2026-01-17$989,000 Active
-
2025-11-15historical
-
2025-10-29price $989,000
-
2025-09-25price $999,000
-
2025-09-05$969,000 Active
-
2025-07-10historical
-
2025-06-27price $899,000
-
2025-05-30price $929,000
-
2025-05-16price $949,000
-
2025-03-18price $999,990
-
2025-02-22price $1,075,000
-
2024-11-15price $1,175,000
-
2024-09-06$1,250,000 Active
-
2022-11-14historical
-
2022-10-25price $860,000
-
2022-10-06$874,500 Active
-
2008-09-12soldstatus $175,000
-
2008-09-12soldstatus $175,000
-
2008-05-01$185,000
-
2005-08-16soldstatus $162,750
-
2005-04-29$169,500
ⓘ Source: listings_history table (triggers on properties + properties_extension) + one-shot
backfill from property_details.listing_events for pre-trigger history.
Tax reassessment forecast NC · Resets to sale price
- Current annual tax
- $2,606 · $217/mo
- Projected year-2 tax
- $6,552 · $546/mo
- Expected delta
- +$3,946/yr (+$329/mo · 151.4%)
ⓘ Screening estimate from a state-policy table — verify with the county assessor before closing.
Climate risk First Street
- Flood 8/10 Severe FEMA zone X (shaded) · 99% chance over 30 yrs
- Wildfire 5/10 Major
- Heat 9/10 Extreme 7 d/yr ≥103°F today · 22 d/yr by 30 yrs out
- Wind 9/10 Extreme 99% chance of damaging wind over 30 yrs
- Air quality 1/10 Low 0 unhealthy d/yr today · 0 by 30 yrs out
Nearby sold comps map
Loading sold comps map…
Walkable amenities ~0.75 mi
Loading nearby amenities…
Taxation est. · year 1
- Rental income
- $149,934
- − Mortgage interest
- −$44,756
- − Property taxes
- −$2,606
- − Insurance
- −$4,792
- − Repairs & maintenance
- −$11,995
- − Management
- −$11,995
- − HOA
- −$156
- − Depreciation
- −$23,244
- Taxable income
- $50,391
- Est. tax owed @ 24.0%
- −$12,094
- After-tax cash flow
- $48,520/yr
For passive investors: Depreciation is non-cash, so a rental often shows a tax loss while cash-flowing — sheltering income. Rental losses are passive: they offset passive income freely, and up to $25,000/yr can offset ordinary (W-2) income if you actively participate and your MAGI is under $100k (phasing out to $0 by $150k); unused losses carry forward. On sale, claimed depreciation is recaptured at up to 25%, and gains may owe capital-gains tax (a 1031 exchange can defer both). Figures are a year-1 estimate at your 24.0% rate — not tax advice; consult a CPA.
Schools (NCES district)
- District
- Carteret County Public Schools
- NCES district ID
- 3700630
- Math proficiency
- 59% ▲ 5.00%
- Reading proficiency
- 61% ▲ 2.00%
- Median HH income
- $48,330
- Composite
- 50.92/100
- National rank
- #1786
- State rank
- #31 of 178 in NC
Livability — Morehead City
- Score
- 63/100
- State rank
- #412
- US rank
- #15497
Category grades
Schools grade is shown separately in the Schools card above.
Census & demographics
- County
- Carteret County · 52,389 people
- City population
- 15,253
- Metro
- Morehead City, NC
- Population (ZIP)
- 22,197
- Household income
- $70,229
- Rent vs Own
- Severe rent burden
- 461.0
Population outlook (Carteret County) Hauer SSP2
- Today (2025)
- 73,443 people
- By 2030
- 75,344 · +2.6%
- By 2040
- 78,142 · +6.4%
- By 2050
- 80,091 · +9.1%
- By 2075
- 86,120 · +17.3%
- By 2100
- 89,408 · +21.7%
Race, ethnicity, and origin ACS 2023
- Neighborhood character
- Predominantly White (82%)
- Race & ethnicity
- White 82% Hispanic / Latino 7% Two or more races 6% Black 3% Asian 1%
- Hispanic origin (detail)
- Mexican 4%
- Common ancestry
- Slovak 3% Romanian 3% Lithuanian 2%
- Foreign-born
- 5% · Canada, Dominican Republic
- Languages at home
- 92% English-only · Spanish 6% German/W. Germanic 1%
Political lean MEDSL · Carteret
- 2024 margin
- Solid R (+43.1) · D 28.0% · R 71.1%
- 2008→2024 swing
- -8.4pp toward R · 2008: -34.7pp · 2024: -43.1pp
- All cycles
- 2024: R+43.1 2020: R+42.0 2016: R+44.5 2012: R+41.0 2008: R+34.7
Not yet ingested
- Civics
- —
Market trends
- HPI YoY
- ▼ -53.54%
- Current HPI
- 276.6589
- Rent YoY
- —
- Metro
- Morehead City, NC
- State GDP YoY
- ▲ 3.28%
- F500 in state
- 26
Industry mix (Fortune 500 HQ in NC)
| Industry | F500 HQs | Revenue |
|---|---|---|
| Financial Services | 2 | $213B |
|
||
| Retail | 2 | $95B |
|
||
| Industrial Conglomerate | 1 | $38B |
|
||
| Metals / Steel | 1 | $35B |
|
||
| Utilities | 1 | $30B |
|
||
| Industrial Machinery | 1 | $19B |
|
||
Price history
+388.5% since first listed26 events — show timeline
- 2026-05-21 Price Changed $828,000 Hive MLS
- 2026-04-15 Price Changed $835,900 Hive MLS
- 2026-03-27 Price Changed $848,800 Hive MLS
- 2026-03-14 Price Changed $879,000 Hive MLS
- 2026-03-02 Price Changed $928,900 Hive MLS
- 2026-01-17 Listed $989,000 Hive MLS
- 2025-11-15 Listing Removed — Hive MLS
- 2025-10-29 Price Changed $989,000 Hive MLS
- 2025-09-25 Price Changed $999,000 Hive MLS
- 2025-09-05 Listed $969,000 Hive MLS
- 2025-07-10 Listing Removed — Hive MLS
- 2025-06-27 Price Changed $899,000 Hive MLS
- 2025-05-30 Price Changed $929,000 Hive MLS
- 2025-05-16 Price Changed $949,000 Hive MLS
- 2025-03-18 Price Changed $999,990 Hive MLS
- 2025-02-22 Price Changed $1,075,000 Hive MLS
- 2024-11-15 Price Changed $1,175,000 Hive MLS
- 2024-09-06 Listed $1,250,000 Hive MLS
- 2022-11-14 Listing Removed — Hive MLS
- 2022-10-25 Price Changed $860,000 Hive MLS
- 2022-10-06 Listed $874,500 Hive MLS
- 2008-09-12 Sold (Public Records) $175,000 Public Records
- 2008-09-12 Sold (MLS) $175,000 Hive MLS
- 2008-05-01 Listed $185,000 Hive MLS
- 2005-08-16 Sold (MLS) $162,750 Hive MLS
- 2005-04-29 Listed $169,500 Hive MLS
Property tax history
+1.6%/yrLatest (2024): $2,606 · -2.8% YoY. Source: county tax records.
Cash-flow waterfall
monthlySold comps — $/sqft
last 12 mo · ≤1 miLoading sold comps…