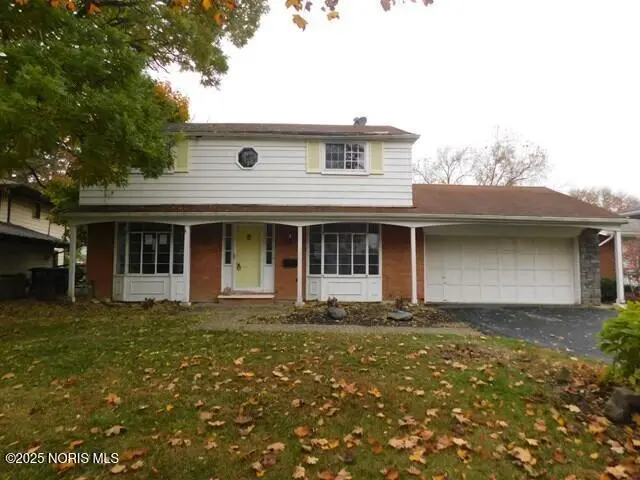
3638 Treelawn Dr · Toledo, OH
Flood risk 1/10 · Minimal
- FEMA flood zone
- X (unshaded)
- Chance of flooding over 30 yrs
- 0.0%
- Est. flood insurance / yr
- $473 – $860
Fire risk 1/10 · Minimal
- Est. fire insurance / yr
- $713 – $1,323
Heat risk 3/10 · Minor
- Hot days now (above 100°F)
- 7 days/yr
- Hot days in 30 yrs
- 16 days/yr
Wind risk 2/10 · Minimal
- Chance of severe wind over 30 yrs
- —
Air-quality risk 2/10 · Minimal
- Unhealthy air days now
- 1 days/yr
- Unhealthy air days in 30 yrs
- 2 days/yr
Risk factors via First Street. Map © Google.
Why this score? — see what drove the D grade
The composite is a weighted blend of 9 inputs, each scored 0–100. Each bar is that input's sub-score; the figure is the points it added to the 100-point composite (weight × sub-score).
- ARV discount +15.0/15.0
- Cash flow +9.6/30.0
- Rent growth +4.5/5.0
- 1% rule +3.7/10.0
- Livability +3.3/5.0
- DSCR +2.7/10.0
- Condition / age +2.5/5.0
- Schools +1.6/10.0
- Appreciation +0.0/10.0
$170,000
🖨 Deal sheet (PDF) 📄 Offer letter ✓ Due diligence
Listing remarks MLS
3 bedroom with 1.5 baths. Great opportunity! Call today! This home features Living room, formal dining room, family room, and more. Extra's include enclosed patio, basement, and 2 car attached garage.
Key facts
- Formal dining room
- Living room
- Basement
Tags
Neighborhood map
What this means for you Summary
Snapshot
- This is a 3-bed/1.5-bath single-family listed at $170k.
Deal economics
- At list price, monthly cash flow is $-116 ($-1k/yr) — negative.
- To cash-flow at today's rent, offer at most $149k (12.1% below list).
- To meet the 1% rule (rent ≥ 1% of price), the offer needs to be $148k (12.9% below list).
- Recommended offer: $148k (12.9% below list) — sets the bar for 1% rule.
- Cap rate 5.5% vs local median 7.7% in Toledo — below-typical yield; the buyer is paying a premium for something (appreciation thesis, condition, location) that the cap rate doesn't capture.
Location & tenants
- Location reads 66/100 on livability (#645 in OH) — a middle-class / working-renter tenant base. Strengths: cost of living A+, housing A+, health & safety A+; Watch: amenities C-, crime F, commute F.
- Toledo City (urban): math 15% / reading 24% proficiency, ranked #634 of 656 in OH (top 97%) — low school quality limits family demand, transient renter base, plan for 1-2y turnover; 72% free/reduced lunch — lower-income household profile, screen leases tightly.
- Zoned schools: Grove Patterson Academy Elementary School (math 47% / reading 66%, grade C+, #761 of 1,584 statewide, top 48%, 403 students, 38% FRL); Bowsher High School (math 23% / reading 45%, grade F, #596 of 781 statewide, top 76%, 1,240 students, 49% FRL) — zoned schools average 44% FRL vs 72% district-wide (28 pts lower); this property's tenant base skews higher-income than the district average.
- Zoned-school proficiency averages 45% at this address vs 20% district-wide (+26 pts) — the actual schools serving this property are materially stronger than the Toledo City average implies; a family-tenant draw the district grade alone would hide.
- Market conditions: Rents rising fast (+8.0%/yr); 70 active listings in the ZIP; 4 comparable units currently listed for rent nearby; rentals lingering (median 46d on market — plan ~5-8 weeks vacancy on turnover, expect pricing pressure); 50% of comp listings sitting > 30 days — soft ceiling on asking rent; 415 units permitted in Lucas County in 2024 (122 in 5+ unit buildings).
- This rent runs 30% of the median local income ($59k/yr) — at the standard rent-burdened threshold; future hikes will face affordability resistance.
Forward outlook
- Local home prices are declining (-3.0%/yr); year-one equity from $1k of loan paydown is wiped out by about $5k of value loss. Plan a longer hold.
- Lucas County population projected at -16% by 2050 — secular population decline; favor cash flow + early exit over multi-decade hold.
Negotiation context
- It's been on market 203 days — a 12% lower offer ($150k) is reasonable based on typical stale-listing flexibility.
- Current owner paid $126k; 35% above their basis — modest negotiation headroom, anchor on the comps not their cost.
Questions for the listing agent
- What do current leases actually rent for vs. the listed asking? Can we see a recent rent roll and the last 12 months of T-12 income?
- It's been on market 203 days. Have you received any prior offers? Is the seller open to a 13% concession, seller financing, or rate buy-down credit?
- Built in 1962 — when were the roof, HVAC, electrical panel, plumbing, and water heater last replaced?
- Why hasn't it sold? Are there any deal-killer items the seller is aware of (foundation, flood, title, zoning, code violations)?
- Is there a deadline driving the sale (1031 exchange, divorce, estate, relocation)? That informs how much negotiation room exists.
- Schools are D-rated, which usually means shorter tenancies and higher turnover. Who's the typical renter profile here, and what's been the actual vacancy rate?
- Crime grade is F in this area — have there been break-ins, vandalism, or insurance claims at this property in the last 3 years? What carrier currently insures it and at what premium?
- The area grade is low — what's the realistic commute time and amenity access for the typical tenant pool here? Any planned neighborhood developments (good or bad) we should know about?
- What's the average days-on-market for RENTAL listings here right now (not sales)? A rising rental-DOM trend means longer vacancies and softer asking-rent achievability than the comps imply.
- What's the recent tenant-quality profile in this submarket — average credit score on applications, eviction rate, late-payment / NSF rate, and stable-employment percentage? A property-management company in the area should have these aggregated.
- How much new for-sale + rental construction is in the pipeline within 1–3 miles? Heavy new supply typically softens prices + rents 12–24 months out; constrained supply supports both.
Investment metrics
- 1% rule
- 0.87% ✗
- Cap rate
- 5.47%
- Cash-on-cash
- -2.93%
- DSCR
- 0.87
- GRM
- 9.6
CMA / ARV
- ARV (median comp)
- $251,989
- List price
- $170,000
- Delta
- -32.54%
- Verdict
- UNDERPRICED
- Comps
- 20 within 1.0 mi
Show comp detail 12 sales within ~0.75 mi
| Address | Dist | Beds/Ba | Sqft | Sold | Price | $/sf | Match |
|---|---|---|---|---|---|---|---|
| 1913 Sunnylawn Dr | 0.07mi | 4/1.5 (+1) | 1,680 (+2%) | 2mo | $251,000 | $149 | 87 |
| 1978 Sunnylawn Dr | 0.17mi | 3/1.5 | 1,678 (+2%) | 5mo | $250,000 | $149 | 85 |
| 1931 Cherrylawn Dr | 0.15mi | 3/1.5 | 1,562 (-5%) | 3mo | $260,000 | $166 | 82 |
| 3438 Ravenwood Blvd | 0.38mi | 3/1.0 | 1,592 (-3%) | 1mo | $190,000 | $119 | 74 |
| 3431 Cragmoor Ave | 0.41mi | 3/2.0 | 1,710 (+4%) | 1mo | $220,000 | $129 | 72 |
| 4073 Grandview Ct | 0.49mi | 3/2.0 | 1,726 (+5%) | 1mo | $300,000 | $174 | 67 |
| 2274 W Country Club Pkwy | 0.54mi | 3/1.5 | 1,721 (+4%) | 2mo | $191,400 | $111 | 66 |
| 1861 Lynbrook Dr | 0.18mi | 4/2.0 (+1) | 1,820 (+10%) | 1mo | $180,000 | $99 | 66 |
| 2053 Heatherwood Dr | 0.57mi | 3/1.5 | 1,604 (-3%) | 4mo | $265,000 | $165 | 66 |
| 2079 Cherrylawn Dr | 0.30mi | 3/2.0 | 1,853 (+12%) | 3mo | $232,000 | $125 | 61 |
| 3825 Heatherbrook Dr | 0.59mi | 3/2.0 | 1,766 (+7%) | 1mo | $255,000 | $144 | 58 |
| 3278 Ravenwood Blvd | 0.51mi | 3/1.0 | 1,444 (-12%) | 1mo | $189,900 | $132 | 53 |
Match score weights: distance 35% · size 25% · config 20% · recency 20%. Top-matched comps best support the ARV.
Projected returns pro-forma
-3.0% appreciation · 8.0% rent growth · sell at horizon
- IRR
- -15.2%
- Equity multiple
- 0.43×
- Total profit
- $-27,034
- Equity at exit
- $25,348
- IRR
- 0.7%
- Equity multiple
- 1.06×
- Total profit
- $2,903
- Equity at exit
- $14,698
Cash invested: $47,600 (down + closing). Projections, not guarantees.
Landlord ↔ Tenant lean methodology
- Overall (STATE)
- 73 Landlord-Friendly
- State Ohio
- 73 Landlord-Friendly · R+6
- County
- — inherits STATE
- City
- — inherits STATE
ZIP-level market 43614
- Home prices YoY
- -22.4%
- Rents YoY
- 8.0%
- Active inventory
- 70
- Price-to-rent
- 9.6×
Monthly cashflow live
- Estimated rent
- $1,480 medium interval (Pro) →
- Mortgage (P&I)
- −$891
- Tax from tax record
- −$323 /mo · $3,879/yr
- Insurance
- −$71
- HOA
- −$0
- Vacancy / Maint / Mgmt
- −$311
- Net cashflow
- $-116
Break-even live
Sensitivity live
| Price | -10% $-20 | -5% $-68 | +0% $-116 | +5% $-164 | +10% $-212 |
|---|---|---|---|---|---|
| Rent | -10% $-233 | -5% $-175 | +0% $-116 | +5% $-58 | +10% $1 |
| Rate | -1.0pp $-31 | -0.5pp $-73 | base $-116 | +0.5pp $-160 | +1.0pp $-205 |
UW: 25.0% down · 7.5% · 30yr · 1.5% tax · 5.0% vac · 8.0% maint · 8.0% mgmt
Financing live
Cash to close
- Down payment
- $42,500
- Closing costs
- $5,100
- Reserves months
- —
- Total cash needed
- —
Loan-product check · same deal, 3 products live
Conventional
25% down · 7.5% · 30yr
- Down + closing
- —
- Monthly P&I
- —
- Monthly cashflow
- —
- DSCR
- —
- Eligible?
- —
Personal DTI + credit; lowest rate.
DSCR
20% down · 8.5% · 30yr
- Down + closing
- —
- Monthly P&I
- —
- Monthly cashflow
- —
- DSCR
- —
- Eligible?
- —
No personal income docs; deal must DSCR.
Hard money
10% down · 12.0% · 12mo
- Down + closing
- —
- Monthly P&I
- —
- Monthly cashflow
- —
- DSCR
- —
- Eligible?
- —
Short-term bridge; refi at stabilization.
Rent comps 4 comps
| Address | Beds | Baths | Sqft | Rent | $/sqft | DOM | Units | Dist |
|---|---|---|---|---|---|---|---|---|
| 3042 Cragmoor Ave Toledo, OH | 3.0 | 1.0 | 1250 | $1,800 | $1.44 | 45d | 1 | 0.82mi |
| 1255 S Byrne Rd Toledo, OH | 1.0–3.0 | 1.0–2.0 | 1080 | $1,529 | $1.42 | 15d | 1 | 1.02mi |
| 3025 S Byrne Rd Unit 1 Toledo, OH | 3.0 | 1.0 | 1064 | $1,095 | $1.03 | 23d | 1 | 1.09mi |
| 1812 Glen Valley Dr Toledo, OH | 1.0–3.0 | 1.0–1.5 | 845 | $1,275 | $1.51 | 45d | 1 | 1.36mi |
Listing history 12 events
-
2026-06-01status $170,000 Pending 203 DOM
-
2026-05-31days on market $170,000 Active 203 DOM
-
2026-05-30days on market $170,000 Active 202 DOM
-
2026-05-07price $170,000 200-char remark
Show marketing remark (200 chars)
3 bedroom with 1.5 baths. Great opportunity! Call today! This home features Living room, formal dining room, family room, and more. Extra's include enclosed patio, basement, and 2 car attached garage.
-
2026-05-07price $154,900 200-char remark
Show marketing remark (200 chars)
3 bedroom with 1.5 baths. Great opportunity! Call today! This home features Living room, formal dining room, family room, and more. Extra's include enclosed patio, basement, and 2 car attached garage.
-
2026-04-07price $170,000 200-char remark
Show marketing remark (200 chars)
3 bedroom with 1.5 baths. Great opportunity! Call today! This home features Living room, formal dining room, family room, and more. Extra's include enclosed patio, basement, and 2 car attached garage.
-
2026-02-26price $180,000 200-char remark
Show marketing remark (200 chars)
3 bedroom with 1.5 baths. Great opportunity! Call today! This home features Living room, formal dining room, family room, and more. Extra's include enclosed patio, basement, and 2 car attached garage.
-
2025-12-15price $190,000 200-char remark
Show marketing remark (200 chars)
3 bedroom with 1.5 baths. Great opportunity! Call today! This home features Living room, formal dining room, family room, and more. Extra's include enclosed patio, basement, and 2 car attached garage.
-
2025-11-09$200,000 Active 200-char remark
Show marketing remark (200 chars)
3 bedroom with 1.5 baths. Great opportunity! Call today! This home features Living room, formal dining room, family room, and more. Extra's include enclosed patio, basement, and 2 car attached garage.
-
1997-08-07soldstatus $125,900
-
1989-09-21soldstatus $107,000
-
1985-09-30soldstatus $75,000
ⓘ Source: listings_history table (triggers on properties + properties_extension) + one-shot
backfill from property_details.listing_events for pre-trigger history.
Tax reassessment forecast OH · Partial reset (capped growth)
- Current annual tax
- $3,879 · $323/mo
- Projected year-2 tax
- $3,879 · $323/mo
- Expected delta
- $0/yr ($0/mo · 0.0%)
ⓘ Screening estimate from a state-policy table — verify with the county assessor before closing.
Climate risk First Street
- Flood 1/10 Low FEMA zone X (unshaded) · 0% chance over 30 yrs
- Wildfire 1/10 Low
- Heat 3/10 Moderate 7 d/yr ≥100°F today · 16 d/yr by 30 yrs out
- Wind 2/10 Low
- Air quality 2/10 Low 1 unhealthy d/yr today · 2 by 30 yrs out
Nearby sold comps map
Loading sold comps map…
Walkable amenities ~0.75 mi
Loading nearby amenities…
Taxation est. · year 1
- Rental income
- $17,763
- − Mortgage interest
- −$9,523
- − Property taxes
- −$3,879
- − Insurance
- −$850
- − Repairs & maintenance
- −$1,421
- − Management
- −$1,421
- − Depreciation
- −$4,945
- Taxable loss
- −$4,276
- Est. tax savings @ 24.0%
- +$1,026
- After-tax cash flow
- $-368/yr
For passive investors: Depreciation is non-cash, so a rental often shows a tax loss while cash-flowing — sheltering income. Rental losses are passive: they offset passive income freely, and up to $25,000/yr can offset ordinary (W-2) income if you actively participate and your MAGI is under $100k (phasing out to $0 by $150k); unused losses carry forward. On sale, claimed depreciation is recaptured at up to 25%, and gains may owe capital-gains tax (a 1031 exchange can defer both). Figures are a year-1 estimate at your 24.0% rate — not tax advice; consult a CPA.
Schools (NCES district)
- District
- Toledo City
- NCES district ID
- 3904490
- Math proficiency
- 15% ▼ -16.00%
- Reading proficiency
- 24% ▼ -13.00%
- Median HH income
- $32,137
- Composite
- 15.76/100
- National rank
- #9276
- State rank
- #634 of 656 in OH
Livability — Toledo
- Score
- 66/100
- State rank
- #645
- US rank
- #11442
Category grades
Schools grade is shown separately in the Schools card above.
Census & demographics
- Census place
- Toledo, OH
- County
- Lucas County · 380,724 people
- City population
- 280,811
- Metro
- Toledo, OH
- Population (ZIP)
- 29,075
- Household income
- $58,961
- Rent vs Own
- Severe rent burden
- 1407.0
Population outlook (Lucas County) Hauer SSP2
- Today (2025)
- 420,751 people
- By 2030
- 410,187 · -2.5%
- By 2040
- 384,019 · -8.7%
- By 2050
- 355,125 · -15.6%
- By 2075
- 291,683 · -30.7%
- By 2100
- 233,670 · -44.5%
Race, ethnicity, and origin ACS 2023
- Neighborhood character
- Predominantly White (67%)
- Race & ethnicity
- White 67% Black 21% Hispanic / Latino 7% Two or more races 4% Asian 2%
- Hispanic origin (detail)
- Mexican 6% Puerto Rican 1%
- Common ancestry
- Romanian 8% Italian 5% Lithuanian 3%
- Foreign-born
- 3% · Canada
- Languages at home
- 96% English-only · Other Indo-European 1% Spanish 1%
Political lean MEDSL · Lucas
- 2024 margin
- D (+12.6) · D 55.8% · R 43.2%
- 2008→2024 swing
- -18.9pp toward R · 2008: 31.4pp · 2024: 12.6pp
- All cycles
- 2024: D+12.6 2020: D+16.8 2016: D+17.4 2012: D+30.4 2008: D+31.4
Not yet ingested
- Civics
- —
Market trends
- HPI YoY
- ▼ -61.96%
- Current HPI
- 214.7031
- Rent YoY
- ▲ 8.03%
- Metro
- Toledo, OH
- State GDP YoY
- ▲ 1.98%
- F500 in state
- 48
Industry mix (Fortune 500 HQ in OH)
| Industry | F500 HQs | Revenue |
|---|---|---|
| Insurance | 3 | $145B |
|
||
| Industrial Machinery | 3 | $49B |
|
||
| Financial Services | 3 | $24B |
|
||
| Consumer Goods | 2 | $93B |
|
||
| Aerospace / Defense | 2 | $47B |
|
||
| Utilities | 2 | $33B |
|
||
Price history
+126.7% since first listed9 events — show timeline
- 2026-05-07 Price Changed $170,000 NORIS
- 2026-05-07 Price Changed $154,900 NORIS
- 2026-04-07 Price Changed $170,000 NORIS
- 2026-02-26 Price Changed $180,000 NORIS
- 2025-12-15 Price Changed $190,000 NORIS
- 2025-11-09 Listed $200,000 NORIS
- 1997-08-07 Sold (Public Records) $125,900 Public Records
- 1989-09-21 Sold (Public Records) $107,000 Public Records
- 1985-09-30 Sold (Public Records) $75,000 Public Records
Property tax history
+3.7%/yrLatest (2025): $3,879 · -0.4% YoY. Source: county tax records.
Cash-flow waterfall
monthlySold comps — $/sqft
last 12 mo · ≤1 miLoading sold comps…