 Multi-family
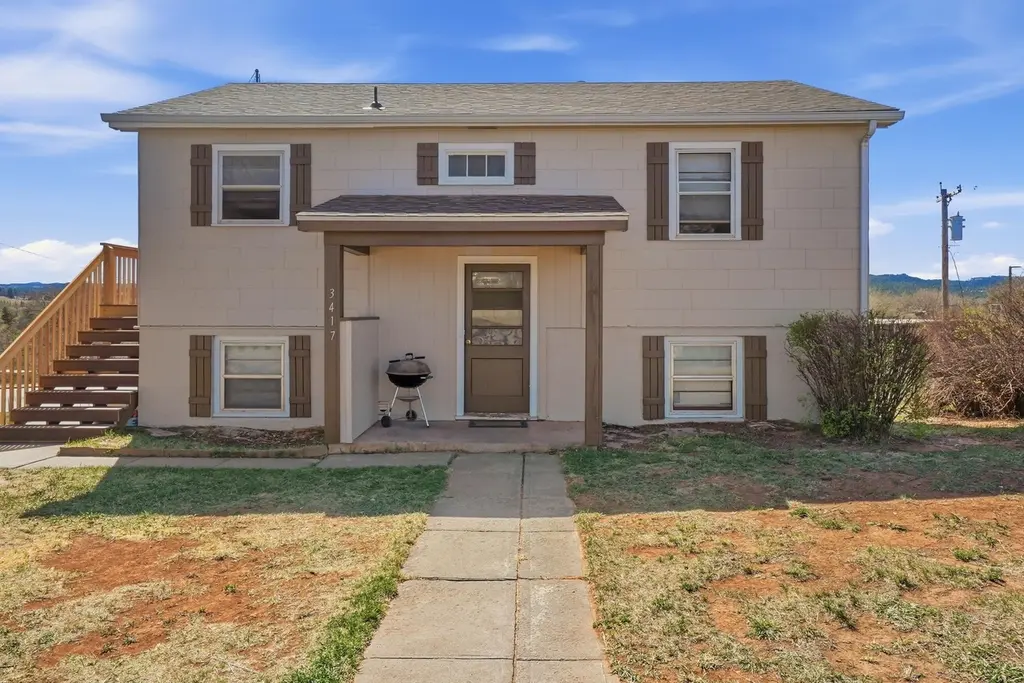
3417 W Rapid St · Rapid City, SD
Flood risk 1/10 · Minimal
- FEMA flood zone
- X (unshaded)
- Chance of flooding over 30 yrs
- 0.0%
- Est. flood insurance / yr
- $507 – $1,088
Fire risk 8/10 · Major
- Est. fire insurance / yr
- $1,342 – $2,492
Heat risk 2/10 · Minimal
- Hot days now (above 94°F)
- 7 days/yr
- Hot days in 30 yrs
- 17 days/yr
Wind risk 2/10 · Minimal
- Chance of severe wind over 30 yrs
- —
Air-quality risk 4/10 · Minor
- Unhealthy air days now
- 5 days/yr
- Unhealthy air days in 30 yrs
- 5 days/yr
Risk factors via First Street. Map © Google.
Why this score? — see what drove the D+ grade
The composite is a weighted blend of 9 inputs, each scored 0–100. Each bar is that input's sub-score; the figure is the points it added to the 100-point composite (weight × sub-score).
- Cash flow +15.8/30.0
- ARV discount +7.5/15.0
- DSCR +4.9/10.0
- 1% rule +3.7/10.0
- Livability +3.7/5.0
- Rent growth +3.5/5.0
- Schools +3.4/10.0
- Condition / age +2.5/5.0
- Appreciation +0.0/10.0
$285,000
🖨 Deal sheet (PDF) 📄 Offer letter ✓ Due diligence
Multi-family units
County records classify this as Multi-Family (2-4 Unit). Listing-text estimate: 1 unit. estimate disagrees with records
Listing remarks MLS
Listed by Rich Hegre Engel & Volkers 605-381-RICH(7424) This is a great opportunity to own a west side investment property. This duplex is fully rented with great income. Zero vacancy for over 3 years, gives you peace of mind knowing you will have income.
Key facts
- Built 1952
- Listed 67 days
Property features AI
Exterior
- Parking: On-street parking
- Utilities: Public water; Public sewer; Natural gas available
- Home design: Residential income property; Duplex
- Exterior features: Composition roof; Level lot; Has a view
Interior
- Kitchen: Range, Oven, Refrigerator
- Heating & cooling: Electric cooling
- Interior features: Range, Oven, Refrigerator
Neighborhood map
What this means for you Summary
Snapshot
- This is a 4-bed/2.0-bath multifamily listed at $285k.
Deal economics
- At list price, monthly cash flow is $129 ($2k/yr) — positive.
- The deal already cash-flows at list — no discount required.
- To meet the 1% rule (rent ≥ 1% of price), the offer needs to be $249k (12.6% below list).
- Recommended offer: $249k (12.6% below list) — sets the bar for 1% rule.
- Cap rate 6.8% vs local median 2.5% in Rapid City — top-decile yield for the area; either an underpriced asset or a hidden risk that comps aren't pricing in. Stress-test before assuming the spread holds.
Location & tenants
- Location reads 74/100 on livability (#34 in SD, #4,720 nationally) — a middle-class / working-renter tenant base. Strengths: cost of living A+, housing A+, health & safety A+; Watch: crime F, commute F.
- Rapid City Area School District 51-4 (urban): math 34% / reading 46% proficiency, ranked #50 of 59 in SD (top 85%) — families likely to look elsewhere, expect single-tenant / working-renter base with shorter leases.
- Zoned schools: South Canyon Elementary - 15 (math 37% / reading 42%, grade F, #169 of 253 statewide, top 71%, 266 students, 27% FRL); West Middle School - 37 (math 42% / reading 51%, grade D+, #73 of 143 statewide, top 51%, 612 students, 26% FRL); Stevens High School - 42 (math 56% / reading 86%, grade B+, #11 of 151 statewide, top 7%, 1,686 students, 14% FRL).
- Zoned-school proficiency averages 52% at this address vs 40% district-wide (+12 pts) — the actual schools serving this property are materially stronger than the Rapid City Area School District 51-4 average implies; a family-tenant draw the district grade alone would hide.
- Market conditions: Rents rising fast (+4.1%/yr); 236 active listings in the ZIP; 1 comparable units currently listed for rent nearby; solid renter incomes; 1,181 units permitted in Pennington County in 2024 (715 in 5+ unit buildings).
- This rent runs 33% of the median local income ($91k/yr) — at the standard rent-burdened threshold; future hikes will face affordability resistance.
Forward outlook
- Local home prices are declining (-3.0%/yr); year-one equity from $2k of loan paydown is wiped out by about $9k of value loss. Plan a longer hold.
- Pennington County population projected at +28% by 2050 — long-run rental-demand tailwind backs the buy-and-hold thesis.
Negotiation context
- It's been on market 67 days — a 6% lower offer ($268k) is reasonable based on typical stale-listing flexibility.
- 4 sale attempts since 10y ago with the ask held roughly flat each time — persistent listings suggest the price (not the market) is what's stuck; bring a comps-based counter.
Risks & watch-outs
- Watch-outs: built in 1952 — expect roof / HVAC / electrical / plumbing capex.
- Climate carrying-cost: severe wildfire risk — expect insurance premiums to compound above CPI over the hold.
Questions for the listing agent
- It's been on market 67 days. Have you received any prior offers? Is the seller open to a 13% concession, seller financing, or rate buy-down credit?
- Built in 1952 — when were the roof, HVAC, electrical panel, plumbing, and water heater last replaced?
- Why hasn't it sold? Are there any deal-killer items the seller is aware of (foundation, flood, title, zoning, code violations)?
- Is there a deadline driving the sale (1031 exchange, divorce, estate, relocation)? That informs how much negotiation room exists.
- Crime grade is F in this area — have there been break-ins, vandalism, or insurance claims at this property in the last 3 years? What carrier currently insures it and at what premium?
- The area grade is low — what's the realistic commute time and amenity access for the typical tenant pool here? Any planned neighborhood developments (good or bad) we should know about?
- What's the average days-on-market for RENTAL listings here right now (not sales)? A rising rental-DOM trend means longer vacancies and softer asking-rent achievability than the comps imply.
- What's the recent tenant-quality profile in this submarket — average credit score on applications, eviction rate, late-payment / NSF rate, and stable-employment percentage? A property-management company in the area should have these aggregated.
- How much new apartment / multifamily construction is in the pipeline within 1–3 miles? Heavy new supply (>2% of stock underway) typically softens rents 12–24 months out; light construction supports rent growth.
Investment metrics
- 1% rule
- 0.87% ✗
- Cap rate
- 6.84%
- Cash-on-cash
- 1.94%
- DSCR
- 1.09
- GRM
- 9.5
CMA / ARV
No comps found within radius.
Projected returns pro-forma
-3.0% appreciation · 4.09% rent growth · sell at horizon
- IRR
- -12.1%
- Equity multiple
- 0.56×
- Total profit
- $-35,232
- Equity at exit
- $42,494
- IRR
- -1.5%
- Equity multiple
- 0.89×
- Total profit
- $-8,673
- Equity at exit
- $24,642
Cash invested: $79,800 (down + closing). Projections, not guarantees.
Landlord ↔ Tenant lean methodology
- Overall (STATE)
- 83 Strongly Landlord-Friendly
- State South Dakota
- 83 Strongly Landlord-Friendly · R+16
- County
- — inherits STATE
- City
- — inherits STATE
ZIP-level market 57702
- Rents YoY
- 4.1%
- Active inventory
- 236
- Price-to-rent
- 19.1×
Monthly cashflow live
- Estimated rent
- $2,490 high interval (Pro) →
- Mortgage (P&I)
- −$1,495
- Tax from tax record
- −$225 /mo · $2,694/yr
- Insurance
- −$119
- HOA
- −$0
- Vacancy / Maint / Mgmt
- −$523
- Net cashflow
- $129
Break-even live
Sensitivity live
| Price | -10% $291 | -5% $210 | +0% $129 | +5% $49 | +10% $-32 |
|---|---|---|---|---|---|
| Rent | -10% $-67 | -5% $31 | +0% $129 | +5% $228 | +10% $326 |
| Rate | -1.0pp $273 | -0.5pp $202 | base $129 | +0.5pp $55 | +1.0pp $-20 |
2-unit breakdown (identical units grouped — click to expand)
| Units | Beds | Baths | Est. rent |
|---|---|---|---|
| 2× units | 2 | 1 | $2,490 |
| #1 | 2 | 1 | $1,245 |
| #2 | 2 | 1 | $1,245 |
| Total (2 units) | $2,490 | ||
UW: 25.0% down · 7.5% · 30yr · 1.5% tax · 5.0% vac · 8.0% maint · 8.0% mgmt
Financing live
Cash to close
- Down payment
- $71,250
- Closing costs
- $8,550
- Reserves months
- —
- Total cash needed
- —
Loan-product check · same deal, 3 products live
Conventional
25% down · 7.5% · 30yr
- Down + closing
- —
- Monthly P&I
- —
- Monthly cashflow
- —
- DSCR
- —
- Eligible?
- —
Personal DTI + credit; lowest rate.
DSCR
20% down · 8.5% · 30yr
- Down + closing
- —
- Monthly P&I
- —
- Monthly cashflow
- —
- DSCR
- —
- Eligible?
- —
No personal income docs; deal must DSCR.
Hard money
10% down · 12.0% · 12mo
- Down + closing
- —
- Monthly P&I
- —
- Monthly cashflow
- —
- DSCR
- —
- Eligible?
- —
Short-term bridge; refi at stabilization.
Rent comps 1 comps
| Address | Beds | Baths | Sqft | Rent | $/sqft | DOM | Units | Dist |
|---|---|---|---|---|---|---|---|---|
| 1800 Shaver St Rapid City, SD | 3.0 | 1.0–2.0 | 920 | $1,915 | $2.08 | 22d | 2 | 1.42mi |
Listing history 24 events
-
2026-06-21days on market $285,000 Active 67 DOM
-
2026-06-19days on market $285,000 Active 65 DOM
-
2026-06-18days on market $285,000 Active 64 DOM
-
2026-06-17days on market $285,000 Active 63 DOM
-
2026-06-16days on market $285,000 Active 62 DOM
-
2026-06-15days on market $285,000 Active 61 DOM
-
2026-06-14days on market $285,000 Active 59 DOM
-
2026-06-13days on market $285,000 Active 58 DOM
-
2026-06-10days on market $285,000 Active 56 DOM
-
2026-06-09days on market $285,000 Active 55 DOM
-
2026-06-08days on market $285,000 Active 54 DOM
-
2026-06-07days on market $285,000 Active 53 DOM
-
2026-06-05days on market $285,000 Active 50 DOM
-
2026-06-02days on market $285,000 Active 48 DOM
-
2026-06-01pricedays on market $285,000 Active 47 DOM
-
2026-05-31days on market $295,000 Active 46 DOM
-
2026-05-30days on market $295,000 Active 45 DOM
-
2026-04-15$295,000 Active 261-char remark
Show marketing remark (261 chars)
Listed by Rich Hegre Engel & Volkers 605-381-RICH(7424) This is a great opportunity to own a west side investment property. This duplex is fully rented with great income. Zero vacancy for over 3 years, gives you peace of mind knowing you will have income.
-
2026-04-15$295,000 Active
Show marketing remark (261 chars)
Listed by Rich Hegre Engel & Volkers 605-381-RICH(7424) This is a great opportunity to own a west side investment property. This duplex is fully rented with great income. Zero vacancy for over 3 years, gives you peace of mind knowing you will have income.
-
2022-11-07soldstatus $250,000
-
2022-11-07soldstatus $250,000
-
2022-09-21$250,000
-
2016-08-01soldstatus $112,000
-
2016-05-27$125,000
ⓘ Source: listings_history table (triggers on properties + properties_extension) + one-shot
backfill from property_details.listing_events for pre-trigger history.
Tax reassessment forecast SD · Resets to sale price
- Current annual tax
- $2,694 · $225/mo
- Projected year-2 tax
- $3,734 · $311/mo
- Expected delta
- +$1,039/yr (+$87/mo · 38.6%)
ⓘ Screening estimate from a state-policy table — verify with the county assessor before closing.
Climate risk First Street
- Flood 1/10 Low FEMA zone X (unshaded) · 0% chance over 30 yrs
- Wildfire 8/10 Severe
- Heat 2/10 Low 7 d/yr ≥94°F today · 17 d/yr by 30 yrs out
- Wind 2/10 Low
- Air quality 4/10 Moderate 5 unhealthy d/yr today · 5 by 30 yrs out
Nearby sold comps map
Loading sold comps map…
Walkable amenities ~0.75 mi
Loading nearby amenities…
Taxation est. · year 1
- Rental income
- $29,880
- − Mortgage interest
- −$15,964
- − Property taxes
- −$2,694
- − Insurance
- −$1,425
- − Repairs & maintenance
- −$2,390
- − Management
- −$2,390
- − Depreciation
- −$8,291
- Taxable loss
- −$3,275
- Est. tax savings @ 24.0%
- +$786
- After-tax cash flow
- $2,337/yr
For passive investors: Depreciation is non-cash, so a rental often shows a tax loss while cash-flowing — sheltering income. Rental losses are passive: they offset passive income freely, and up to $25,000/yr can offset ordinary (W-2) income if you actively participate and your MAGI is under $100k (phasing out to $0 by $150k); unused losses carry forward. On sale, claimed depreciation is recaptured at up to 25%, and gains may owe capital-gains tax (a 1031 exchange can defer both). Figures are a year-1 estimate at your 24.0% rate — not tax advice; consult a CPA.
Schools (NCES district)
- District
- Rapid City Area School District 51-4
- NCES district ID
- 4659820
- Math proficiency
- 34% ▼ -8.00%
- Reading proficiency
- 46% ▼ -4.00%
- Median HH income
- $50,145
- Composite
- 34.47/100
- National rank
- #5189
- State rank
- #50 of 59 in SD
Livability — Rapid City
- Score
- 74/100
- State rank
- #34
- US rank
- #4720
Category grades
Schools grade is shown separately in the Schools card above.
Census & demographics
- Census place
- Rapid City, SD
- County
- Pennington County · 99,403 people
- City population
- 99,403
- Metro
- Rapid City, SD
- Population (ZIP)
- 35,595
- Household income
- $91,457
- Rent vs Own
- Severe rent burden
- 499.0
Population outlook (Pennington County) Hauer SSP2
- Today (2025)
- 125,504 people
- By 2030
- 133,370 · +6.3%
- By 2040
- 147,505 · +17.5%
- By 2050
- 160,507 · +27.9%
- By 2075
- 197,585 · +57.4%
- By 2100
- 241,736 · +92.6%
Race, ethnicity, and origin ACS 2023
- Neighborhood character
- Predominantly White (86%)
- Race & ethnicity
- White 86% Two or more races 8% Hispanic / Latino 4% Native American 2% Asian 1%
- Common ancestry
- Portuguese 12% Slovak 3% Lithuanian 3%
- Foreign-born
- 3% · Canada, Philippines
- Languages at home
- 96% English-only · Spanish 1% German/W. Germanic 1% Arabic 1%
Political lean MEDSL · Pennington
- 2024 margin
- Strong R (+26.4) · D 35.4% · R 61.9% · Other 2.7%
- 2008→2024 swing
- -5.3pp toward R · 2008: -21.2pp · 2024: -26.4pp
- All cycles
- 2024: R+26.4 2020: R+25.1 2016: R+33.0 2012: R+29.5 2008: R+21.2
Not yet ingested
- Civics
- —
Market trends
- HPI YoY
- ▼ -225.08%
- Current HPI
- 230.5854
- Rent YoY
- ▲ 4.09%
- Metro
- Rapid City, SD
- State GDP YoY
- ▲ 0.70%
- F500 in state
- 2
Industry mix (Fortune 500 HQ in SD)
| Industry | F500 HQs | Revenue |
|---|---|---|
| Utilities | 1 | $1B |
|
||
Price history
+136.0% since first listed7 events — show timeline
- 2026-04-15 Listed $295,000 MRAOR
- 2026-04-15 Listed $295,000 BHMLS
- 2022-11-07 Sold (Public Records) $250,000 Public Records
- 2022-11-07 Sold (MLS) $250,000 BHMLS
- 2022-09-21 Listed $250,000 BHMLS
- 2016-08-01 Sold (MLS) $112,000 BHMLS
- 2016-05-27 Listed $125,000 BHMLS
Property tax history
+6.2%/yrLatest (2025): $2,694 · +5.8% YoY. Source: county tax records.
Cash-flow waterfall
monthlySold comps — $/sqft
last 12 mo · ≤1 miLoading sold comps…