1630 Eastern Ave NE Unit 1630 & 1632 · Roanoke, VA
Flood risk 1/10 · Minimal
- FEMA flood zone
- X (unshaded)
- Chance of flooding over 30 yrs
- 0.0%
- Est. flood insurance / yr
- $507 – $1,088
Fire risk 1/10 · Minimal
- Est. fire insurance / yr
- $666 – $1,236
Heat risk 5/10 · Moderate
- Hot days now (above 101°F)
- 7 days/yr
- Hot days in 30 yrs
- 18 days/yr
Wind risk 2/10 · Minimal
- Chance of severe wind over 30 yrs
- 1.0%
Air-quality risk 2/10 · Minimal
- Unhealthy air days now
- 1 days/yr
- Unhealthy air days in 30 yrs
- 1 days/yr
Risk factors via First Street. Map © Google.
Why this score? — see what drove the F grade
The composite is a weighted blend of 9 inputs, each scored 0–100. Each bar is that input's sub-score; the figure is the points it added to the 100-point composite (weight × sub-score).
- ARV discount +7.5/15.0
- Cash flow +6.2/30.0
- Rent growth +5.0/5.0
- Schools +4.1/10.0
- Livability +3.7/5.0
- Condition / age +2.2/5.0
- 1% rule +1.5/10.0
- DSCR +0.5/10.0
- Appreciation +0.0/10.0
$199,950
🖨 Deal sheet (PDF) 📄 Offer letter ✓ Due diligence
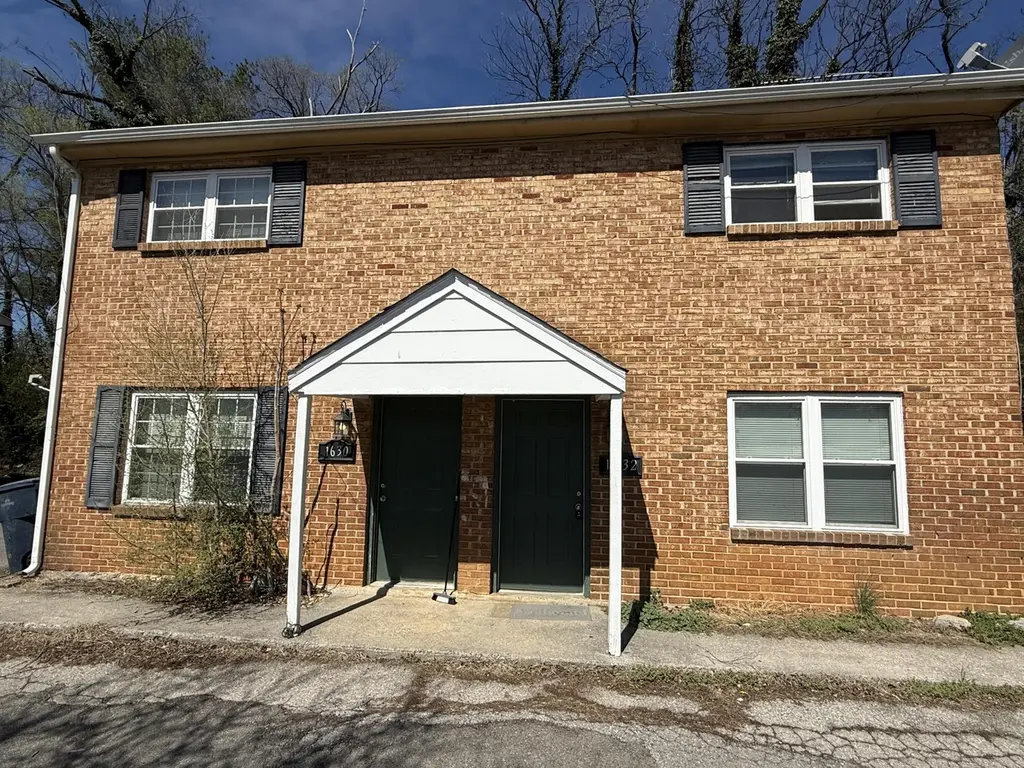
Listing remarks
Investor special in NE Roanoke. This duplex offers two separate 2BR/1BA units, each equipped with an electric stove, refrigerator, washer, and dryer. Property does need TLC, particularly on the exterior, but it wouldn't take much to turn this into a strong income-producing asset. Great opportunity for value-add investors looking to improve and increase rental potential. Being sold as-is, with solid upside for anyone ready to bring it back to life. Convenient location near downtown, transit, and major employment centers makes it appealing for long-term tenants.
Key facts
- 7,405 sq ft lot
- 2 parking spots
- Built 1974
Neighborhood map
What this means for you Summary
Snapshot
- This is a condo listed at $200k. Condition is rated fair.
Deal economics
- At list price, monthly cash flow is $-362 ($-4k/yr) — negative.
- To cash-flow at today's rent, offer at most $148k (26.2% below list).
- To meet the 1% rule (rent ≥ 1% of price), the offer needs to be $129k (35.5% below list).
- Recommended offer: $129k (35.5% below list) — sets the bar for 1% rule.
Location & tenants
- Location reads 73/100 on livability (#163 in VA) — a middle-class / working-renter tenant base. Strengths: cost of living A+, health & safety A+, housing A; Watch: amenities C-, employment D, crime F.
- Roanoke City Public School District (urban): math 40% / reading 58% proficiency, ranked #102 of 131 in VA (top 78%) — families likely to look elsewhere, expect single-tenant / working-renter base with shorter leases; 67% free/reduced lunch — lower-income household profile, screen leases tightly.
- Zoned schools: Fallon Park Elementary (math 33% / reading 42%, grade F, #931 of 1,108 statewide, top 84%, 533 students, 99% FRL); John P. Fishwick Middle (math 33% / reading 60%, grade D+, #264 of 342 statewide, top 77%, 501 students, 98% FRL); William Fleming High (math 66% / reading 68%, grade B, #185 of 319 statewide, top 61%, 1,911 students, 96% FRL) — zoned schools average 98% FRL vs 67% district-wide (31 pts higher); higher-poverty schools than district average — tighter screening recommended.
- Market conditions: Rents rising fast (+10.5%/yr); 194 active listings in the ZIP; 40 comparable units currently listed for rent nearby; rentals at typical pace (median 22d on market — plan ~3-4 weeks tenant-placement turnaround); 40% of comp listings sitting > 30 days — soft ceiling on asking rent; 113 units permitted in Roanoke city in 2024 (0 in 5+ unit buildings).
Forward outlook
- Local home prices are declining (-3.0%/yr); year-one equity from $1k of loan paydown is wiped out by about $6k of value loss. Plan a longer hold.
- Roanoke County population projected at +11% by 2050 — modest demand growth; plan on rents tracking national, not racing it.
Negotiation context
- It's been on market 30 days — a 2% lower offer ($197k) is reasonable based on typical stale-listing flexibility.
Risks & watch-outs
- Climate carrying-cost: extreme-heat days projected 7→18/yr by 2055 (HVAC capex compounding) — expect insurance premiums to compound above CPI over the hold.
Questions for the listing agent
- What do current leases actually rent for vs. the listed asking? Can we see a recent rent roll and the last 12 months of T-12 income?
- Have any recent inspections been done? Can we get a copy of the seller's disclosures and any deferred-maintenance estimates?
- Built in 1974 — when were the roof, HVAC, electrical panel, plumbing, and water heater last replaced?
- Any open or pending special assessments — roof, HVAC, plumbing, elevator, façade? What's the per-unit balance and payoff schedule, and is the seller paying it off at close or rolling it to the buyer?
- Is there a deadline driving the sale (1031 exchange, divorce, estate, relocation)? That informs how much negotiation room exists.
- Schools are A-rated — typically a magnet for longer-tenancy family renters. What's the average tenant stay here, and is there a school-zone premium baked into asking?
- Crime grade is F in this area — have there been break-ins, vandalism, or insurance claims at this property in the last 3 years? What carrier currently insures it and at what premium?
- The area grade is low — what's the realistic commute time and amenity access for the typical tenant pool here? Any planned neighborhood developments (good or bad) we should know about?
- What's the average days-on-market for RENTAL listings here right now (not sales)? A rising rental-DOM trend means longer vacancies and softer asking-rent achievability than the comps imply.
- What's the recent tenant-quality profile in this submarket — average credit score on applications, eviction rate, late-payment / NSF rate, and stable-employment percentage? A property-management company in the area should have these aggregated.
- How much new apartment / multifamily construction is in the pipeline within 1–3 miles? Heavy new supply (>2% of stock underway) typically softens rents 12–24 months out; light construction supports rent growth.
Investment metrics
- 1% rule
- 0.65% ✗
- Cap rate
- 4.12%
- Cash-on-cash
- -7.77%
- DSCR
- 0.65
- GRM
- 12.9
CMA / ARV
No comps found within radius.
Projected returns pro-forma
-3.0% appreciation · 8.0% rent growth · sell at horizon
- IRR
- -24.5%
- Equity multiple
- 0.13×
- Total profit
- $-48,643
- Equity at exit
- $29,813
- IRR
- -9.9%
- Equity multiple
- 0.27×
- Total profit
- $-40,962
- Equity at exit
- $17,288
Cash invested: $55,986 (down + closing). Projections, not guarantees.
Landlord ↔ Tenant lean methodology
- Overall (STATE)
- 55 Moderately Landlord-Leaning
- State Virginia
- 55 Moderately Landlord-Leaning · D+2
- County
- — inherits STATE
- City
- — inherits STATE
ZIP-level market 24012
- Rents YoY
- 10.5%
- Active inventory
- 194
- Price-to-rent
- 12.9×
Monthly cashflow live
- Estimated rent
- $1,290 high interval (Pro) →
- Mortgage (P&I)
- −$1,049
- Tax est. 1.5%
- −$250 /mo · $2,999/yr
- Insurance
- −$83
- HOA
- −$0
- Vacancy / Maint / Mgmt
- −$271
- Net cashflow
- $-362
Break-even live
Sensitivity live
| Price | -10% $-224 | -5% $-293 | +0% $-362 | +5% $-431 | +10% $-501 |
|---|---|---|---|---|---|
| Rent | -10% $-464 | -5% $-413 | +0% $-362 | +5% $-311 | +10% $-260 |
| Rate | -1.0pp $-262 | -0.5pp $-312 | base $-362 | +0.5pp $-414 | +1.0pp $-467 |
UW: 25.0% down · 7.5% · 30yr · 1.5% tax · 5.0% vac · 8.0% maint · 8.0% mgmt
Financing live
Cash to close
- Down payment
- $49,988
- Closing costs
- $5,998
- Reserves months
- —
- Total cash needed
- —
Loan-product check · same deal, 3 products live
Conventional
25% down · 7.5% · 30yr
- Down + closing
- —
- Monthly P&I
- —
- Monthly cashflow
- —
- DSCR
- —
- Eligible?
- —
Personal DTI + credit; lowest rate.
DSCR
20% down · 8.5% · 30yr
- Down + closing
- —
- Monthly P&I
- —
- Monthly cashflow
- —
- DSCR
- —
- Eligible?
- —
No personal income docs; deal must DSCR.
Hard money
10% down · 12.0% · 12mo
- Down + closing
- —
- Monthly P&I
- —
- Monthly cashflow
- —
- DSCR
- —
- Eligible?
- —
Short-term bridge; refi at stabilization.
Rent comps 40 comps
| Address | Beds | Baths | Sqft | Rent | $/sqft | DOM | Units | Dist |
|---|---|---|---|---|---|---|---|---|
| 1708 Baldwin Ave NE Unit A Roanoke, VA | 2.0 | 1.5 | 952 | $1,550 | $1.63 | 44d | 1 | 0.14mi |
| 1824 Eastern Ave NE Roanoke, VA | 2.0 | 1.0 | 863 | $1,200 | $1.39 | 44d | 1 | 0.19mi |
| 321 9th St #6 Vinton, VA | 1.0 | 1.0 | 546 | $696 | $1.27 | 44d | 1 | 0.25mi |
| 1415 15th St NE Roanoke, VA | 1.0 | 1.0 | 566 | $995 | $1.76 | 14d | 1 | 0.28mi |
| 1423 Varnell Ave NE Roanoke, VA | 2.0 | 1.0 | 720 | $1,650 | $2.29 | 14d | 1 | 0.31mi |
| 220 8th St Vinton, VA | 2.0 | 1.0 | 850 | $1,199 | $1.41 | 14d | 1 | 0.39mi |
| 1905 Wise Ave SE Roanoke, VA | 2.0 | 1.0 | 1044 | $1,123 | $1.08 | 14d | 1 | 0.58mi |
| 100 Highland Rd Vinton, VA | 1.0–2.0 | 1.0–2.0 | 665 | $1,195 | $1.80 | 14d | 1 | 0.70mi |
| 339 Cedar Ave Vinton, VA | 2.0 | 1.0 | 830 | $1,200 | $1.45 | 44d | 1 | 0.71mi |
| 916 Kyle Ave NE Roanoke, VA | 2.0 | 1.0 | 642 | $2,250 | $3.50 | 14d | 1 | 0.74mi |
| 233 W Cleveland Ave Vinton, VA | 2.0 | 1.0 | 1270 | $1,250 | $0.98 | 44d | 1 | 0.74mi |
| 1605 Church Ave SE Roanoke, VA | 2.0 | 1.0 | 776 | $1,200 | $1.55 | 14d | 1 | 0.82mi |
| 2101 Fallon Ave SE Roanoke, VA | 1.0 | 1.0 | — | $938 | — | 14d | 1 | 0.87mi |
| 1817 Dale Ave SE Roanoke, VA | 3.0 | 1.0 | 1820 | $2,100 | $1.15 | 44d | 1 | 0.91mi |
| 601 Orange Ave NE Roanoke, VA | 1.0 | 1.0 | 518 | $1,234 | $2.38 | 14d | 9 | 1.01mi |
| 2802 Vinyard Ave NE Unit 2 Roanoke, VA | 2.0 | 1.0 | 950 | $1,295 | $1.36 | 14d | 1 | 1.01mi |
| 2812 Vinyard Ave NE Unit 2 Roanoke, VA | 2.0 | 1.0 | 950 | $1,295 | $1.36 | 22d | 1 | 1.03mi |
| 1016 15th St SE #2 Roanoke, VA | 3.0 | 1.5 | 1084 | $995 | $0.92 | 14d | 1 | 1.08mi |
| 1630 Wayne St NE Roanoke, VA | 1.0 | 1.0 | 750 | $950 | $1.27 | 14d | 1 | 1.08mi |
| 301 E Cleveland Ave Unit 1 Vinton, VA | 1.0 | 1.0 | 650 | $1,050 | $1.62 | 44d | 1 | 1.08mi |
| 1712 Wayne St NE Roanoke, VA | 2.0 | 1.0 | 826 | $1,250 | $1.51 | 22d | 1 | 1.09mi |
| 909 13th St SE Roanoke, VA | 3.0 | 1.0 | 1870 | $1,199 | $0.64 | 44d | 1 | 1.12mi |
| 317 Jefferson Ave Vinton, VA | 2.0 | 1.0 | 980 | $1,525 | $1.56 | 44d | 1 | 1.12mi |
| 2107 Kings Walk Dr NE Roanoke, VA | 3.0 | 2.5 | 2300 | $2,950 | $1.28 | 44d | 1 | 1.13mi |
| 133 10 1/2 St SE Unit B Roanoke, VA | 1.0 | 1.0 | — | $646 | — | 14d | 1 | 1.14mi |
| 2109 Colgate St NE Roanoke, VA | 3.0 | 1.0 | 1240 | $1,700 | $1.37 | 14d | 1 | 1.15mi |
| 3006 Hickory Woods Dr NE Roanoke, VA | 1.0–3.0 | 1.0–2.0 | 922 | $1,608 | $1.74 | 14d | 20 | 1.17mi |
| 410 Jefferson Ave Unit D Vinton, VA | 1.0 | 1.0 | 650 | $900 | $1.38 | 22d | 1 | 1.17mi |
| 922 12th St SE Unit A Roanoke, VA | 2.0 | 1.0 | 800 | $899 | $1.12 | 44d | 1 | 1.20mi |
| 1138 Highland Ave SE Roanoke, VA | 1.0 | 1.0 | 320 | $895 | $2.80 | 14d | 1 | 1.21mi |
| 1015 12th St SE Roanoke, VA | 3.0 | 1.0 | 1072 | $923 | $0.86 | 44d | 1 | 1.24mi |
| 312 Bowman St Unit 212 Vinton, VA | 2.0 | 1.0 | 1246 | $850 | $0.68 | 22d | 1 | 1.24mi |
| 538 Chestnut St Vinton, VA | 1.0 | 1.0 | 675 | $950 | $1.41 | 14d | 1 | 1.25mi |
| 314 Bowman St Vinton, VA | 1.0 | 1.0 | 728 | $1,050 | $1.44 | 44d | 1 | 1.25mi |
| 418 Polk Ave Unit A Vinton, VA | 2.0 | 1.0 | — | $925 | — | 14d | 1 | 1.25mi |
| 1020 Jamison Ave SE Unit 3 Roanoke, VA | 2.0 | 1.0 | — | $1,000 | — | 22d | 1 | 1.26mi |
| 528 E Cleveland Ave Unit 3 Vinton, VA | 2.0 | 1.0 | 787 | $1,475 | $1.87 | 22d | 1 | 1.27mi |
| 528 E Cleveland Ave Unit 8 Vinton, VA | 2.0 | 1.0 | 786 | $1,395 | $1.77 | 44d | 1 | 1.27mi |
| 528 E Cleveland Ave Unit 5 Vinton, VA | 2.0 | 1.0 | 889 | $1,495 | $1.68 | 44d | 1 | 1.27mi |
| 528 E Cleveland Ave Unit 6 Vinton, VA | 2.0 | 1.0 | 875 | $1,525 | $1.74 | 44d | 1 | 1.27mi |
HOA detail condo
- Monthly dues
- $0 · $0/yr
- Likely covers
- electric
- Assessments
- None detected in remarks — confirm with the listing agent.
Listing history 3 events
-
2026-04-18status Pending
-
2026-03-19$199,950 Active
-
2026-03-18historical $199,950
ⓘ Source: listings_history table (triggers on properties + properties_extension) + one-shot
backfill from property_details.listing_events for pre-trigger history.
Climate risk First Street
- Flood 1/10 Low FEMA zone X (unshaded) · 0% chance over 30 yrs
- Wildfire 1/10 Low
- Heat 5/10 Major 7 d/yr ≥101°F today · 18 d/yr by 30 yrs out
- Wind 2/10 Low 100% chance of damaging wind over 30 yrs
- Air quality 2/10 Low 1 unhealthy d/yr today · 1 by 30 yrs out
Nearby sold comps map
Loading sold comps map…
Walkable amenities ~0.75 mi
Loading nearby amenities…
Taxation est. · year 1
- Rental income
- $15,485
- − Mortgage interest
- −$11,200
- − Property taxes
- −$2,999
- − Insurance
- −$1,000
- − Repairs & maintenance
- −$1,239
- − Management
- −$1,239
- − Depreciation
- −$5,817
- Taxable loss
- −$8,009
- Est. tax savings @ 24.0%
- +$1,922
- After-tax cash flow
- $-2,427/yr
For passive investors: Depreciation is non-cash, so a rental often shows a tax loss while cash-flowing — sheltering income. Rental losses are passive: they offset passive income freely, and up to $25,000/yr can offset ordinary (W-2) income if you actively participate and your MAGI is under $100k (phasing out to $0 by $150k); unused losses carry forward. On sale, claimed depreciation is recaptured at up to 25%, and gains may owe capital-gains tax (a 1031 exchange can defer both). Figures are a year-1 estimate at your 24.0% rate — not tax advice; consult a CPA.
Condition & rehab AI · 1 photo
This two-unit property requires moderate renovations to improve its curb appeal and rental potential. Exterior and interior paint jobs, along with siding repairs, would significantly enhance its value.
Repairs flagged
- Major exterior siding — Significant wear and tear
- Major exterior paint — Peeling and general wear
- Major interior paint — Peeling and general wear
Value-add opportunities
- Both exterior paint job — Enhances curb appeal and rental value
- Both interior paint job — Enhances interior appearance and rental value
- Both exterior siding repair — Improves curb appeal and rental value
Renovation cost estimate screening
| Repair item | Severity | Est. cost |
|---|---|---|
| exterior siding · Significant wear and tear | Major | $15,000–50,000 |
| exterior paint · Peeling and general wear | Major | $15,000–50,000 |
| interior paint · Peeling and general wear | Major | $15,000–50,000 |
| Total estimated repair cost · 3 items | $45,000–150,000 |
Value-add ROI direction
- Both exterior paint job — Enhances curb appeal and rental value ↑
- Both interior paint job — Enhances interior appearance and rental value ↑
- Both exterior siding repair — Improves curb appeal and rental value ↑
ⓘ Cost ranges are severity-bucket heuristics (US national rule-of-thumb). Get contractor quotes + a written scope before underwriting a rehab budget.
Schools (NCES district)
- District
- Roanoke City Public School District
- NCES district ID
- 5103300
- Math proficiency
- 40% ▼ -38.00%
- Reading proficiency
- 58% ▼ -12.00%
- Median HH income
- $38,592
- Composite
- 40.8/100
- National rank
- #3639
- State rank
- #102 of 131 in VA
Livability — Roanoke
- Score
- 73/100
- State rank
- #163
- US rank
- #5055
Category grades
Schools grade is shown separately in the Schools card above.
Census & demographics
- Census place
- Roanoke, VA
- County
- Roanoke City · 101,625 people
- City population
- 168,930
- Metro
- Roanoke, VA
- Population (ZIP)
- 28,235
- Household income
- $52,973
- Rent vs Own
- Severe rent burden
- 1360.0
Population outlook (Roanoke County) Hauer SSP2
- Today (2025)
- 106,094 people
- By 2030
- 108,927 · +2.7%
- By 2040
- 114,104 · +7.5%
- By 2050
- 118,032 · +11.3%
- By 2075
- 123,363 · +16.3%
- By 2100
- 116,827 · +10.1%
Race, ethnicity, and origin ACS 2023
- Neighborhood character
- Diverse neighborhood (Simpson 0.59)
- Race & ethnicity
- White 60% Black 16% Hispanic / Latino 14% Two or more races 13% Asian 4%
- Hispanic origin (detail)
- Mexican 4% Dominican 1%
- Common ancestry
- Romanian 2% Slovak 2% Serbian 1%
- Foreign-born
- 11% · Canada, Vietnam, Jamaica
- Languages at home
- 84% English-only · Spanish 11% Other Asian/Pacific 2% Vietnamese 2%
Political lean MEDSL · Roanoke
- 2024 margin
- Strong D (+23.6) · D 61.1% · R 37.5% · Other 1.4%
- 2008→2024 swing
- +0.2pp no change · 2008: 23.4pp · 2024: 23.6pp
- All cycles
- 2024: D+23.6 2020: D+25.8 2016: D+17.6 2012: D+21.5 2008: D+23.4
Not yet ingested
- Civics
- —
Market trends
- HPI YoY
- ▼ -137.94%
- Current HPI
- 186.9007
- Rent YoY
- ▲ 10.46%
- Metro
- Roanoke, VA
- State GDP YoY
- ▲ 2.40%
- F500 in state
- 50
Industry mix (Fortune 500 HQ in VA)
| Industry | F500 HQs | Revenue |
|---|---|---|
| Aerospace / Defense | 4 | $236B |
|
||
| Technology / Defense | 3 | $32B |
|
||
| Financial Services | 2 | $176B |
|
||
| Utilities | 2 | $27B |
|
||
| Insurance | 2 | $25B |
|
||
| Technology | 2 | $15B |
|
||
Price history
+0.0% since first listed3 events — show timeline
- 2026-04-18 Pending — MLSRV
- 2026-03-19 Listed $199,950 MLSRV
- 2026-03-18 Coming Soon $199,950 MLSRV
Cash-flow waterfall
monthlySold comps — $/sqft
last 12 mo · ≤1 miLoading sold comps…