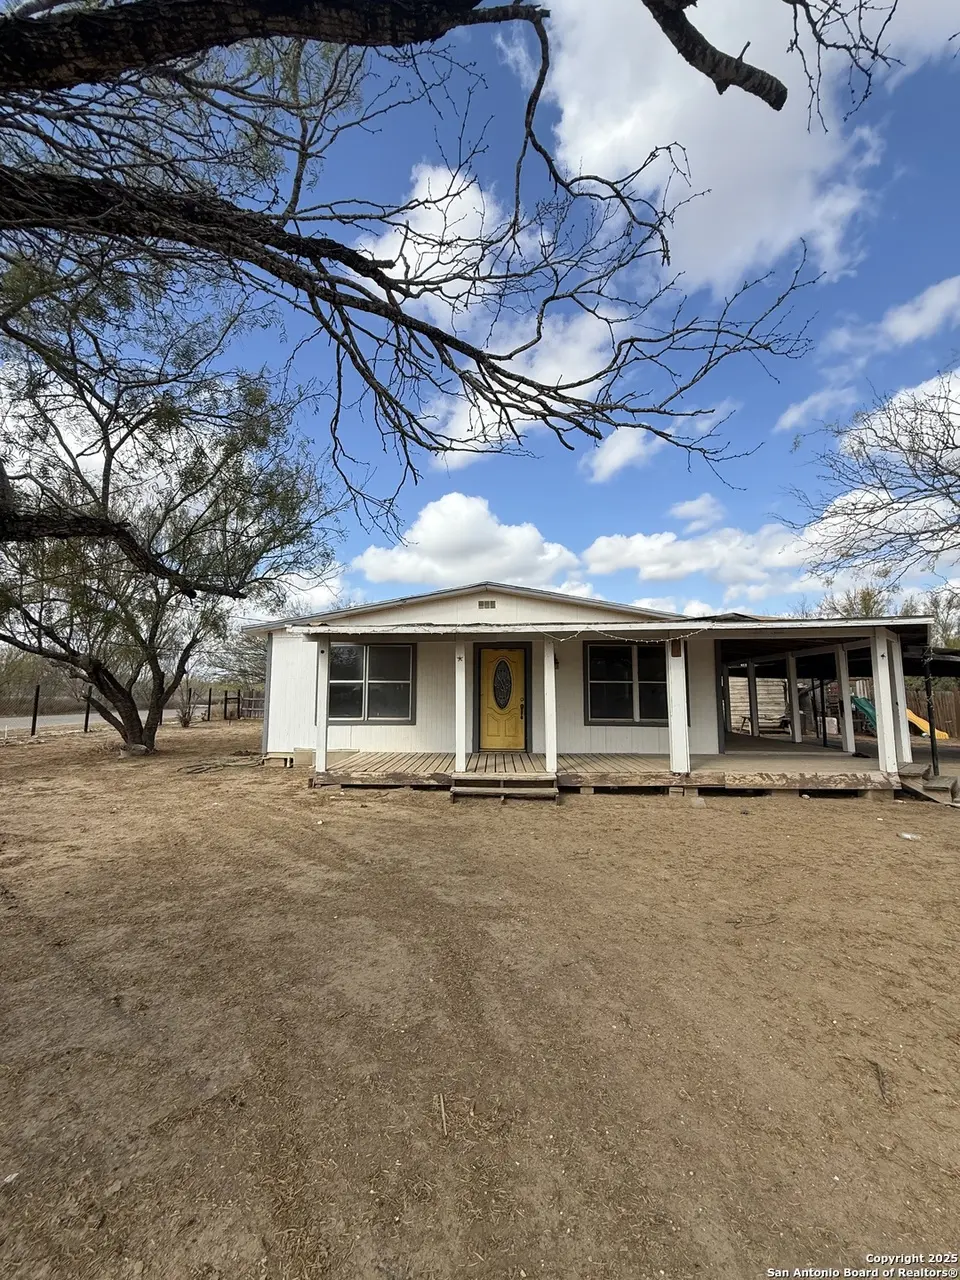
279 Cenizo · Carrizo Hill, TX
Flood risk 1/10 · Minimal
- FEMA flood zone
- X
- Chance of flooding over 30 yrs
- 0.0%
- Est. flood insurance / yr
- $507 – $1,088
Fire risk 6/10 · Moderate
- Est. fire insurance / yr
- $1,222 – $2,270
Heat risk 8/10 · Major
- Hot days now (above 112°F)
- 6 days/yr
- Hot days in 30 yrs
- 20 days/yr
Wind risk 6/10 · Moderate
- Chance of severe wind over 30 yrs
- 68.0%
Air-quality risk 1/10 · Minimal
- Unhealthy air days now
- 0 days/yr
- Unhealthy air days in 30 yrs
- 0 days/yr
Risk factors via First Street. Map © Google.
Why this score? — see what drove the B grade
The composite is a weighted blend of 9 inputs, each scored 0–100. Each bar is that input's sub-score; the figure is the points it added to the 100-point composite (weight × sub-score).
- Cash flow +30.0/30.0
- 1% rule +10.0/10.0
- DSCR +10.0/10.0
- Appreciation +8.3/10.0
- ARV discount +7.5/15.0
- Rent growth +2.5/5.0
- Livability +2.5/5.0
- Condition / age +2.5/5.0
- Schools +1.7/10.0
$60,000
🖨 Deal sheet (PDF) 📄 Offer letter ✓ Due diligence
Listing remarks MLS
Fixer-Upper Investment Opportunity! Three-bedroom, one-bath home situated on a corner lot featuring a pier and beam foundation, covered carport, and a small storage shed. Property needs repairs but offers strong potential for investors or buyers looking to renovate. Cash or owner financing available with down payment; terms negotiable.
Key facts
- Covered carport
- Corner lot
- Small storage shed
Tags
Neighborhood map
What this means for you Summary
Snapshot
- This is a 3-bed/1.0-bath single-family listed at $60k.
Deal economics
- At list price, monthly cash flow is $533 ($6k/yr) — positive.
- The deal already cash-flows at list — no discount required.
- Meets the 1% rule at list price ($1k rent vs $60k).
- Recommended offer: $53k (12.0% below list) — sets the bar for market timing.
Location & tenants
- Location reads 50/100 on livability (#1,500 in TX) — a working-class tenant base; expect higher turnover. Strengths: cost of living A+, crime A; Watch: health & safety C-, schools F, amenities F.
- Carrizo Springs CISD (town): math 17% / reading 25% proficiency, ranked #780 of 826 in TX (top 94%) — low school quality limits family demand, transient renter base, plan for 1-2y turnover; 72% free/reduced lunch — lower-income household profile, screen leases tightly.
- Market conditions: 41 active listings in the ZIP; 4 units permitted in Dimmit County in 2024 (0 in 5+ unit buildings).
Forward outlook
- In year one you build about $4k of equity ($415 loan paydown + $4k appreciation (6.6% local appreciation)).
- Dimmit County population projected at +48% by 2050 — long-run rental-demand tailwind backs the buy-and-hold thesis.
- At projected returns (6.6% appreciation + 3.0% rent growth), your $17k cash investment doubles in ~2 years — after that, you're playing with house money.
- By year 8, paydown + projected appreciation supports a ~$34k cash-out refi (75% LTV) — recoverable capital for the next deal without selling this one.
Negotiation context
- It's been on market 167 days — a 12% lower offer ($53k) is reasonable based on typical stale-listing flexibility.
- 2 sale attempts with the ask held roughly flat each time — persistent listings suggest the price (not the market) is what's stuck; bring a comps-based counter.
Risks & watch-outs
- Climate carrying-cost: major wind risk, 68% chance of damaging wind over 30y; major wildfire risk; extreme-heat days projected 6→20/yr by 2055 (HVAC capex compounding) — expect insurance premiums to compound above CPI over the hold.
Questions for the listing agent
- It's been on market 167 days. Have you received any prior offers? Is the seller open to a 12% concession, seller financing, or rate buy-down credit?
- Why hasn't it sold? Are there any deal-killer items the seller is aware of (foundation, flood, title, zoning, code violations)?
- Is there a deadline driving the sale (1031 exchange, divorce, estate, relocation)? That informs how much negotiation room exists.
- Schools are F-rated, which usually means shorter tenancies and higher turnover. Who's the typical renter profile here, and what's been the actual vacancy rate?
- What's the average days-on-market for RENTAL listings here right now (not sales)? A rising rental-DOM trend means longer vacancies and softer asking-rent achievability than the comps imply.
- What's the recent tenant-quality profile in this submarket — average credit score on applications, eviction rate, late-payment / NSF rate, and stable-employment percentage? A property-management company in the area should have these aggregated.
- How much new for-sale + rental construction is in the pipeline within 1–3 miles? Heavy new supply typically softens prices + rents 12–24 months out; constrained supply supports both.
Investment metrics
- 1% rule
- 2.02% ✓
- Cap rate
- 16.95%
- Cash-on-cash
- 38.06%
- DSCR
- 2.69
- GRM
- 4.1
CMA / ARV
- ARV (median comp)
- $364,577
- List price
- $60,000
- Delta
- -83.54%
- Verdict
- UNDERPRICED
- Comps
- 3 within 1.0 mi
Show comp detail 1 sale within ~0.75 mi
| Address | Dist | Beds/Ba | Sqft | Sold | Price | $/sf | Match |
|---|---|---|---|---|---|---|---|
| 153 Huisache St | 0.14mi | 3/2.0 | 1,475 (-2%) | 23mo | $199,999 | $136 | 68 |
Match score weights: distance 35% · size 25% · config 20% · recency 20%. Top-matched comps best support the ARV.
Projected returns pro-forma
6.59% appreciation · 3.0% rent growth · sell at horizon
- IRR
- 48.8%
- Equity multiple
- 4.18×
- Total profit
- $53,400
- Equity at exit
- $39,965
- IRR
- 45.3%
- Equity multiple
- 8.74×
- Total profit
- $130,068
- Equity at exit
- $74,497
Cash invested: $16,800 (down + closing). Projections, not guarantees.
Landlord ↔ Tenant lean methodology
- Overall (STATE)
- 87 Strongly Landlord-Friendly
- State Texas
- 87 Strongly Landlord-Friendly · R+5
- County
- — inherits STATE
- City
- — inherits STATE
ZIP-level market 78834
- Home prices YoY
- 5.5%
- Active inventory
- 41
- Price-to-rent
- 4.1×
Monthly cashflow live
- Estimated rent
- $1,214 medium interval (Pro) →
- Mortgage (P&I)
- −$315
- Tax from tax record
- −$87 /mo · $1,042/yr
- Insurance
- −$25
- HOA
- −$0
- Vacancy / Maint / Mgmt
- −$255
- Net cashflow
- $533
Break-even live
Sensitivity live
| Price | -10% $567 | -5% $550 | +0% $533 | +5% $516 | +10% $499 |
|---|---|---|---|---|---|
| Rent | -10% $437 | -5% $485 | +0% $533 | +5% $581 | +10% $629 |
| Rate | -1.0pp $563 | -0.5pp $548 | base $533 | +0.5pp $517 | +1.0pp $502 |
UW: 25.0% down · 7.5% · 30yr · 1.5% tax · 5.0% vac · 8.0% maint · 8.0% mgmt
Financing live
Cash to close
- Down payment
- $15,000
- Closing costs
- $1,800
- Reserves months
- —
- Total cash needed
- —
Loan-product check · same deal, 3 products live
Conventional
25% down · 7.5% · 30yr
- Down + closing
- —
- Monthly P&I
- —
- Monthly cashflow
- —
- DSCR
- —
- Eligible?
- —
Personal DTI + credit; lowest rate.
DSCR
20% down · 8.5% · 30yr
- Down + closing
- —
- Monthly P&I
- —
- Monthly cashflow
- —
- DSCR
- —
- Eligible?
- —
No personal income docs; deal must DSCR.
Hard money
10% down · 12.0% · 12mo
- Down + closing
- —
- Monthly P&I
- —
- Monthly cashflow
- —
- DSCR
- —
- Eligible?
- —
Short-term bridge; refi at stabilization.
Listing history 18 events
-
2026-06-19days on market $60,000 Active 167 DOM
-
2026-06-18days on market $60,000 Active 166 DOM
-
2026-06-17days on market $60,000 Active 165 DOM
-
2026-06-16days on market $60,000 Active 164 DOM
-
2026-06-15days on market $60,000 Active 163 DOM
-
2026-06-14days on market $60,000 Active 161 DOM
-
2026-06-13days on market $60,000 Active 160 DOM
-
2026-06-10days on market $60,000 Active 158 DOM
-
2026-06-09days on market $60,000 Active 157 DOM
-
2026-06-08days on market $60,000 Active 156 DOM
-
2026-06-07days on market $60,000 Active 155 DOM
-
2026-06-02days on market $60,000 Active 150 DOM
-
2026-06-01days on market $60,000 Active 149 DOM
-
2026-05-31days on market $60,000 Active 148 DOM
-
2026-05-30days on market $60,000 Active 147 DOM
-
2026-05-07status Back on Market 338-char remark
Show marketing remark (338 chars)
Fixer-Upper Investment Opportunity! Three-bedroom, one-bath home situated on a corner lot featuring a pier and beam foundation, covered carport, and a small storage shed. Property needs repairs but offers strong potential for investors or buyers looking to renovate. Cash or owner financing available with down payment; terms negotiable.
-
2026-05-01historical 338-char remark
Show marketing remark (338 chars)
Fixer-Upper Investment Opportunity! Three-bedroom, one-bath home situated on a corner lot featuring a pier and beam foundation, covered carport, and a small storage shed. Property needs repairs but offers strong potential for investors or buyers looking to renovate. Cash or owner financing available with down payment; terms negotiable.
-
2025-12-29$60,000 New 338-char remark
Show marketing remark (338 chars)
Fixer-Upper Investment Opportunity! Three-bedroom, one-bath home situated on a corner lot featuring a pier and beam foundation, covered carport, and a small storage shed. Property needs repairs but offers strong potential for investors or buyers looking to renovate. Cash or owner financing available with down payment; terms negotiable.
ⓘ Source: listings_history table (triggers on properties + properties_extension) + one-shot
backfill from property_details.listing_events for pre-trigger history.
Tax reassessment forecast TX · Resets to sale price
- Current annual tax
- $1,042 · $87/mo
- Projected year-2 tax
- $1,098 · $92/mo
- Expected delta
- +$56/yr (+$5/mo · 5.4%)
ⓘ Screening estimate from a state-policy table — verify with the county assessor before closing.
Climate risk First Street
- Flood 1/10 Low FEMA zone X · 0% chance over 30 yrs
- Wildfire 6/10 Major
- Heat 8/10 Severe 6 d/yr ≥112°F today · 20 d/yr by 30 yrs out
- Wind 6/10 Major 68% chance of damaging wind over 30 yrs
- Air quality 1/10 Low 0 unhealthy d/yr today · 0 by 30 yrs out
Nearby sold comps map
Loading sold comps map…
Walkable amenities ~0.75 mi
Loading nearby amenities…
Taxation est. · year 1
- Rental income
- $14,572
- − Mortgage interest
- −$3,361
- − Property taxes
- −$1,042
- − Insurance
- −$300
- − Repairs & maintenance
- −$1,166
- − Management
- −$1,166
- − Depreciation
- −$1,745
- Taxable income
- $5,793
- Est. tax owed @ 24.0%
- −$1,390
- After-tax cash flow
- $5,004/yr
For passive investors: Depreciation is non-cash, so a rental often shows a tax loss while cash-flowing — sheltering income. Rental losses are passive: they offset passive income freely, and up to $25,000/yr can offset ordinary (W-2) income if you actively participate and your MAGI is under $100k (phasing out to $0 by $150k); unused losses carry forward. On sale, claimed depreciation is recaptured at up to 25%, and gains may owe capital-gains tax (a 1031 exchange can defer both). Figures are a year-1 estimate at your 24.0% rate — not tax advice; consult a CPA.
Schools (NCES district)
- District
- Carrizo Springs CISD
- NCES district ID
- 4812990
- Math proficiency
- 17% ▼ -22.00%
- Reading proficiency
- 25% ▼ -8.00%
- Median HH income
- $32,354
- Composite
- 17.03/100
- National rank
- #9127
- State rank
- #780 of 826 in TX
Livability — Carrizo Hill
- Score
- 50/100
- State rank
- #1500
- US rank
- #25667
Category grades
Schools grade is shown separately in the Schools card above.
Census & demographics
- Census place
- Carrizo Hill, TX
- Population (ZIP)
- 7,204
Population outlook (Dimmit County) Hauer SSP2
- Today (2025)
- 13,089 people
- By 2030
- 14,217 · +8.6%
- By 2040
- 16,685 · +27.5%
- By 2050
- 19,361 · +47.9%
- By 2075
- 26,356 · +101.4%
- By 2100
- 31,128 · +137.8%
Race, ethnicity, and origin ACS 2023
- Neighborhood character
- Predominantly Hispanic (87%)
- Race & ethnicity
- Hispanic / Latino 87% Two or more races 59% White 10% Native American 1%
- Hispanic origin (detail)
- Mexican 78% Dominican 6%
- Common ancestry
- Italian 1%
- Foreign-born
- 10% · Canada
- Languages at home
- 48% English-only · Spanish 50%
Political lean MEDSL · Dimmit
- 2024 margin
- Toss-up / Even · D 51.5% · R 48.2%
- 2008→2024 swing
- -47.4pp toward R · 2008: 50.7pp · 2024: 3.3pp
- All cycles
- 2024: D+3.3 2020: D+24.0 2016: D+37.2 2012: D+47.3 2008: D+50.7
Not yet ingested
- Civics
- —
Market trends
- HPI YoY
- ▲ 6.59%
- Current HPI
- 127.0655
- Rent YoY
- —
- Metro
- —
- State GDP YoY
- ▲ 3.95%
- F500 in state
- 110
Industry mix (Fortune 500 HQ in TX)
| Industry | F500 HQs | Revenue |
|---|---|---|
| Energy | 16 | $1,198B |
|
||
| Technology | 5 | $198B |
|
||
| Engineering / Construction | 4 | $72B |
|
||
| Energy Services | 3 | $60B |
|
||
| Utilities | 3 | $41B |
|
||
| Healthcare | 2 | $330B |
|
||
Price history
3 events — show timeline
- 2026-05-07 Relisted — LERA
- 2026-05-01 Listing Removed — LERA
- 2025-12-29 Listed $60,000 LERA
Property tax history
+7.4%/yrLatest (2025): $1,042 · +1.3% YoY. Source: county tax records.
Cash-flow waterfall
monthlySold comps — $/sqft
last 12 mo · ≤1 miLoading sold comps…