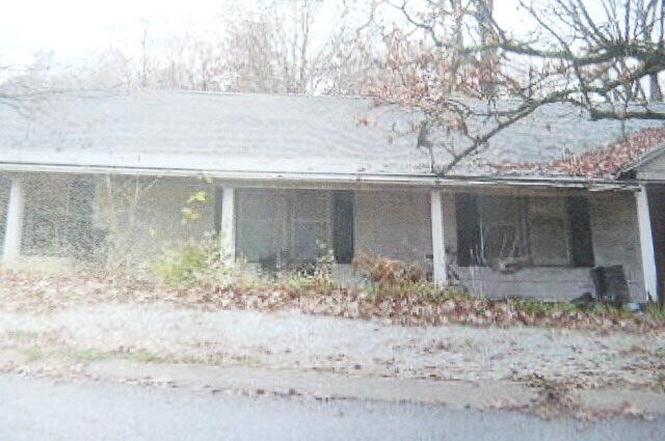
1002 Hearrell St · Neosho, MO
Flood risk 1/10 · Minimal
- FEMA flood zone
- X (unshaded)
- Chance of flooding over 30 yrs
- 0.0%
- Est. flood insurance / yr
- $507 – $1,088
Fire risk 3/10 · Minor
- Est. fire insurance / yr
- $1,054 – $1,958
Heat risk 5/10 · Moderate
- Hot days now (above 106°F)
- 7 days/yr
- Hot days in 30 yrs
- 20 days/yr
Wind risk 2/10 · Minimal
- Chance of severe wind over 30 yrs
- 2.0%
Air-quality risk 2/10 · Minimal
- Unhealthy air days now
- 1 days/yr
- Unhealthy air days in 30 yrs
- 1 days/yr
Risk factors via First Street. Map © Google.
Why this score? — see what drove the B- grade
The composite is a weighted blend of 9 inputs, each scored 0–100. Each bar is that input's sub-score; the figure is the points it added to the 100-point composite (weight × sub-score).
- Cash flow +30.0/30.0
- 1% rule +10.0/10.0
- DSCR +10.0/10.0
- ARV discount +7.5/15.0
- Livability +3.6/5.0
- Schools +3.5/10.0
- Rent growth +2.5/5.0
- Condition / age +2.5/5.0
- Appreciation +0.0/10.0
$46,000
🖨 Deal sheet 📄 Offer letter ✓ Due diligence
Listing remarks
A true fixer-upper opportunity awaits with this property, offered at a price that reflects its potential. The layout includes 3 bedrooms and two bathrooms and two eating area's. There is also an oversized two car detached garage. Its in town location and corner lot make it an atractive find.
Key facts
- 0.29 acre lot
- 2 garage spots
- Built 1940
Property features AI
Finance
- Financial info: Annual tax: $680
Exterior
- Parking: 2-car garage with front-facing garage
- Utilities: Public water; Public sewer
- Home design: Single-family residence; Residential property
- Construction: Composition roof; 1,473 above-grade finished area
- Exterior features: Covered front porch; Has a view; Level lot; City street frontage; Publicly maintained road; Asphalt and concrete road surfaces
Interior
- Bathrooms: 2 full bathrooms
- Heating & cooling: Central air
- Interior features: Insulated windows; Double-pane windows
- Laundry & utility: Laundry on the main level
Neighborhood map
What this means for you Summary
Snapshot
- This is a 3-bed/2.0-bath other listed at $46k.
Deal economics
- At list price, monthly cash flow is $339 ($4k/yr) — positive.
- The deal already cash-flows at list — no discount required.
- Meets the 1% rule at list price ($829 rent vs $46k).
- Recommended offer: $45k (3.0% below list) — sets the bar for market timing.
- Cap rate 15.1% vs local median 2.9% in Neosho — top-decile yield for the area; either an underpriced asset or a hidden risk that comps aren't pricing in. Stress-test before assuming the spread holds.
Location & tenants
- Location reads 71/100 on livability (#103 in MO) — a middle-class / working-renter tenant base. Strengths: cost of living A+, housing A+, health & safety A+; Watch: employment D, amenities F, commute F.
- Neosho School District (town): math 36% / reading 48% proficiency, ranked #125 of 324 in MO (top 39%) — families likely to look elsewhere, expect single-tenant / working-renter base with shorter leases.
- Zoned schools: Benton Elem. (math 34% / reading 40%, grade F, #611 of 1,115 statewide, top 59%, 505 students, 69% FRL); Neosho High (math 21% / reading 57%, grade F, #287 of 521 statewide, top 55%, 1,491 students, 48% FRL).
- Market conditions: 199 active listings in the ZIP; 3 comparable units currently listed for rent nearby; rentals at typical pace (median 21d on market — plan ~3-4 weeks tenant-placement turnaround); 110 units permitted in Newton County in 2024 (40 in 5+ unit buildings).
Forward outlook
- Local home prices are declining (-3.0%/yr); year-one equity from $318 of loan paydown is wiped out by about $1k of value loss. Plan a longer hold.
- Newton County population projected to shrink 7% by 2050 — rents likely to lag national; underwrite the cash flow, not the appreciation.
- At projected returns (-3.0% appreciation + 3.0% rent growth), your $13k cash investment doubles in ~4 years — after that, you're playing with house money.
Negotiation context
- It's been on market 37 days — a 3% lower offer ($45k) is reasonable based on typical stale-listing flexibility.
- 2 sale attempts with the ask held roughly flat each time — persistent listings suggest the price (not the market) is what's stuck; bring a comps-based counter.
Risks & watch-outs
- Watch-outs: built in 1940 — expect roof / HVAC / electrical / plumbing capex.
- Climate carrying-cost: extreme-heat days projected 7→20/yr by 2055 (HVAC capex compounding) — expect insurance premiums to compound above CPI over the hold.
Questions for the listing agent
- It's been on market 37 days. Have you received any prior offers? Is the seller open to a 3% concession, seller financing, or rate buy-down credit?
- Built in 1940 — when were the roof, HVAC, electrical panel, plumbing, and water heater last replaced?
- Is there a deadline driving the sale (1031 exchange, divorce, estate, relocation)? That informs how much negotiation room exists.
- Schools are D-rated, which usually means shorter tenancies and higher turnover. Who's the typical renter profile here, and what's been the actual vacancy rate?
- What's the average days-on-market for RENTAL listings here right now (not sales)? A rising rental-DOM trend means longer vacancies and softer asking-rent achievability than the comps imply.
- What's the recent tenant-quality profile in this submarket — average credit score on applications, eviction rate, late-payment / NSF rate, and stable-employment percentage? A property-management company in the area should have these aggregated.
- How much new for-sale + rental construction is in the pipeline within 1–3 miles? Heavy new supply typically softens prices + rents 12–24 months out; constrained supply supports both.
Investment metrics
- 1% rule
- 1.80% ✓
- Cap rate
- 15.14%
- Cash-on-cash
- 31.61%
- DSCR
- 2.41
- GRM
- 4.6
CMA / ARV
No comps found within radius.
Projected returns pro-forma
-3.0% appreciation · 3.0% rent growth · sell at horizon
- IRR
- 26.5%
- Equity multiple
- 2.10×
- Total profit
- $14,167
- Equity at exit
- $6,859
- IRR
- 34.1%
- Equity multiple
- 4.12×
- Total profit
- $40,207
- Equity at exit
- $3,977
Cash invested: $12,880 (down + closing). Projections, not guarantees.
Landlord ↔ Tenant lean methodology
- Overall (STATE)
- 81 Strongly Landlord-Friendly
- State Missouri
- 81 Strongly Landlord-Friendly · R+10
- County
- — inherits STATE
- City
- — inherits STATE
ZIP-level market 64850
- Home prices YoY
- -5.1%
- Active inventory
- 199
- Price-to-rent
- 4.6×
Monthly cashflow live
- Estimated rent
- $829 medium interval (Pro) →
- Mortgage (P&I)
- −$241
- Tax from tax record
- −$55 /mo · $659/yr
- Insurance
- −$19
- HOA
- −$0
- Vacancy / Maint / Mgmt
- −$174
- Net cashflow
- $339
Break-even live
UW: 25.0% down · 7.5% · 30yr · 1.5% tax · 5.0% vac · 8.0% maint · 8.0% mgmt
Financing live
Cash to close
- Down payment
- $11,500
- Closing costs
- $1,380
- Reserves months
- —
- Total cash needed
- —
Loan-product check · same deal, 3 products live
Conventional
25% down · 7.5% · 30yr
- Down + closing
- —
- Monthly P&I
- —
- Monthly cashflow
- —
- DSCR
- —
- Eligible?
- —
Personal DTI + credit; lowest rate.
DSCR
20% down · 8.5% · 30yr
- Down + closing
- —
- Monthly P&I
- —
- Monthly cashflow
- —
- DSCR
- —
- Eligible?
- —
No personal income docs; deal must DSCR.
Hard money
10% down · 12.0% · 12mo
- Down + closing
- —
- Monthly P&I
- —
- Monthly cashflow
- —
- DSCR
- —
- Eligible?
- —
Short-term bridge; refi at stabilization.
Rent comps 3 comps
| Address | Beds | Baths | Sqft | Rent | $/sqft | DOM | Units | Dist |
|---|---|---|---|---|---|---|---|---|
| 320 E Hickory St Neosho, MO | 2.0 | 1.0 | 1400 | $850 | $0.61 | 21d | 1 | 0.57mi |
| PRV Neosho, MO | 3.0 | 2.0 | 1408 | $760 | $0.54 | 14d | 1 | 0.73mi |
| 316 Wheeler St Neosho, MO | 3.0 | 1.0 | 1414 | $900 | $0.64 | 23d | 1 | 1.25mi |
Listing history 4 events
-
2026-04-29status Pending
-
2026-04-10status Active
-
2026-03-27status Pending
-
2026-03-06$46,000 Active
ⓘ Source: listings_history table (triggers on properties + properties_extension) + one-shot
backfill from property_details.listing_events for pre-trigger history.
Tax reassessment forecast MO · Resets to sale price
- Current annual tax
- $659 · $55/mo
- Projected year-2 tax
- $659 · $55/mo
- Expected delta
- $0/yr ($0/mo · 0.0%)
ⓘ Screening estimate from a state-policy table — verify with the county assessor before closing.
Climate risk First Street
- Flood 1/10 Low FEMA zone X (unshaded) · 0% chance over 30 yrs
- Wildfire 3/10 Moderate
- Heat 5/10 Major 7 d/yr ≥106°F today · 20 d/yr by 30 yrs out
- Wind 2/10 Low 2% chance of damaging wind over 30 yrs
- Air quality 2/10 Low 1 unhealthy d/yr today · 1 by 30 yrs out
Nearby sold comps map
Loading sold comps map…
Walkable amenities ~0.75 mi
Loading nearby amenities…
Taxation est. · year 1
- Rental income
- $9,944
- − Mortgage interest
- −$2,577
- − Property taxes
- −$659
- − Insurance
- −$230
- − Repairs & maintenance
- −$796
- − Management
- −$796
- − Depreciation
- −$1,338
- Taxable income
- $3,549
- Est. tax owed @ 24.0%
- −$852
- After-tax cash flow
- $3,220/yr
For passive investors: Depreciation is non-cash, so a rental often shows a tax loss while cash-flowing — sheltering income. Rental losses are passive: they offset passive income freely, and up to $25,000/yr can offset ordinary (W-2) income if you actively participate and your MAGI is under $100k (phasing out to $0 by $150k); unused losses carry forward. On sale, claimed depreciation is recaptured at up to 25%, and gains may owe capital-gains tax (a 1031 exchange can defer both). Figures are a year-1 estimate at your 24.0% rate — not tax advice; consult a CPA.
Schools (NCES district)
- District
- Neosho School District
- NCES district ID
- 2921810
- Math proficiency
- 36% ▬ 0.00%
- Reading proficiency
- 48% ▲ 2.00%
- Median HH income
- $40,574
- Composite
- 35.21/100
- National rank
- #4987
- State rank
- #125 of 324 in MO
Livability — Neosho
- Score
- 71/100
- State rank
- #103
- US rank
- #6875
Category grades
Schools grade is shown separately in the Schools card above.
Census & demographics
- Census place
- Neosho, MO
- Population (ZIP)
- 25,355
Population outlook (Newton County) Hauer SSP2
- Today (2025)
- 59,151 people
- By 2030
- 58,961 · -0.3%
- By 2040
- 57,609 · -2.6%
- By 2050
- 54,775 · -7.4%
- By 2075
- 46,140 · -22.0%
- By 2100
- 34,348 · -41.9%
Race, ethnicity, and origin ACS 2023
- Neighborhood character
- Predominantly White (77%)
- Race & ethnicity
- White 77% Two or more races 12% Hispanic / Latino 9% Pacific Islander 2% Native American 2% Asian 2% Black 1%
- Hispanic origin (detail)
- Mexican 5%
- Common ancestry
- Slovak 2% Italian 1% Scottish 1%
- Foreign-born
- 6% · Canada
- Languages at home
- 90% English-only · Spanish 6% Other Asian/Pacific 3%
Political lean MEDSL · Newton
- 2024 margin
- Solid R (+58.6) · D 20.2% · R 78.8% · Other 1.0%
- 2008→2024 swing
- -18.5pp toward R · 2008: -40.1pp · 2024: -58.6pp
- All cycles
- 2024: R+58.6 2020: R+57.4 2016: R+58.7 2012: R+46.9 2008: R+40.1
Not yet ingested
- Civics
- —
Market trends
- HPI YoY
- ▼ -15.98%
- Current HPI
- 295.9911
- Rent YoY
- —
- Metro
- —
- State GDP YoY
- ▲ 1.84%
- F500 in state
- 20
Industry mix (Fortune 500 HQ in MO)
| Industry | F500 HQs | Revenue |
|---|---|---|
| Healthcare | 1 | $163B |
|
||
| Insurance | 1 | $21B |
|
||
| Industrial Technology | 1 | $17B |
|
||
| Retail | 1 | $16B |
|
||
| Industrial Distribution | 1 | $10B |
|
||
| Utilities | 1 | $9B |
|
||
Price history
4 events — show timeline
- 2026-04-29 Pending — SOMO
- 2026-04-10 Relisted — SOMO
- 2026-03-27 Pending — SOMO
- 2026-03-06 Listed $46,000 SOMO
Property tax history
+2.1%/yrLatest (2025): $659 · +10.2% YoY. Source: county tax records.
Cash-flow waterfall
monthlySold comps — $/sqft
last 12 mo · ≤1 miLoading sold comps…