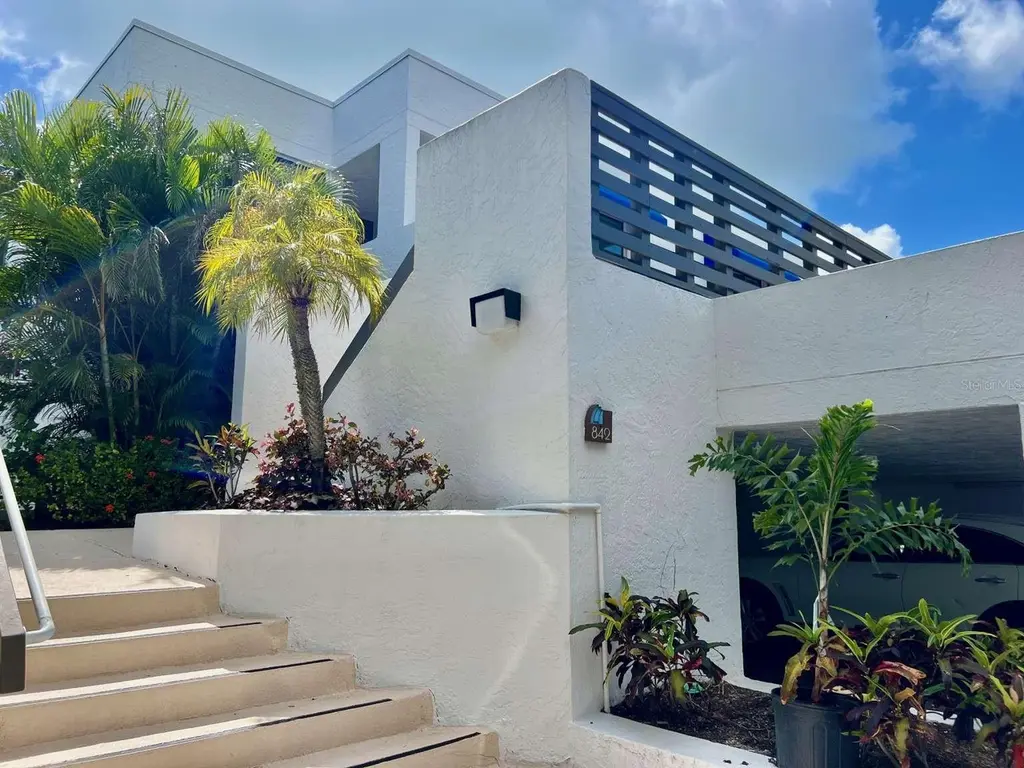
843 Bayport Way #843 · Longboat Key, FL
Flood risk 9/10 · Severe
- FEMA flood zone
- AE
- Chance of flooding over 30 yrs
- 0.99%
- Est. flood insurance / yr
- $1,737 – $8,500
Fire risk 1/10 · Minimal
- Est. fire insurance / yr
- $947 – $1,759
Heat risk 10/10 · Severe
- Hot days now (above 106°F)
- 7 days/yr
- Hot days in 30 yrs
- 29 days/yr
Wind risk 10/10 · Severe
- Chance of severe wind over 30 yrs
- 99.0%
Air-quality risk 2/10 · Minimal
- Unhealthy air days now
- 1 days/yr
- Unhealthy air days in 30 yrs
- 2 days/yr
Risk factors via First Street. Map © Google.
Why this score? — see what drove the D grade
The composite is a weighted blend of 9 inputs, each scored 0–100. Each bar is that input's sub-score; the figure is the points it added to the 100-point composite (weight × sub-score).
- ARV discount +15.0/15.0
- Appreciation +5.4/10.0
- Schools +5.4/10.0
- Cash flow +4.9/30.0
- 1% rule +3.8/10.0
- Livability +3.2/5.0
- Rent growth +2.5/5.0
- Condition / age +2.5/5.0
- DSCR +0.0/10.0
$670,000
🖨 Deal sheet 📄 Offer letter ✓ Due diligence
Listing remarks
This exceptionally clean and well maintained 2-bedroom, 2-bath residence in Bayport Beach and Tennis Club is offered turnkey (with a few exclusions), ready for immediate enjoyment. Currently the lowest-priced unit in the community, it also presents a rare opportunity for a new owner to customize and renovate at their own pace—adding personal style while building value. Ideally positioned as a bright and private second-floor end unit with no neighbors above, this home is filled with natural light. Kitchen, dining, living room open design with split bedrooms for privacy. The primary suite features a walk-in closet and a dedicated office niche—perfect for today’s work-from-ho
Key facts
- $1,978 HOA
- Parking
- Community pool
Property features AI
Finance
- Other: Turnkey furnished; Irrigation equipment included
- Financial info: Lease restrictions apply
- HOA & community: Has HOA (monthly fees required); Monthly condo fee $1,978; Total monthly fees $1,978; Total annual fees $23,736; Association amenities: clubhouse, fitness center, pool, tennis and shuffleboard courts, storage, trails, maintenance, recreational facilities; Association fee includes: cable TV, internet, insurance, management, maintenance (structure & grounds), pest control, private road maintenance, sewer, trash, water, escrow reserves and fidelity bond; Buyer approval required for association; Pets allowed (cats and dogs, number limit); Community features: fitness center, irrigation with reclaimed water, pool, sidewalks, street lights, no truck/RV/motorcycle parking; Full-time management
Exterior
- Parking: Assigned covered parking; Ground-level parking; Guest parking; 1-car carport
- Security: Fire alarm; Key card entry; Security lights
- Utilities: Public water; Public sewer; Electricity connected; Cable connected; Fiber optics available; BB/HS internet available; Underground utilities; Fire hydrant; Sprinkler recycled; Water connected; Sewer connected
- Home design: Residential condominium; Attached property; One story (single level); Faces east; On waterfront with deeded bay/harbor and beach access
- Construction: Block construction; Membrane roof; Crawlspace foundation; Building F-1
- Exterior features: Covered, enclosed and screened rear porch; Deck; Awning(s); Outdoor lighting; Outdoor grill; Outdoor shower; Tennis court(s); Child-safety pool fence; Heated in-ground pool; Fishing pier; Near golf course; Near marina; Near public transit; Private setting; Sidewalk; Street dead-end; Paved roads; Mature landscaping with bamboo and trees
Interior
- Kitchen: Cooktop; Range; Range hood; Microwave; Dishwasher; Disposal; Refrigerator; Freezer; Ice maker; Stone counters
- Bedrooms: 2 bedrooms
- Flooring: Tile flooring
- Bathrooms: 2 full bathrooms
- Heating & cooling: Central heating (electric); Exhaust fan; Central air conditioning
- Interior features: Eat-in kitchen; Kitchen and family room combo; Living and dining room combo; Open floorplan; Stone counters; Thermostat; Walk-in closets; Window treatments; Double-pane windows; Shades
- Laundry & utility: Washer; Dryer; Electric water heater; Inside laundry
Neighborhood map
What this means for you Summary
Snapshot
- This is a 2-bed/2.0-bath condo listed at $670k.
Deal economics
- At list price, monthly cash flow is $-2k ($-25k/yr) — negative.
- To cash-flow at today's rent, offer at most $309k (53.8% below list).
- To meet the 1% rule (rent ≥ 1% of price), the offer needs to be $588k (12.3% below list).
- Recommended offer: $309k (53.8% below list) — sets the bar for cash-flow.
- Cap rate 3.4% vs local median 0.5% in Longboat Key — top-decile yield for the area; either an underpriced asset or a hidden risk that comps aren't pricing in. Stress-test before assuming the spread holds.
Location & tenants
- Location reads 64/100 on livability (#693 in FL) — a middle-class / working-renter tenant base. Strengths: crime A+, employment A+; Watch: schools C-, housing C-, amenities F.
- Sarasota (urban): math 63% / reading 63% proficiency, ranked #7 of 73 in FL (top 10%) — acceptable for families but not a draw, mixed tenant base, ~2y average lease.
- Market conditions: 539 active listings in the ZIP; 5 comparable units currently listed for rent nearby; rentals at typical pace (median 24d on market — plan ~3-4 weeks tenant-placement turnaround); high-income renter base; 7,466 units permitted in Sarasota County in 2024 (2,138 in 5+ unit buildings).
- This rent runs 45% of the median local income ($158k/yr) — at the standard rent-burdened threshold; future hikes will face affordability resistance.
Forward outlook
- In year one you build about $10k of equity ($5k loan paydown + $5k appreciation (0.7% local appreciation)).
- Sarasota County population projected at +20% by 2050 — long-run rental-demand tailwind backs the buy-and-hold thesis.
- By year 5, paydown + projected appreciation supports a ~$46k cash-out refi (75% LTV) — recoverable capital for the next deal without selling this one.
Negotiation context
- It's been on market 44 days — a 3% lower offer ($650k) is reasonable based on typical stale-listing flexibility.
- 6 sale attempts since 20y ago with the ask held roughly flat each time — persistent listings suggest the price (not the market) is what's stuck; bring a comps-based counter.
- Current owner paid $408k; list at $670k implies a 64% gain — meaningful room to come down on a strong offer.
Risks & watch-outs
- Watch-outs: flood insurance adds $427/mo; HOA is 34% of rent.
- Climate carrying-cost: in FEMA flood zone AE (mandatory federal flood insurance); severe wind risk, 99% chance of damaging wind over 30y; extreme-heat days projected 7→29/yr by 2055 (HVAC capex compounding) — expect insurance premiums to compound above CPI over the hold.
Questions for the listing agent
- What do current leases actually rent for vs. the listed asking? Can we see a recent rent roll and the last 12 months of T-12 income?
- It's been on market 44 days. Have you received any prior offers? Is the seller open to a 54% concession, seller financing, or rate buy-down credit?
- What's the actual annual flood-insurance premium (NFIP or private), and is the property in a SFHA with mandatory coverage?
- What does the HOA fee cover, when was the last increase, and are there any pending special assessments or reserve-fund shortfalls?
- Any open or pending special assessments — roof, HVAC, plumbing, elevator, façade? What's the per-unit balance and payoff schedule, and is the seller paying it off at close or rolling it to the buyer?
- Is there a deadline driving the sale (1031 exchange, divorce, estate, relocation)? That informs how much negotiation room exists.
- The area grade is low — what's the realistic commute time and amenity access for the typical tenant pool here? Any planned neighborhood developments (good or bad) we should know about?
- What's the average days-on-market for RENTAL listings here right now (not sales)? A rising rental-DOM trend means longer vacancies and softer asking-rent achievability than the comps imply.
- What's the recent tenant-quality profile in this submarket — average credit score on applications, eviction rate, late-payment / NSF rate, and stable-employment percentage? A property-management company in the area should have these aggregated.
- How much new apartment / multifamily construction is in the pipeline within 1–3 miles? Heavy new supply (>2% of stock underway) typically softens rents 12–24 months out; light construction supports rent growth.
Investment metrics
- 1% rule
- 0.88% ✗
- Cap rate
- 3.40%
- Cash-on-cash
- -10.33%
- DSCR
- 0.54
- GRM
- 9.5
CMA / ARV
- ARV (median comp)
- $806,136
- List price
- $670,000
- Delta
- -16.89%
- Verdict
- UNDERPRICED
- Comps
- 20 within 1.0 mi
Projected returns pro-forma
0.73% appreciation · 3.0% rent growth · sell at horizon
- IRR
- -13.5%
- Equity multiple
- 0.33×
- Total profit
- $-125,032
- Equity at exit
- $219,286
- IRR
- -7.0%
- Equity multiple
- 0.17×
- Total profit
- $-155,817
- Equity at exit
- $284,246
Cash invested: $187,600 (down + closing). Projections, not guarantees.
Landlord ↔ Tenant lean methodology
- Overall (STATE)
- 87 Strongly Landlord-Friendly
- State Florida
- 87 Strongly Landlord-Friendly · R+3
- County
- — inherits STATE
- City
- — inherits STATE
ZIP-level market 34228
- Home prices YoY
- 0.3%
- Active inventory
- 539
- Price-to-rent
- 9.5×
Monthly cashflow live
- Estimated rent
- $5,876 high interval (Pro) →
- Mortgage (P&I)
- −$3,514
- Tax from tax record
- −$487 /mo · $5,838/yr
- Insurance
- −$279
- Flood insurance flood zone
- −$427 /mo · $5,118/yr
- HOA
- −$1,978
- Vacancy / Maint / Mgmt
- −$1,234
- Net cashflow
- $-2,042
Break-even live
UW: 25.0% down · 7.5% · 30yr · 1.5% tax · 5.0% vac · 8.0% maint · 8.0% mgmt
Financing live
Cash to close
- Down payment
- $167,500
- Closing costs
- $20,100
- Reserves months
- —
- Total cash needed
- —
Loan-product check · same deal, 3 products live
Conventional
25% down · 7.5% · 30yr
- Down + closing
- —
- Monthly P&I
- —
- Monthly cashflow
- —
- DSCR
- —
- Eligible?
- —
Personal DTI + credit; lowest rate.
DSCR
20% down · 8.5% · 30yr
- Down + closing
- —
- Monthly P&I
- —
- Monthly cashflow
- —
- DSCR
- —
- Eligible?
- —
No personal income docs; deal must DSCR.
Hard money
10% down · 12.0% · 12mo
- Down + closing
- —
- Monthly P&I
- —
- Monthly cashflow
- —
- DSCR
- —
- Eligible?
- —
Short-term bridge; refi at stabilization.
Rent comps 5 comps
| Address | Beds | Baths | Sqft | Rent | $/sqft | DOM | Units | Dist |
|---|---|---|---|---|---|---|---|---|
| 4325 Gulf of Mexico Dr Longboat Key, FL | 2.0–3.0 | 2.0–2.5 | 1373 | $5,500 | $4.00 | 15d | 3 | 0.71mi |
| 4485 Gulf of Mexico Dr #2 Longboat Key, FL | 3.0 | 2.0 | 1576 | $10,500 | $6.66 | 23d | 1 | 0.92mi |
| 4340 Falmouth Dr Longboat Key, FL | 2.0 | 2.0 | 1330 | $3,000 | $2.26 | 23d | 1 | 0.99mi |
| 4420 Exeter Dr #208 Longboat Key, FL | 2.0 | 2.0 | 1168 | $4,900 | $4.20 | 23d | 1 | 1.00mi |
| 4825 Gulf of Mexico Dr #201 Longboat Key, FL | 2.0 | 2.0 | 1393 | $7,800 | $5.60 | 23d | 1 | 1.48mi |
HOA detail condo
- Monthly dues
- $1,978 · $23,736/yr
- Assessments
- None detected in remarks — confirm with the listing agent.
Listing history 33 events
-
2026-06-18days on market $670,000 Active 44 DOM
-
2026-06-17days on market $670,000 Active 43 DOM
-
2026-06-16days on market $670,000 Active 42 DOM
-
2026-06-15days on market $670,000 Active 41 DOM
-
2026-06-13days on market $670,000 Active 39 DOM
-
2026-06-13days on market $670,000 Active 38 DOM
-
2026-06-10days on market $670,000 Active 36 DOM
-
2026-06-09days on market $670,000 Active 35 DOM
-
2026-06-08days on market $670,000 Active 34 DOM
-
2026-06-08days on market $670,000 Active 33 DOM
-
2026-06-05days on market $670,000 Active 30 DOM
-
2026-06-03days on market $670,000 Active 29 DOM
-
2026-06-02days on market $670,000 Active 28 DOM
-
2026-06-01days on market $670,000 Active 27 DOM
-
2026-05-31days on market $670,000 Active 26 DOM
-
2026-05-05$670,000 Active 1900-char remark
-
2024-05-02historical
-
2023-10-17price $699,000
-
2023-07-24price $725,000
-
2023-05-03$795,000 Active
-
2021-02-12soldstatus $407,500
-
2019-12-28historical
-
2019-09-24price $439,900
-
2019-05-25price $445,000
-
2019-05-01price $450,000
-
2019-03-16status Active
-
2018-12-28historical
-
2018-10-31$464,000 Active
-
2014-04-15soldstatus $325,000 Sold
-
2014-04-15soldstatus $325,000
-
2013-12-06$359,500
-
2006-02-27$625,000
-
1988-05-13soldstatus $105,000
ⓘ Source: listings_history table (triggers on properties + properties_extension) + one-shot
backfill from property_details.listing_events for pre-trigger history.
Tax reassessment forecast FL · Resets to sale price
- Current annual tax
- $5,838 · $487/mo
- Projected year-2 tax
- $5,838 · $487/mo
- Expected delta
- $0/yr ($0/mo · 0.0%)
ⓘ Screening estimate from a state-policy table — verify with the county assessor before closing.
Climate risk First Street
- Flood 9/10 Extreme FEMA zone AE · 99% chance over 30 yrs
- Wildfire 1/10 Low
- Heat 10/10 Extreme 7 d/yr ≥106°F today · 29 d/yr by 30 yrs out
- Wind 10/10 Extreme 99% chance of damaging wind over 30 yrs
- Air quality 2/10 Low 1 unhealthy d/yr today · 2 by 30 yrs out
Nearby sold comps map
Loading sold comps map…
Walkable amenities ~0.75 mi
Loading nearby amenities…
Taxation est. · year 1
- Rental income
- $70,513
- − Mortgage interest
- −$37,530
- − Property taxes
- −$5,838
- − Insurance
- −$8,468
- − Repairs & maintenance
- −$5,641
- − Management
- −$5,641
- − HOA
- −$23,736
- − Depreciation
- −$19,491
- Taxable loss
- −$35,834
- Est. tax savings @ 24.0%
- +$8,600
- After-tax cash flow
- $-15,900/yr
For passive investors: Depreciation is non-cash, so a rental often shows a tax loss while cash-flowing — sheltering income. Rental losses are passive: they offset passive income freely, and up to $25,000/yr can offset ordinary (W-2) income if you actively participate and your MAGI is under $100k (phasing out to $0 by $150k); unused losses carry forward. On sale, claimed depreciation is recaptured at up to 25%, and gains may owe capital-gains tax (a 1031 exchange can defer both). Figures are a year-1 estimate at your 24.0% rate — not tax advice; consult a CPA.
Schools (NCES district)
- District
- Sarasota
- NCES district ID
- 1201680
- Math proficiency
- 63% ▼ -8.00%
- Reading proficiency
- 63% ▼ -3.00%
- Median HH income
- $51,167
- Composite
- 53.68/100
- National rank
- #1428
- State rank
- #7 of 73 in FL
Livability — Longboat Key
- Score
- 64/100
- State rank
- #693
- US rank
- #14452
Category grades
Schools grade is shown separately in the Schools card above.
Census & demographics
- Census place
- Longboat Key, FL
- County
- Sarasota County · 448,376 people
- City population
- 7,539
- Metro
- North Port-Sarasota-Bradenton, FL
- Population (ZIP)
- 7,539
- Household income
- $158,030
- Rent vs Own
- Severe rent burden
- 98.0
Population outlook (Sarasota County) Hauer SSP2
- Today (2025)
- 452,380 people
- By 2030
- 474,175 · +4.8%
- By 2040
- 511,577 · +13.1%
- By 2050
- 541,467 · +19.7%
- By 2075
- 604,947 · +33.7%
- By 2100
- 621,965 · +37.5%
Race, ethnicity, and origin ACS 2023
- Neighborhood character
- Predominantly White (93%)
- Race & ethnicity
- White 93% Hispanic / Latino 4% Two or more races 3% Asian 1%
- Common ancestry
- Scotch-Irish 7% Romanian 6% Lithuanian 4%
- Foreign-born
- 14% · Canada, China
- Languages at home
- 92% English-only · Spanish 2% Other Indo-European 2% German/W. Germanic 2%
Political lean MEDSL · Sarasota
- 2024 margin
- R (+18.2) · D 40.5% · R 58.7%
- 2008→2024 swing
- -18.1pp toward R · 2008: -0.1pp · 2024: -18.2pp
- All cycles
- 2024: R+18.2 2020: R+10.4 2016: R+11.6 2012: R+7.4 2008: R+0.1
Not yet ingested
- Civics
- —
Market trends
- HPI YoY
- ▲ 0.73%
- Current HPI
- 234.5017
- Rent YoY
- —
- Metro
- North Port-Sarasota-Bradenton, FL
- State GDP YoY
- ▲ 3.28%
- F500 in state
- 36
Industry mix (Fortune 500 HQ in FL)
| Industry | F500 HQs | Revenue |
|---|---|---|
| Industrial Technology | 2 | $29B |
|
||
| Insurance | 2 | $17B |
|
||
| Retail | 1 | $60B |
|
||
| Technology Distribution | 1 | $58B |
|
||
| Homebuilding | 1 | $35B |
|
||
| Technology Manufacturing | 1 | $35B |
|
||
Price history
+538.1% since first listed18 events — show timeline
- 2026-05-05 Listed $670,000 Stellar MLS as Distributed by MLS Grid
- 2024-05-02 Listing Removed — Stellar MLS as Distributed by MLS Grid
- 2023-10-17 Price Changed $699,000 Stellar MLS as Distributed by MLS Grid
- 2023-07-24 Price Changed $725,000 Stellar MLS as Distributed by MLS Grid
- 2023-05-03 Listed $795,000 Stellar MLS as Distributed by MLS Grid
- 2021-02-12 Sold (Public Records) $407,500 Public Records
- 2019-12-28 Listing Removed — Stellar MLS as Distributed by MLS Grid
- 2019-09-24 Price Changed $439,900 Stellar MLS as Distributed by MLS Grid
- 2019-05-25 Price Changed $445,000 Stellar MLS as Distributed by MLS Grid
- 2019-05-01 Price Changed $450,000 Stellar MLS as Distributed by MLS Grid
- 2019-03-16 Relisted — Stellar MLS as Distributed by MLS Grid
- 2018-12-28 Listing Removed — Stellar MLS as Distributed by MLS Grid
- 2018-10-31 Listed $464,000 Stellar MLS as Distributed by MLS Grid
- 2014-04-15 Sold (Public Records) $325,000 Public Records
- 2014-04-15 Sold (MLS) $325,000 Stellar MLS as Distributed by MLS Grid
- 2013-12-06 Listed $359,500 Stellar MLS as Distributed by MLS Grid
- 2006-02-27 Listed $625,000 Stellar MLS as Distributed by MLS Grid
- 1988-05-13 Sold (Public Records) $105,000 Public Records
Property tax history
+4.2%/yrLatest (2025): $5,838 · -5.0% YoY. Source: county tax records.
Cash-flow waterfall
monthlySold comps — $/sqft
last 12 mo · ≤1 miLoading sold comps…