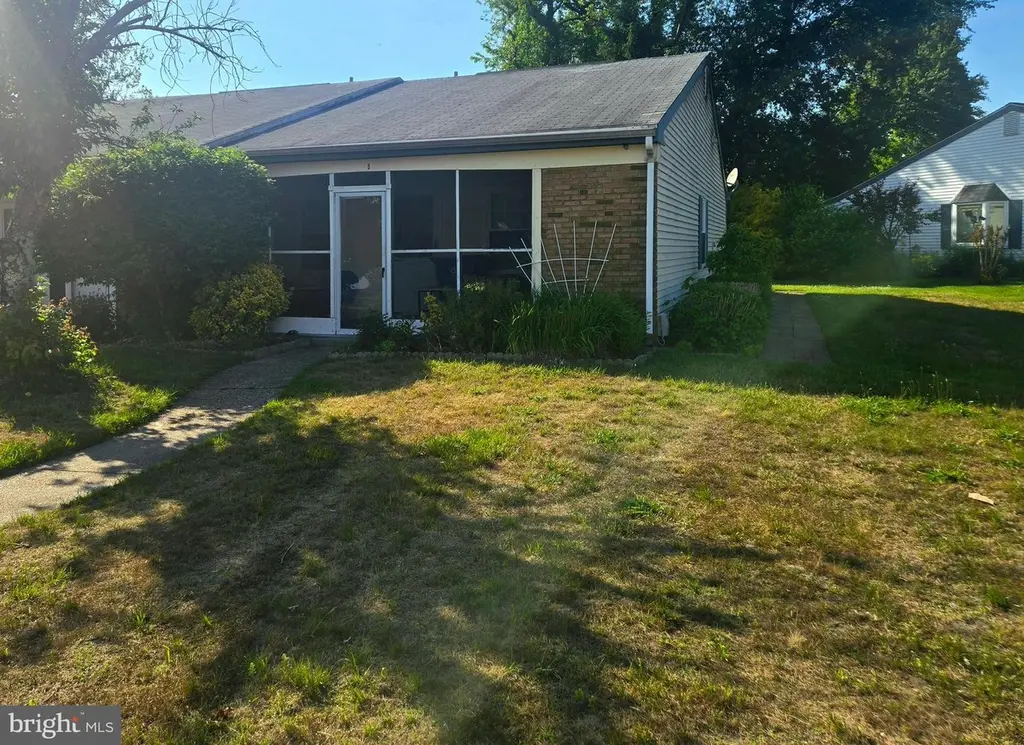
135 Huntington Dr · Leisuretowne, NJ
Flood risk 1/10 · Minimal
- FEMA flood zone
- X (unshaded)
- Chance of flooding over 30 yrs
- 0.0%
- Est. flood insurance / yr
- $507 – $1,088
Fire risk 5/10 · Moderate
- Est. fire insurance / yr
- $526 – $976
Heat risk 7/10 · Major
- Hot days now (above 103°F)
- 7 days/yr
- Hot days in 30 yrs
- 15 days/yr
Wind risk 6/10 · Moderate
- Chance of severe wind over 30 yrs
- 61.0%
Air-quality risk 4/10 · Minor
- Unhealthy air days now
- 4 days/yr
- Unhealthy air days in 30 yrs
- 5 days/yr
Risk factors via First Street. Map © Google.
Why this score? — see what drove the C grade
The composite is a weighted blend of 9 inputs, each scored 0–100. Each bar is that input's sub-score; the figure is the points it added to the 100-point composite (weight × sub-score).
- Cash flow +21.3/30.0
- ARV discount +13.0/15.0
- DSCR +6.8/10.0
- 1% rule +5.7/10.0
- Schools +4.5/10.0
- Livability +2.9/5.0
- Rent growth +2.5/5.0
- Condition / age +2.5/5.0
- Appreciation +0.0/10.0
$185,000
🖨 Deal sheet 📄 Offer letter ✓ Due diligence
Listing remarks MLS
Neutral & clean. 2BR, 1BA. End unit townhome in Leisuretowne. Nice carpeting, large closets and new windows. Screened in front porch w/ storage shed. Great price, come see it today. Being sold "AS IS".
Key facts
- $90 HOA
- Parking
- Community pool
Property features AI
Finance
- HOA & community: Monthly HOA fee of $90; HOA covers snow removal, trash, and management; Community outdoor pool
Exterior
- Parking: Driveway parking (1 space); One total garage/parking space
- Utilities: Public water; Public sewer; Electric service
- Home design: Semi-detached; Pitched roof; Single-story entry (main living on one level); Located in a 55+ senior community
- Construction: Aluminum siding; Slab foundation; Estimated year built
- Exterior features: Corner lot; Sidewalks; Street lights; Porch(es); Community pool
Interior
- Kitchen: Kitchen
- Bedrooms: Two bedrooms on the main level; Master bedroom
- Bathrooms: One full bathroom (on the main level)
- Heating & cooling: Baseboard electric heat; Central air conditioning; Electric hot water
- Interior features: Estimated living area; Attic
- Laundry & utility: Main floor laundry
Neighborhood map
What this means for you Summary
Snapshot
- This is a 2-bed/1.0-bath townhouse listed at $185k.
Deal economics
- At list price, monthly cash flow is $269 ($3k/yr) — positive.
- The deal already cash-flows at list — no discount required.
- Meets the 1% rule at list price ($2k rent vs $185k).
- Recommended offer: $182k (1.5% below list) — sets the bar for market timing.
- Cap rate 8.0% vs local median 4.2% in Leisuretowne — top-decile yield for the area; either an underpriced asset or a hidden risk that comps aren't pricing in. Stress-test before assuming the spread holds.
Location & tenants
- Location reads 57/100 on livability (#516 in NJ) — a working-class tenant base; expect higher turnover. Strengths: crime A+, housing A+, cost of living A-; Watch: schools F, amenities F, commute F.
- Lenape Regional High School District (suburban): math 34% / reading 60% proficiency, ranked #136 of 472 in NJ (top 29%) — families likely to look elsewhere, expect single-tenant / working-renter base with shorter leases.
- Market conditions: 156 active listings in the ZIP; 3 comparable units currently listed for rent nearby; rentals leasing fast (median 1d on market — plan ~1-2 weeks tenant-placement turnaround); 2,161 units permitted in Burlington County in 2024 (988 in 5+ unit buildings).
Forward outlook
- Local home prices are declining (-3.0%/yr); year-one equity from $1k of loan paydown is wiped out by about $6k of value loss. Plan a longer hold.
- Burlington County population projected to shrink 5% by 2050 — rents likely to lag national; underwrite the cash flow, not the appreciation.
Negotiation context
- It's been on market 15 days — a 2% lower offer ($182k) is reasonable based on typical stale-listing flexibility.
- 2 sale attempts since 26y ago; this cycle's ask is 61% above the opening price — seller raised mid-cycle; expect resistance to lowballs.
- Current owner paid $115k; list at $185k implies a 61% gain — meaningful room to come down on a strong offer.
Risks & watch-outs
- Climate carrying-cost: major wind risk, 61% chance of damaging wind over 30y; moderate wildfire risk; extreme-heat days projected 7→15/yr by 2055 (HVAC capex compounding) — expect insurance premiums to compound above CPI over the hold.
Questions for the listing agent
- Built in 1976 — when were the roof, HVAC, electrical panel, plumbing, and water heater last replaced?
- What does the HOA fee cover, when was the last increase, and are there any pending special assessments or reserve-fund shortfalls?
- Is there a deadline driving the sale (1031 exchange, divorce, estate, relocation)? That informs how much negotiation room exists.
- Schools are F-rated, which usually means shorter tenancies and higher turnover. Who's the typical renter profile here, and what's been the actual vacancy rate?
- What's the average days-on-market for RENTAL listings here right now (not sales)? A rising rental-DOM trend means longer vacancies and softer asking-rent achievability than the comps imply.
- What's the recent tenant-quality profile in this submarket — average credit score on applications, eviction rate, late-payment / NSF rate, and stable-employment percentage? A property-management company in the area should have these aggregated.
- How much new for-sale + rental construction is in the pipeline within 1–3 miles? Heavy new supply typically softens prices + rents 12–24 months out; constrained supply supports both.
Investment metrics
- 1% rule
- 1.07% ✓
- Cap rate
- 8.04%
- Cash-on-cash
- 6.24%
- DSCR
- 1.28
- GRM
- 7.8
CMA / ARV
- ARV (on-the-fly)
- $210,496
- Comps found
- 4
Show comp detail 4 sales within ~0.75 mi
| Address | Dist | Beds/Ba | Sqft | Sold | Price | $/sf | Match |
|---|---|---|---|---|---|---|---|
| 72 Kingston Way | 0.19mi | 2/1.0 | 1,012 (0%) | 7mo | $180,000 | $178 | 85 |
| 148 Huntington Dr | 0.06mi | 2/1.0 | 1,012 (0%) | 15mo | $238,450 | $236 | 84 |
| 6 Gramercy Pl | 0.17mi | 2/1.0 | 1,012 (0%) | 12mo | $210,000 | $208 | 82 |
| 14 Kingston Way | 0.34mi | 2/1.0 | 1,012 (0%) | 3mo | $204,000 | $202 | 82 |
Match score weights: distance 35% · size 25% · config 20% · recency 20%. Top-matched comps best support the ARV.
Projected returns pro-forma
-3.0% appreciation · 3.0% rent growth · sell at horizon
- IRR
- -6.7%
- Equity multiple
- 0.75×
- Total profit
- $-12,779
- Equity at exit
- $27,584
- IRR
- 3.0%
- Equity multiple
- 1.21×
- Total profit
- $11,119
- Equity at exit
- $15,995
Cash invested: $51,800 (down + closing). Projections, not guarantees.
Landlord ↔ Tenant lean methodology
- Overall (STATE)
- 21 Tenant-Leaning
- State New Jersey
- 21 Tenant-Leaning · D+6
- County
- — inherits STATE
- City
- — inherits STATE
ZIP-level market 08088
- Active inventory
- 156
- Price-to-rent
- 7.8×
Monthly cashflow live
- Estimated rent
- $1,972 medium interval (Pro) →
- Mortgage (P&I)
- −$970
- Tax from tax record
- −$151 /mo · $1,817/yr
- Insurance
- −$77
- HOA
- −$90
- Vacancy / Maint / Mgmt
- −$414
- Net cashflow
- $269
Break-even live
UW: 25.0% down · 7.5% · 30yr · 1.5% tax · 5.0% vac · 8.0% maint · 8.0% mgmt
Financing live
Cash to close
- Down payment
- $46,250
- Closing costs
- $5,550
- Reserves months
- —
- Total cash needed
- —
Loan-product check · same deal, 3 products live
Conventional
25% down · 7.5% · 30yr
- Down + closing
- —
- Monthly P&I
- —
- Monthly cashflow
- —
- DSCR
- —
- Eligible?
- —
Personal DTI + credit; lowest rate.
DSCR
20% down · 8.5% · 30yr
- Down + closing
- —
- Monthly P&I
- —
- Monthly cashflow
- —
- DSCR
- —
- Eligible?
- —
No personal income docs; deal must DSCR.
Hard money
10% down · 12.0% · 12mo
- Down + closing
- —
- Monthly P&I
- —
- Monthly cashflow
- —
- DSCR
- —
- Eligible?
- —
Short-term bridge; refi at stabilization.
Rent comps 3 comps
| Address | Beds | Baths | Sqft | Rent | $/sqft | DOM | Units | Dist |
|---|---|---|---|---|---|---|---|---|
| 9 Narberth Pl Southampton, NJ | 2.0 | 1.0 | 984 | $2,100 | $2.13 | 1d | 1 | 0.12mi |
| 62 Kingston Way Southampton, NJ | 1.0 | 1.0 | 782 | $1,500 | $1.92 | 1d | 1 | 0.18mi |
| 42 Chatham Pl Southampton, NJ | 2.0 | 2.0 | 1360 | $2,500 | $1.84 | 2d | 1 | 0.40mi |
HOA detail
- Monthly dues
- $90 · $1,080/yr
Listing history 13 events
-
2026-06-18days on market $185,000 Active 15 DOM
-
2026-06-17days on market $185,000 Active 14 DOM
-
2026-06-16days on market $185,000 Active 13 DOM
-
2026-06-15days on market $185,000 Active 12 DOM
-
2026-06-13days on market $185,000 Active 10 DOM
-
2026-06-13pricedays on market $185,000 Active 9 DOM
-
2026-06-09days on market $190,000 Active 6 DOM
-
2026-06-08days on market $190,000 Active 5 DOM
-
2026-06-07days on market $190,000 Active 4 DOM
-
2026-06-04statusdays on market $190,000 Active 1 DOM
-
2026-06-03days on market $190,000 Coming Soon 2 DOM
-
2026-06-02remarks 398-char remark
-
2026-06-02$190,000 Coming Soon 1 DOM
ⓘ Source: listings_history table (triggers on properties + properties_extension) + one-shot
backfill from property_details.listing_events for pre-trigger history.
Tax reassessment forecast NJ · Partial reset (capped growth)
- Current annual tax
- $1,817 · $151/mo
- Projected year-2 tax
- $3,212 · $268/mo
- Expected delta
- +$1,395/yr (+$116/mo · 76.7%)
ⓘ Screening estimate from a state-policy table — verify with the county assessor before closing.
Climate risk First Street
- Flood 1/10 Low FEMA zone X (unshaded) · 0% chance over 30 yrs
- Wildfire 5/10 Major
- Heat 7/10 Severe 7 d/yr ≥103°F today · 15 d/yr by 30 yrs out
- Wind 6/10 Major 61% chance of damaging wind over 30 yrs
- Air quality 4/10 Moderate 4 unhealthy d/yr today · 5 by 30 yrs out
Nearby sold comps map
Loading sold comps map…
Walkable amenities ~0.75 mi
Loading nearby amenities…
Taxation est. · year 1
- Rental income
- $23,668
- − Mortgage interest
- −$10,363
- − Property taxes
- −$1,817
- − Insurance
- −$925
- − Repairs & maintenance
- −$1,893
- − Management
- −$1,893
- − HOA
- −$1,080
- − Depreciation
- −$5,382
- Taxable income
- $314
- Est. tax owed @ 24.0%
- −$75
- After-tax cash flow
- $3,158/yr
For passive investors: Depreciation is non-cash, so a rental often shows a tax loss while cash-flowing — sheltering income. Rental losses are passive: they offset passive income freely, and up to $25,000/yr can offset ordinary (W-2) income if you actively participate and your MAGI is under $100k (phasing out to $0 by $150k); unused losses carry forward. On sale, claimed depreciation is recaptured at up to 25%, and gains may owe capital-gains tax (a 1031 exchange can defer both). Figures are a year-1 estimate at your 24.0% rate — not tax advice; consult a CPA.
Schools (NCES district)
- District
- Lenape Regional High School District
- NCES district ID
- 3408490
- Math proficiency
- 34% ▼ -2.00%
- Reading proficiency
- 60% ▼ -5.00%
- Median HH income
- $98,739
- Composite
- 44.86/100
- National rank
- #2724
- State rank
- #136 of 472 in NJ
Livability — Leisuretowne
- Score
- 57/100
- State rank
- #516
- US rank
- #21971
Category grades
Schools grade is shown separately in the Schools card above.
Census & demographics
- Census place
- Leisuretowne, NJ
- Population (ZIP)
- 24,153
Population outlook (Burlington County) Hauer SSP2
- Today (2025)
- 453,425 people
- By 2030
- 452,359 · -0.2%
- By 2040
- 445,033 · -1.9%
- By 2050
- 431,760 · -4.8%
- By 2075
- 406,277 · -10.4%
- By 2100
- 364,732 · -19.6%
Race, ethnicity, and origin ACS 2023
- Neighborhood character
- Predominantly White (90%)
- Race & ethnicity
- White 90% Hispanic / Latino 4% Two or more races 4% Asian 2% Black 1%
- Common ancestry
- Romanian 8% Slovak 2% Iranian 2%
- Foreign-born
- 4% · Canada, China
- Languages at home
- 94% English-only · Spanish 3% Chinese 1%
Political lean MEDSL · Burlington
- 2024 margin
- D (+16.6) · D 57.6% · R 41.0% · Other 1.3%
- 2008→2024 swing
- -2.0pp toward R · 2008: 18.6pp · 2024: 16.6pp
- All cycles
- 2024: D+16.6 2020: D+19.5 2016: D+14.8 2012: D+18.7 2008: D+18.6
Not yet ingested
- Civics
- —
Market trends
- HPI YoY
- ▼ -214.45%
- Current HPI
- 302.9094
- Rent YoY
- —
- Metro
- —
- State GDP YoY
- ▲ 2.05%
- F500 in state
- 34
Industry mix (Fortune 500 HQ in NJ)
| Industry | F500 HQs | Revenue |
|---|---|---|
| Consumer Goods | 3 | $31B |
|
||
| Pharmaceuticals | 2 | $153B |
|
||
| Technology | 2 | $21B |
|
||
| Insurance | 2 | $20B |
|
||
| Healthcare | 2 | $19B |
|
||
| Financial Services | 1 | $70B |
|
||
Price history
+261.9% since first listed11 events — show timeline
- 2026-06-02 Coming Soon $190,000 BRIGHT MLS
- 2007-08-31 Sold (Public Records) $115,000 Public Records
- 2007-08-17 Sold (MLS) $115,000 BRIGHT MLS
- 2007-06-22 Listing Removed — BRIGHT MLS
- 2007-05-31 Listed $115,000 BRIGHT MLS
- 2000-08-09 Sold (Public Records) $55,500 Public Records
- 2000-06-30 Sold (MLS) $55,500 BRIGHT MLS
- 2000-05-19 Listing Removed — BRIGHT MLS
- 2000-05-19 Listed $55,500 BRIGHT MLS
- 1998-05-06 Sold (Public Records) $46,000 Public Records
- 1991-07-02 Sold (Public Records) $52,500 Public Records
Property tax history
+0.7%/yrLatest (2025): $1,817 · +1.6% YoY. Source: county tax records.
Cash-flow waterfall
monthlySold comps — $/sqft
last 12 mo · ≤1 miLoading sold comps…