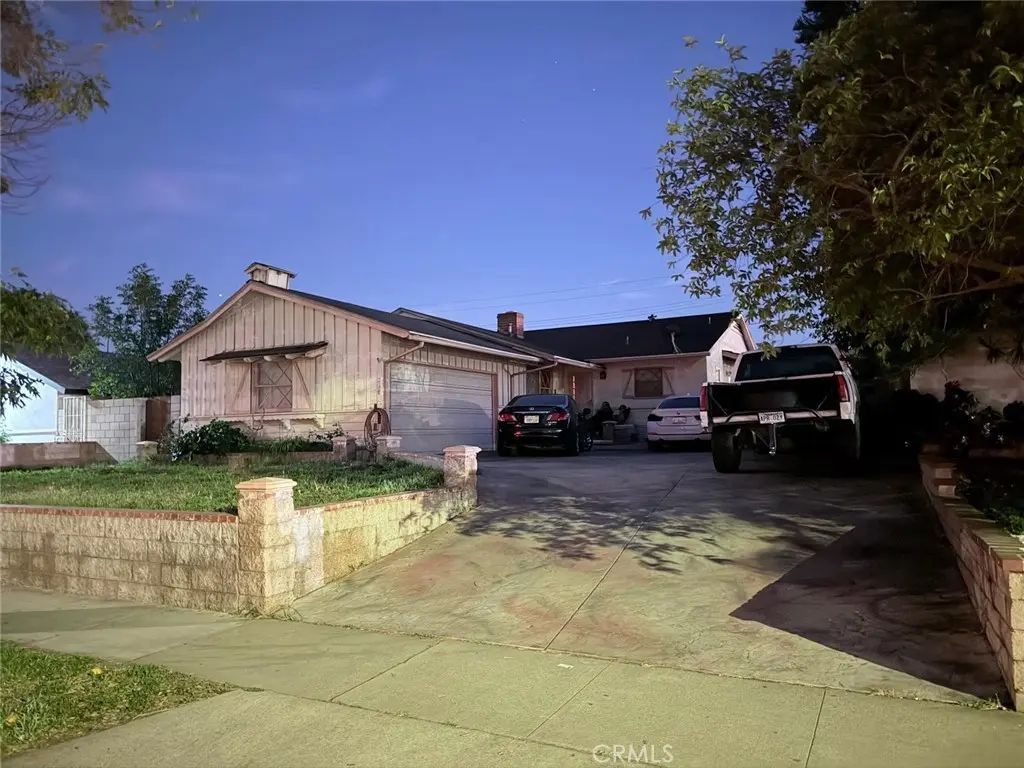
1068 W 10th · Corona, CA
Flood risk 1/10 · Minimal
- FEMA flood zone
- X (shaded)
- Chance of flooding over 30 yrs
- 0.0%
- Est. flood insurance / yr
- $507 – $1,088
Fire risk 2/10 · Minimal
- Est. fire insurance / yr
- $659 – $1,223
Heat risk 6/10 · Moderate
- Hot days now (above 100°F)
- 7 days/yr
- Hot days in 30 yrs
- 19 days/yr
Wind risk 1/10 · Minimal
- Chance of severe wind over 30 yrs
- —
Air-quality risk 9/10 · Severe
- Unhealthy air days now
- 19 days/yr
- Unhealthy air days in 30 yrs
- 23 days/yr
Risk factors via First Street. Map © Google.
Why this score? — see what drove the D grade
The composite is a weighted blend of 9 inputs, each scored 0–100. Each bar is that input's sub-score; the figure is the points it added to the 100-point composite (weight × sub-score).
- ARV discount +15.0/15.0
- Cash flow +10.1/30.0
- Schools +5.1/10.0
- Livability +3.2/5.0
- DSCR +2.9/10.0
- Rent growth +2.9/5.0
- Condition / age +2.5/5.0
- 1% rule +1.7/10.0
- Appreciation +0.0/10.0
$525,000
🖨 Deal sheet (PDF) 📄 Offer letter ✓ Due diligence
Listing remarks MLS
Investor Opportunity, Fixer Upper in Corona. Great opportunity for investors, flippers, or buyers looking to renovate and add value. This property offers strong upside potential in an established neighborhood with convenient access to schools, shopping, dining, and major commuter routes. The home is in fixer condition and is ideal for a full renovation or value-add project. The lot provides ample space and flexibility for upgrades, landscaping, and outdoor improvements. Whether you are looking for your next flip project, or a property to customize to your own style, this home presents a great opportunity to build equity. Bring your contractor and your imagination. Property is being sold AS-IS. Buyer to verify all information, permits, and property details.
Key facts
- Convenient access
- Ample space
- Outdoor improvements
Tags
Neighborhood map
What this means for you Summary
Snapshot
- This is a 3-bed/1.5-bath single-family listed at $525k.
Deal economics
- At list price, monthly cash flow is $-311 ($-4k/yr) — negative.
- To cash-flow at today's rent, offer at most $470k (10.5% below list).
- To meet the 1% rule (rent ≥ 1% of price), the offer needs to be $350k (33.3% below list).
- Recommended offer: $350k (33.3% below list) — sets the bar for 1% rule.
- Cap rate 5.6% vs local median 2.9% in Corona — top-decile yield for the area; either an underpriced asset or a hidden risk that comps aren't pricing in. Stress-test before assuming the spread holds.
Location & tenants
- Location reads 63/100 on livability (#461 in CA) — a middle-class / working-renter tenant base. Strengths: employment A+, housing A-; Watch: commute C-, health & safety D, amenities F.
- Corona-Norco Unified (suburban): math 46% / reading 61% proficiency, ranked #312 of 1,400 in CA (top 22%) — acceptable for families but not a draw, mixed tenant base, ~2y average lease.
- Zoned schools: Jefferson Elementary (596 students, 95% FRL); Letha Raney Intermediate (660 students, 89% FRL); Corona High (2,251 students, 86% FRL) — zoned schools average 90% FRL vs 35% district-wide (55 pts higher); higher-poverty schools than district average — tighter screening recommended.
- Market conditions: Rents rising (+1.4%/yr); 124 active listings in the ZIP; 30 comparable units currently listed for rent nearby; rentals at typical pace (median 26d on market — plan ~3-4 weeks tenant-placement turnaround); solid renter incomes; 9,195 units permitted in Riverside County in 2024 (1,512 in 5+ unit buildings).
- This rent runs 40% of the median local income ($104k/yr) — at the standard rent-burdened threshold; future hikes will face affordability resistance.
Forward outlook
- Local home prices are declining (-3.0%/yr); year-one equity from $4k of loan paydown is wiped out by about $16k of value loss. Plan a longer hold.
- Riverside County population projected at +22% by 2050 — long-run rental-demand tailwind backs the buy-and-hold thesis.
Negotiation context
- It's been on market 68 days — a 6% lower offer ($494k) is reasonable based on typical stale-listing flexibility.
- 5 sale attempts with the ask held roughly flat each time — persistent listings suggest the price (not the market) is what's stuck; bring a comps-based counter.
- Current owner paid $16k; list at $525k implies a 3287% gain — meaningful room to come down on a strong offer.
Risks & watch-outs
- Watch-outs: built in 1956 — expect roof / HVAC / electrical / plumbing capex.
- Climate carrying-cost: extreme-heat days projected 7→19/yr by 2055 (HVAC capex compounding) — expect insurance premiums to compound above CPI over the hold.
Questions for the listing agent
- What do current leases actually rent for vs. the listed asking? Can we see a recent rent roll and the last 12 months of T-12 income?
- It's been on market 68 days. Have you received any prior offers? Is the seller open to a 33% concession, seller financing, or rate buy-down credit?
- Built in 1956 — when were the roof, HVAC, electrical panel, plumbing, and water heater last replaced?
- Why hasn't it sold? Are there any deal-killer items the seller is aware of (foundation, flood, title, zoning, code violations)?
- Is there a deadline driving the sale (1031 exchange, divorce, estate, relocation)? That informs how much negotiation room exists.
- Schools are B-rated — typically a magnet for longer-tenancy family renters. What's the average tenant stay here, and is there a school-zone premium baked into asking?
- The area grade is low — what's the realistic commute time and amenity access for the typical tenant pool here? Any planned neighborhood developments (good or bad) we should know about?
- What's the average days-on-market for RENTAL listings here right now (not sales)? A rising rental-DOM trend means longer vacancies and softer asking-rent achievability than the comps imply.
- What's the recent tenant-quality profile in this submarket — average credit score on applications, eviction rate, late-payment / NSF rate, and stable-employment percentage? A property-management company in the area should have these aggregated.
- How much new for-sale + rental construction is in the pipeline within 1–3 miles? Heavy new supply typically softens prices + rents 12–24 months out; constrained supply supports both.
Investment metrics
- 1% rule
- 0.67% ✗
- Cap rate
- 5.58%
- Cash-on-cash
- -2.54%
- DSCR
- 0.89
- GRM
- 12.5
CMA / ARV
- ARV (median comp)
- $642,937
- List price
- $525,000
- Delta
- -18.34%
- Verdict
- UNDERPRICED
- Comps
- 20 within 1.0 mi
Show comp detail 12 sales within ~0.75 mi
| Address | Dist | Beds/Ba | Sqft | Sold | Price | $/sf | Match |
|---|---|---|---|---|---|---|---|
| 911 W 10th | 0.27mi | 3/1.0 | 1,350 (-3%) | 1mo | $600,000 | $444 | 80 |
| 951 W Kendall | 0.34mi | 3/2.0 | 1,398 (+1%) | 1mo | $839,000 | $600 | 80 |
| 1020 W 10th St | 0.12mi | 3/2.0 | 1,250 (-10%) | 0mo | $492,000 | $394 | 76 |
| 1221 W 10th St | 0.24mi | 4/2.0 (+1) | 1,443 (+4%) | 2mo | $740,000 | $513 | 74 |
| 1407 Opal St | 0.39mi | 3/2.0 | 1,511 (+9%) | 9mo | $675,000 | $447 | 58 |
| 506 W Olive St | 0.68mi | 2/2.0 (-1) | 1,404 (+1%) | 2mo | $661,000 | $471 | 57 |
| 924 Lorna St | 0.59mi | 3/2.0 | 1,291 (-7%) | 3mo | $600,000 | $465 | 56 |
| 1440 fox Run | 0.55mi | 3/2.0 | 1,242 (-10%) | 6mo | $650,000 | $523 | 50 |
| 920 Burr St | 0.49mi | 4/2.0 (+1) | 1,248 (-10%) | 7mo | $641,984 | $514 | 48 |
| 1463 Moore Cir | 0.65mi | 4/2.0 (+1) | 1,312 (-5%) | 8mo | $655,000 | $499 | 47 |
| 1478 Dyer | 0.72mi | 4/2.0 (+1) | 1,312 (-5%) | 7mo | $700,000 | $534 | 45 |
| 1193 Miller Cir | 0.63mi | 4/2.0 (+1) | 1,536 (+11%) | 2mo | $735,000 | $479 | 44 |
Match score weights: distance 35% · size 25% · config 20% · recency 20%. Top-matched comps best support the ARV.
Projected returns pro-forma
-3.0% appreciation · 1.45% rent growth · sell at horizon
- IRR
- -22.0%
- Equity multiple
- 0.25×
- Total profit
- $-110,518
- Equity at exit
- $78,279
- IRR
- -19.7%
- Equity multiple
- 0.02×
- Total profit
- $-144,257
- Equity at exit
- $45,392
Cash invested: $147,000 (down + closing). Projections, not guarantees.
Landlord ↔ Tenant lean methodology
- Overall (STATE)
- 18 Strongly Tenant-Friendly
- State California
- 18 Strongly Tenant-Friendly · D+13
- County
- — inherits STATE
- City
- — inherits STATE
ZIP-level market 92882
- Rents YoY
- 1.4%
- Active inventory
- 124
- Price-to-rent
- 12.5×
Monthly cashflow live
- Estimated rent
- $3,499 high interval (Pro) →
- Mortgage (P&I)
- −$2,753
- Tax from tax record
- −$103 /mo · $1,240/yr
- Insurance
- −$219
- HOA
- −$0
- Vacancy / Maint / Mgmt
- −$735
- Net cashflow
- $-311
Break-even live
Sensitivity live
| Price | -10% $-13 | -5% $-162 | +0% $-311 | +5% $-459 | +10% $-608 |
|---|---|---|---|---|---|
| Rent | -10% $-587 | -5% $-449 | +0% $-311 | +5% $-172 | +10% $-34 |
| Rate | -1.0pp $-46 | -0.5pp $-177 | base $-311 | +0.5pp $-447 | +1.0pp $-585 |
UW: 25.0% down · 7.5% · 30yr · 1.5% tax · 5.0% vac · 8.0% maint · 8.0% mgmt
Financing live
Cash to close
- Down payment
- $131,250
- Closing costs
- $15,750
- Reserves months
- —
- Total cash needed
- —
Loan-product check · same deal, 3 products live
Conventional
25% down · 7.5% · 30yr
- Down + closing
- —
- Monthly P&I
- —
- Monthly cashflow
- —
- DSCR
- —
- Eligible?
- —
Personal DTI + credit; lowest rate.
DSCR
20% down · 8.5% · 30yr
- Down + closing
- —
- Monthly P&I
- —
- Monthly cashflow
- —
- DSCR
- —
- Eligible?
- —
No personal income docs; deal must DSCR.
Hard money
10% down · 12.0% · 12mo
- Down + closing
- —
- Monthly P&I
- —
- Monthly cashflow
- —
- DSCR
- —
- Eligible?
- —
Short-term bridge; refi at stabilization.
Rent comps 30 comps
| Address | Beds | Baths | Sqft | Rent | $/sqft | DOM | Units | Dist |
|---|---|---|---|---|---|---|---|---|
| 901 S Smith Ave Corona, CA | 2.0 | 2.0 | 985 | $1,950 | $1.98 | 45d | 1 | 0.50mi |
| 604 W 10th St Unit 1 Corona, CA | 3.0 | 2.0 | 1450 | $2,595 | $1.79 | 18d | 1 | 0.55mi |
| 1242 D St Corona, CA | 4.0 | 2.0 | 1246 | $2,995 | $2.40 | 16d | 1 | 0.57mi |
| 1704 Lorraine Dr Unit 2 Corona, CA | 3.0 | 2.0 | 1176 | $3,599 | $3.06 | 45d | 1 | 0.76mi |
| 1734 Lorraine Dr Unit 2 Corona, CA | 3.0 | 2.0 | 1176 | $3,649 | $3.10 | 45d | 1 | 0.78mi |
| 1700 Via Pacifica Corona, CA | 3.0 | 1.0–2.0 | 900 | $3,299 | $3.67 | 0d | 26 | 0.78mi |
| 1705 Lorraine Ave Corona, CA | 3.0 | 2.0 | 1429 | $4,349 | $3.04 | 45d | 1 | 0.78mi |
| 1258 Biltmore Cir Corona, CA | 4.0 | 3.0 | 1761 | $3,900 | $2.21 | 26d | 1 | 0.80mi |
| 680 Susanne St Unit 2 Corona, CA | 3.0 | 2.0 | 1176 | $3,599 | $3.06 | 0d | 1 | 0.80mi |
| 1735 Lorraine Dr Unit 2 Corona, CA | 3.0 | 2.0 | 1176 | $3,869 | $3.29 | 45d | 1 | 0.81mi |
| 662 Susanne St Corona, CA | 4.0 | 2.5 | 1631 | $4,249 | $2.61 | 45d | 1 | 0.81mi |
| 662 Susanne St Unit 2 Corona, CA | 3.0 | 2.0 | 1176 | $3,669 | $3.12 | 45d | 1 | 0.81mi |
| 639 W Citron St Corona, CA | 3.0 | 2.0 | 1429 | $4,099 | $2.87 | 45d | 1 | 0.81mi |
| 629 Citron St Unit 2 Corona, CA | 3.0 | 2.0 | 1176 | $3,639 | $3.09 | 26d | 1 | 0.82mi |
| 619 W Citron St Corona, CA | 4.0 | 2.5 | 1631 | $4,289 | $2.63 | 26d | 1 | 0.83mi |
| 1762 Taylor Ave Corona, CA | 4.0 | 2.5 | 1631 | $4,259 | $2.61 | 45d | 1 | 0.84mi |
| 1428 Camelot Dr Corona, CA | 3.0 | 1.5 | 1495 | $2,800 | $1.87 | 20d | 1 | 0.86mi |
| 1617 Toyon Pl Corona, CA | 3.0 | 2.0 | 1497 | $3,490 | $2.33 | 4d | 1 | 0.87mi |
| 1538 Via del Rio Corona, CA | 3.0 | 1.5 | 1495 | $3,050 | $2.04 | 45d | 1 | 0.95mi |
| 1538 Via del Rio Corona, CA | 3.0 | 2.0 | 1495 | $3,050 | $2.04 | 7d | 1 | 0.95mi |
| 1553 Chalgrove Dr Corona, CA | 3.0 | 2.5 | 1624 | $4,000 | $2.46 | 19d | 1 | 1.02mi |
| 915 Paseo Grande Corona, CA | 2.0 | 1.5 | 1100 | $2,199 | $2.00 | 45d | 1 | 1.25mi |
| 111 W Harrison St Corona, CA | 1.0–2.0 | 1.0–2.0 | 900 | $3,160 | $3.51 | 1d | 16 | 1.25mi |
| 929 E Grand Blvd Corona, CA | 2.0 | 1.5 | 1425 | $2,800 | $1.96 | 4d | 1 | 1.29mi |
| 418 N Main St Corona, CA | 1.0–2.0 | 1.0–2.0 | 999 | $2,940 | $2.94 | 0d | 13 | 1.32mi |
| 211 W Rincon St Corona, CA | 1.0–2.0 | 1.0–2.0 | 936 | $3,005 | $3.21 | 1d | 14 | 1.34mi |
| 990 Margarita Dr Corona, CA | 2.0 | 2.0 | 888 | $2,185 | $2.46 | 1d | 1 | 1.49mi |
| 646 Savi Dr #103 Corona, CA | 3.0 | 2.5 | 1613 | $3,250 | $2.01 | 26d | 1 | 1.49mi |
| 646 Savi Dr #102 Corona, CA | 3.0 | 3.5 | 1542 | $3,200 | $2.08 | 26d | 1 | 1.49mi |
| 763 Savi Dr Corona, CA | 3.0 | 2.5 | 1675 | $3,500 | $2.09 | 26d | 1 | 1.50mi |
Listing history 21 events
-
2026-06-21days on market $525,000 Active 68 DOM
-
2026-06-18days on market $525,000 Active 65 DOM
-
2026-06-17days on market $525,000 Active 64 DOM
-
2026-06-16days on market $525,000 Active 63 DOM
-
2026-06-15days on market $525,000 Active 62 DOM
-
2026-06-13days on market $525,000 Active 60 DOM
-
2026-06-13days on market $525,000 Active 59 DOM
-
2026-06-09days on market $525,000 Active 56 DOM
-
2026-06-08days on market $525,000 Active 55 DOM
-
2026-06-07days on market $525,000 Active 54 DOM
-
2026-06-04days on market $525,000 Active 51 DOM
-
2026-06-03days on market $525,000 Active 50 DOM
-
2026-06-02days on market $525,000 Active 49 DOM
-
2026-06-01days on market $525,000 Active 48 DOM
-
2026-05-31days on market $525,000 Active 47 DOM
-
2026-04-25status Active 766-char remark
Show marketing remark (766 chars)
Investor Opportunity, Fixer Upper in Corona. Great opportunity for investors, flippers, or buyers looking to renovate and add value. This property offers strong upside potential in an established neighborhood with convenient access to schools, shopping, dining, and major commuter routes. The home is in fixer condition and is ideal for a full renovation or value-add project. The lot provides ample space and flexibility for upgrades, landscaping, and outdoor improvements. Whether you are looking for your next flip project, or a property to customize to your own style, this home presents a great opportunity to build equity. Bring your contractor and your imagination. Property is being sold AS-IS. Buyer to verify all information, permits, and property details.
-
2026-04-14status Active 766-char remark
Show marketing remark (766 chars)
Investor Opportunity, Fixer Upper in Corona. Great opportunity for investors, flippers, or buyers looking to renovate and add value. This property offers strong upside potential in an established neighborhood with convenient access to schools, shopping, dining, and major commuter routes. The home is in fixer condition and is ideal for a full renovation or value-add project. The lot provides ample space and flexibility for upgrades, landscaping, and outdoor improvements. Whether you are looking for your next flip project, or a property to customize to your own style, this home presents a great opportunity to build equity. Bring your contractor and your imagination. Property is being sold AS-IS. Buyer to verify all information, permits, and property details.
-
2026-03-24status Active 766-char remark
Show marketing remark (766 chars)
Investor Opportunity, Fixer Upper in Corona. Great opportunity for investors, flippers, or buyers looking to renovate and add value. This property offers strong upside potential in an established neighborhood with convenient access to schools, shopping, dining, and major commuter routes. The home is in fixer condition and is ideal for a full renovation or value-add project. The lot provides ample space and flexibility for upgrades, landscaping, and outdoor improvements. Whether you are looking for your next flip project, or a property to customize to your own style, this home presents a great opportunity to build equity. Bring your contractor and your imagination. Property is being sold AS-IS. Buyer to verify all information, permits, and property details.
-
2026-03-21status Active 766-char remark
Show marketing remark (766 chars)
Investor Opportunity, Fixer Upper in Corona. Great opportunity for investors, flippers, or buyers looking to renovate and add value. This property offers strong upside potential in an established neighborhood with convenient access to schools, shopping, dining, and major commuter routes. The home is in fixer condition and is ideal for a full renovation or value-add project. The lot provides ample space and flexibility for upgrades, landscaping, and outdoor improvements. Whether you are looking for your next flip project, or a property to customize to your own style, this home presents a great opportunity to build equity. Bring your contractor and your imagination. Property is being sold AS-IS. Buyer to verify all information, permits, and property details.
-
2026-03-12$525,000 Active 766-char remark
Show marketing remark (766 chars)
Investor Opportunity, Fixer Upper in Corona. Great opportunity for investors, flippers, or buyers looking to renovate and add value. This property offers strong upside potential in an established neighborhood with convenient access to schools, shopping, dining, and major commuter routes. The home is in fixer condition and is ideal for a full renovation or value-add project. The lot provides ample space and flexibility for upgrades, landscaping, and outdoor improvements. Whether you are looking for your next flip project, or a property to customize to your own style, this home presents a great opportunity to build equity. Bring your contractor and your imagination. Property is being sold AS-IS. Buyer to verify all information, permits, and property details.
-
1976-07-01soldstatus $15,500
ⓘ Source: listings_history table (triggers on properties + properties_extension) + one-shot
backfill from property_details.listing_events for pre-trigger history.
Tax reassessment forecast CA · Resets to sale price
- Current annual tax
- $1,240 · $103/mo
- Projected year-2 tax
- $3,990 · $332/mo
- Expected delta
- +$2,750/yr (+$229/mo · 221.9%)
ⓘ Screening estimate from a state-policy table — verify with the county assessor before closing.
Climate risk First Street
- Flood 1/10 Low FEMA zone X (shaded) · 0% chance over 30 yrs
- Wildfire 2/10 Low
- Heat 6/10 Major 7 d/yr ≥100°F today · 19 d/yr by 30 yrs out
- Wind 1/10 Low
- Air quality 9/10 Extreme 19 unhealthy d/yr today · 23 by 30 yrs out
Nearby sold comps map
Loading sold comps map…
Walkable amenities ~0.75 mi
Loading nearby amenities…
Taxation est. · year 1
- Rental income
- $41,994
- − Mortgage interest
- −$29,408
- − Property taxes
- −$1,240
- − Insurance
- −$2,625
- − Repairs & maintenance
- −$3,360
- − Management
- −$3,360
- − Depreciation
- −$15,273
- Taxable loss
- −$13,271
- Est. tax savings @ 24.0%
- +$3,185
- After-tax cash flow
- $-543/yr
For passive investors: Depreciation is non-cash, so a rental often shows a tax loss while cash-flowing — sheltering income. Rental losses are passive: they offset passive income freely, and up to $25,000/yr can offset ordinary (W-2) income if you actively participate and your MAGI is under $100k (phasing out to $0 by $150k); unused losses carry forward. On sale, claimed depreciation is recaptured at up to 25%, and gains may owe capital-gains tax (a 1031 exchange can defer both). Figures are a year-1 estimate at your 24.0% rate — not tax advice; consult a CPA.
Schools (NCES district)
- District
- Corona-Norco Unified
- NCES district ID
- 0609850
- Math proficiency
- 46% ▲ 1.00%
- Reading proficiency
- 61% ▬ 0.00%
- Median HH income
- $83,380
- Composite
- 50.72/100
- National rank
- #3920
- State rank
- #312 of 1400 in CA
Livability — Corona
- Score
- 63/100
- State rank
- #461
- US rank
- #15787
Category grades
Schools grade is shown separately in the Schools card above.
Census & demographics
- Census place
- Corona, CA
- County
- Riverside County · 2,287,001 people
- City population
- 188,369
- Metro
- Riverside-San Bernardino-Ontario, CA
- Population (ZIP)
- 68,715
- Household income
- $104,457
- Rent vs Own
- Severe rent burden
- 1971.0
Population outlook (Riverside County) Hauer SSP2
- Today (2025)
- 2,664,475 people
- By 2030
- 2,802,692 · +5.2%
- By 2040
- 3,050,904 · +14.5%
- By 2050
- 3,256,783 · +22.2%
- By 2075
- 3,655,058 · +37.2%
- By 2100
- 3,766,594 · +41.4%
Race, ethnicity, and origin ACS 2023
- Neighborhood character
- Diverse neighborhood (Simpson 0.62)
- Race & ethnicity
- Hispanic / Latino 52% White 31% Two or more races 17% Asian 9% Black 4%
- Hispanic origin (detail)
- Mexican 44% Puerto Rican 1%
- Common ancestry
- Italian 4% Romanian 1% Portuguese 1%
- Foreign-born
- 24% · Canada, South Korea, China
- Languages at home
- 54% English-only · Spanish 36% Other Indo-European 3% Arabic 2%
Political lean MEDSL · Riverside
- 2024 margin
- Toss-up / Even · D 48.0% · R 49.3% · Other 2.6%
- 2008→2024 swing
- -3.6pp toward R · 2008: 2.3pp · 2024: -1.3pp
- All cycles
- 2024: R+1.3 2020: D+8.0 2016: D+4.3 2012: R+0.4 2008: D+2.3
Not yet ingested
- Civics
- —
Market trends
- HPI YoY
- ▼ -707.65%
- Current HPI
- 367.5939
- Rent YoY
- ▲ 1.45%
- Metro
- Riverside-San Bernardino-Ontario, CA
- State GDP YoY
- ▲ 3.21%
- F500 in state
- 116
Industry mix (Fortune 500 HQ in CA)
| Industry | F500 HQs | Revenue |
|---|---|---|
| Technology | 27 | $1,492B |
|
||
| Financial Services | 3 | $174B |
|
||
| Retail | 3 | $44B |
|
||
| Insurance | 3 | $26B |
|
||
| Media / Entertainment | 2 | $115B |
|
||
| Pharmaceuticals / Biotech | 2 | $62B |
|
||
Price history
+3287.1% since first listed6 events — show timeline
- 2026-04-25 Relisted — CRMLS
- 2026-04-14 Relisted — CRMLS
- 2026-03-24 Relisted — CRMLS
- 2026-03-21 Relisted — CRMLS
- 2026-03-12 Listed $525,000 CRMLS
- 1976-07-01 Sold (Public Records) $15,500 Public Records
Property tax history
+3.7%/yrLatest (2025): $1,240 · +26.0% YoY. Source: county tax records.
Cash-flow waterfall
monthlySold comps — $/sqft
last 12 mo · ≤1 miLoading sold comps…