235 W Hartel St · Sour Lake, TX
Flood risk 1/10 · Minimal
- FEMA flood zone
- X (unshaded)
- Chance of flooding over 30 yrs
- 0.0%
- Est. flood insurance / yr
- $507 – $1,088
Fire risk 3/10 · Minor
- Est. fire insurance / yr
- $1,222 – $2,270
Heat risk 9/10 · Severe
- Hot days now (above 110°F)
- 7 days/yr
- Hot days in 30 yrs
- 25 days/yr
Wind risk 9/10 · Severe
- Chance of severe wind over 30 yrs
- 99.0%
Air-quality risk 2/10 · Minimal
- Unhealthy air days now
- 0 days/yr
- Unhealthy air days in 30 yrs
- 1 days/yr
Risk factors via First Street. Map © Google.
Why this score? — see what drove the B- grade
The composite is a weighted blend of 9 inputs, each scored 0–100. Each bar is that input's sub-score; the figure is the points it added to the 100-point composite (weight × sub-score).
- Cash flow +26.7/30.0
- 1% rule +9.5/10.0
- DSCR +9.2/10.0
- ARV discount +7.5/15.0
- Schools +4.5/10.0
- Livability +3.5/5.0
- Rent growth +2.5/5.0
- Condition / age +2.5/5.0
- Appreciation +0.0/10.0
$55,000
🖨 Deal sheet (PDF) 📄 Offer letter ✓ Due diligence
Listing remarks MLS
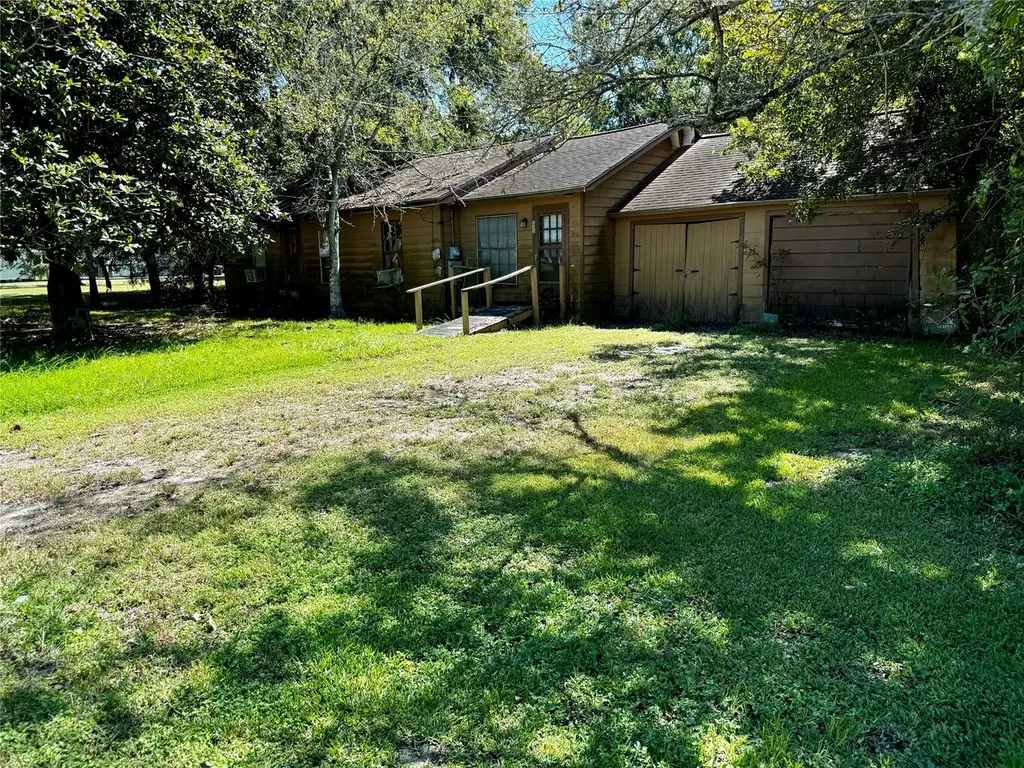
This 2 bedroom 1 bath home sits on three generous, shaded lots. The property presents a possible investment opportunity with the right TLC or use the spacious lots for future development. Property is being sold AS IS. No showings of inside for safety reasons due to rotted flooring.
Key facts
- As is
- Shaded lots
- Spacious lots
Tags
Neighborhood map
What this means for you Summary
Snapshot
- This is a 1-bed/1.0-bath single-family listed at $55k.
Deal economics
- At list price, monthly cash flow is $149 ($2k/yr) — positive.
- The deal already cash-flows at list — no discount required.
- Meets the 1% rule at list price ($800 rent vs $55k).
- Recommended offer: $48k (12.0% below list) — sets the bar for market timing.
- Cap rate 9.5% vs local median 4.8% in Sour Lake — top-decile yield for the area; either an underpriced asset or a hidden risk that comps aren't pricing in. Stress-test before assuming the spread holds.
Location & tenants
- Location reads 70/100 on livability (#352 in TX) — a middle-class / working-renter tenant base. Strengths: cost of living A+, housing A+, crime A; Watch: amenities F, commute F.
- Hardin-Jefferson ISD (rural): math 54% / reading 49% proficiency, ranked #135 of 826 in TX (top 16%) — acceptable for families but not a draw, mixed tenant base, ~2y average lease.
- Zoned schools: Sour Lake El (math 43% / reading 43%, grade F, #1,283 of 4,322 statewide, top 30%, 767 students, 42% FRL); Henderson Middle (math 59% / reading 47%, grade C+, #281 of 1,662 statewide, top 18%, 617 students, 41% FRL); Hardin-Jefferson H S (math 68% / reading 67%, grade B, #158 of 1,632 statewide, top 10%, 749 students, 38% FRL).
- Market conditions: 94 active listings in the ZIP; 1 comparable units currently listed for rent nearby; 358 units permitted in Hardin County in 2024 (0 in 5+ unit buildings).
Forward outlook
- Local home prices are declining (-3.0%/yr); year-one equity from $380 of loan paydown is wiped out by about $2k of value loss. Plan a longer hold.
- At projected returns (-3.0% appreciation + 3.0% rent growth), your $15k cash investment doubles in ~10 years — after that, you're playing with house money.
Negotiation context
- It's been on market 625 days — a 12% lower offer ($48k) is reasonable based on typical stale-listing flexibility.
Risks & watch-outs
- Watch-outs: property tax is 3.7% of price; built in 1958 — expect roof / HVAC / electrical / plumbing capex.
- Climate carrying-cost: severe wind risk, 99% chance of damaging wind over 30y; extreme-heat days projected 7→25/yr by 2055 (HVAC capex compounding) — expect insurance premiums to compound above CPI over the hold.
Questions for the listing agent
- It's been on market 625 days. Have you received any prior offers? Is the seller open to a 12% concession, seller financing, or rate buy-down credit?
- Built in 1958 — when were the roof, HVAC, electrical panel, plumbing, and water heater last replaced?
- Property tax is high relative to price — has the assessment been appealed recently, and will the sale trigger a re-assessment?
- Why hasn't it sold? Are there any deal-killer items the seller is aware of (foundation, flood, title, zoning, code violations)?
- Is there a deadline driving the sale (1031 exchange, divorce, estate, relocation)? That informs how much negotiation room exists.
- What's the average days-on-market for RENTAL listings here right now (not sales)? A rising rental-DOM trend means longer vacancies and softer asking-rent achievability than the comps imply.
- What's the recent tenant-quality profile in this submarket — average credit score on applications, eviction rate, late-payment / NSF rate, and stable-employment percentage? A property-management company in the area should have these aggregated.
- How much new for-sale + rental construction is in the pipeline within 1–3 miles? Heavy new supply typically softens prices + rents 12–24 months out; constrained supply supports both.
Investment metrics
- 1% rule
- 1.45% ✓
- Cap rate
- 9.54%
- Cash-on-cash
- 11.61%
- DSCR
- 1.52
- GRM
- 5.7
CMA / ARV
- ARV (median comp)
- $191,861
- List price
- $55,000
- Delta
- -71.33%
- Verdict
- UNDERPRICED
- Comps
- 2 within 1.0 mi
Show comp detail 2 sales within ~0.75 mi
| Address | Dist | Beds/Ba | Sqft | Sold | Price | $/sf | Match |
|---|---|---|---|---|---|---|---|
| 240 S Merchant St | 0.48mi | 2/1.0 (+1) | 1,344 (+2%) | 4mo | $210,000 | $156 | 66 |
| 735 4th St | 0.56mi | 2/2.0 (+1) | 1,217 (-8%) | 22mo | $180,000 | $148 | 34 |
Match score weights: distance 35% · size 25% · config 20% · recency 20%. Top-matched comps best support the ARV.
Projected returns pro-forma
-3.0% appreciation · 3.0% rent growth · sell at horizon
- IRR
- 1.1%
- Equity multiple
- 1.04×
- Total profit
- $650
- Equity at exit
- $8,201
- IRR
- 10.8%
- Equity multiple
- 1.85×
- Total profit
- $13,088
- Equity at exit
- $4,755
Cash invested: $15,400 (down + closing). Projections, not guarantees.
Landlord ↔ Tenant lean methodology
- Overall (STATE)
- 87 Strongly Landlord-Friendly
- State Texas
- 87 Strongly Landlord-Friendly · R+5
- County
- — inherits STATE
- City
- — inherits STATE
ZIP-level market 77659
- Active inventory
- 94
- Price-to-rent
- 5.7×
Monthly cashflow live
- Estimated rent
- $800 medium interval (Pro) →
- Mortgage (P&I)
- −$288
- Tax from tax record
- −$172 /mo · $2,060/yr
- Insurance
- −$23
- HOA
- −$0
- Vacancy / Maint / Mgmt
- −$168
- Net cashflow
- $149
Break-even live
Sensitivity live
| Price | -10% $180 | -5% $165 | +0% $149 | +5% $133 | +10% $118 |
|---|---|---|---|---|---|
| Rent | -10% $86 | -5% $117 | +0% $149 | +5% $181 | +10% $212 |
| Rate | -1.0pp $177 | -0.5pp $163 | base $149 | +0.5pp $135 | +1.0pp $120 |
UW: 25.0% down · 7.5% · 30yr · 1.5% tax · 5.0% vac · 8.0% maint · 8.0% mgmt
Financing live
Cash to close
- Down payment
- $13,750
- Closing costs
- $1,650
- Reserves months
- —
- Total cash needed
- —
Loan-product check · same deal, 3 products live
Conventional
25% down · 7.5% · 30yr
- Down + closing
- —
- Monthly P&I
- —
- Monthly cashflow
- —
- DSCR
- —
- Eligible?
- —
Personal DTI + credit; lowest rate.
DSCR
20% down · 8.5% · 30yr
- Down + closing
- —
- Monthly P&I
- —
- Monthly cashflow
- —
- DSCR
- —
- Eligible?
- —
No personal income docs; deal must DSCR.
Hard money
10% down · 12.0% · 12mo
- Down + closing
- —
- Monthly P&I
- —
- Monthly cashflow
- —
- DSCR
- —
- Eligible?
- —
Short-term bridge; refi at stabilization.
Rent comps 1 comps
| Address | Beds | Baths | Sqft | Rent | $/sqft | DOM | Units | Dist |
|---|---|---|---|---|---|---|---|---|
| 815 4th St Unit DW Sour Lake, TX | 2.0 | 1.0 | 1073 | $800 | $0.75 | 14d | 1 | 0.63mi |
Listing history 23 events
-
2026-06-21days on market $55,000 Active 625 DOM
-
2026-06-18days on market $55,000 Active 622 DOM
-
2026-06-17days on market $55,000 Active 621 DOM
-
2026-06-16days on market $55,000 Active 620 DOM
-
2026-06-15days on market $55,000 Active 619 DOM
-
2026-06-14pricedays on market $55,000 Active 617 DOM
-
2026-06-10days on market $65,000 Active 614 DOM
-
2026-06-09days on market $65,000 Active 613 DOM
-
2026-06-08days on market $65,000 Active 612 DOM
-
2026-06-07days on market $65,000 Active 611 DOM
-
2026-06-03days on market $65,000 Active 607 DOM
-
2026-06-02days on market $65,000 Active 606 DOM
-
2026-06-01days on market $65,000 Active 605 DOM
-
2026-05-31days on market $65,000 Active 604 DOM
-
2026-05-30days on market $65,000 Active 603 DOM
-
2025-07-15price $65,000 282-char remark
Show marketing remark (282 chars)
This 2 bedroom 1 bath home sits on three generous, shaded lots. The property presents a possible investment opportunity with the right TLC or use the spacious lots for future development. Property is being sold AS IS. No showings of inside for safety reasons due to rotted flooring.
-
2025-04-30price $80,000 282-char remark
Show marketing remark (282 chars)
This 2 bedroom 1 bath home sits on three generous, shaded lots. The property presents a possible investment opportunity with the right TLC or use the spacious lots for future development. Property is being sold AS IS. No showings of inside for safety reasons due to rotted flooring.
-
2025-02-02price $90,500 282-char remark
Show marketing remark (282 chars)
This 2 bedroom 1 bath home sits on three generous, shaded lots. The property presents a possible investment opportunity with the right TLC or use the spacious lots for future development. Property is being sold AS IS. No showings of inside for safety reasons due to rotted flooring.
-
2024-12-02price $95,500 282-char remark
Show marketing remark (282 chars)
This 2 bedroom 1 bath home sits on three generous, shaded lots. The property presents a possible investment opportunity with the right TLC or use the spacious lots for future development. Property is being sold AS IS. No showings of inside for safety reasons due to rotted flooring.
-
2024-10-29price $100,000 282-char remark
Show marketing remark (282 chars)
This 2 bedroom 1 bath home sits on three generous, shaded lots. The property presents a possible investment opportunity with the right TLC or use the spacious lots for future development. Property is being sold AS IS. No showings of inside for safety reasons due to rotted flooring.
-
2024-10-04$110,000 Active 282-char remark
Show marketing remark (282 chars)
This 2 bedroom 1 bath home sits on three generous, shaded lots. The property presents a possible investment opportunity with the right TLC or use the spacious lots for future development. Property is being sold AS IS. No showings of inside for safety reasons due to rotted flooring.
-
2024-06-03soldstatus
-
2012-01-31soldstatus
ⓘ Source: listings_history table (triggers on properties + properties_extension) + one-shot
backfill from property_details.listing_events for pre-trigger history.
Tax reassessment forecast TX · Resets to sale price
- Current annual tax
- $2,060 · $172/mo
- Projected year-2 tax
- $2,060 · $172/mo
- Expected delta
- $0/yr ($0/mo · 0.0%)
ⓘ Screening estimate from a state-policy table — verify with the county assessor before closing.
Climate risk First Street
- Flood 1/10 Low FEMA zone X (unshaded) · 0% chance over 30 yrs
- Wildfire 3/10 Moderate
- Heat 9/10 Extreme 7 d/yr ≥110°F today · 25 d/yr by 30 yrs out
- Wind 9/10 Extreme 99% chance of damaging wind over 30 yrs
- Air quality 2/10 Low 0 unhealthy d/yr today · 1 by 30 yrs out
Nearby sold comps map
Loading sold comps map…
Walkable amenities ~0.75 mi
Loading nearby amenities…
Taxation est. · year 1
- Rental income
- $9,600
- − Mortgage interest
- −$3,081
- − Property taxes
- −$2,060
- − Insurance
- −$275
- − Repairs & maintenance
- −$768
- − Management
- −$768
- − Depreciation
- −$1,600
- Taxable income
- $1,048
- Est. tax owed @ 24.0%
- −$251
- After-tax cash flow
- $1,536/yr
For passive investors: Depreciation is non-cash, so a rental often shows a tax loss while cash-flowing — sheltering income. Rental losses are passive: they offset passive income freely, and up to $25,000/yr can offset ordinary (W-2) income if you actively participate and your MAGI is under $100k (phasing out to $0 by $150k); unused losses carry forward. On sale, claimed depreciation is recaptured at up to 25%, and gains may owe capital-gains tax (a 1031 exchange can defer both). Figures are a year-1 estimate at your 24.0% rate — not tax advice; consult a CPA.
Schools (NCES district)
- District
- Hardin-Jefferson ISD
- NCES district ID
- 4822410
- Math proficiency
- 54% ▼ -5.00%
- Reading proficiency
- 49% ▼ -4.00%
- Median HH income
- $61,336
- Composite
- 45.14/100
- National rank
- #2682
- State rank
- #135 of 826 in TX
Livability — Sour Lake
- Score
- 70/100
- State rank
- #352
- US rank
- #7687
Category grades
Schools grade is shown separately in the Schools card above.
Census & demographics
- Census place
- Sour Lake, TX
- Population (ZIP)
- 5,847
Population outlook (Hardin County) Hauer SSP2
- Today (2025)
- 57,780 people
- By 2030
- 58,296 · +0.9%
- By 2040
- 58,421 · +1.1%
- By 2050
- 57,391 · -0.7%
- By 2075
- 53,132 · -8.0%
- By 2100
- 44,905 · -22.3%
Race, ethnicity, and origin ACS 2023
- Neighborhood character
- Predominantly White (87%)
- Race & ethnicity
- White 87% Hispanic / Latino 9% Two or more races 4% Black 2%
- Hispanic origin (detail)
- Mexican 9%
- Common ancestry
- Lithuanian 9% Romanian 2% Slovak 1%
- Foreign-born
- 3% · Canada, Vietnam
- Languages at home
- 93% English-only · Spanish 6%
Political lean MEDSL · Hardin
- 2024 margin
- Solid R (+75.8) · D 11.9% · R 87.7%
- 2008→2024 swing
- -14.6pp toward R · 2008: -61.2pp · 2024: -75.8pp
- All cycles
- 2024: R+75.8 2020: R+73.8 2016: R+73.9 2012: R+67.6 2008: R+61.2
Not yet ingested
- Civics
- —
Market trends
- HPI YoY
- ▼ -103.72%
- Current HPI
- 184.5266
- Rent YoY
- —
- Metro
- —
- State GDP YoY
- ▲ 3.95%
- F500 in state
- 110
Industry mix (Fortune 500 HQ in TX)
| Industry | F500 HQs | Revenue |
|---|---|---|
| Energy | 16 | $1,198B |
|
||
| Technology | 5 | $198B |
|
||
| Engineering / Construction | 4 | $72B |
|
||
| Energy Services | 3 | $60B |
|
||
| Utilities | 3 | $41B |
|
||
| Healthcare | 2 | $330B |
|
||
Price history
-40.9% since first listed8 events — show timeline
- 2025-07-15 Price Changed $65,000 HARMLS
- 2025-04-30 Price Changed $80,000 HARMLS
- 2025-02-02 Price Changed $90,500 HARMLS
- 2024-12-02 Price Changed $95,500 HARMLS
- 2024-10-29 Price Changed $100,000 HARMLS
- 2024-10-04 Listed $110,000 HARMLS
- 2024-06-03 Sold (Public Records) — Public Records
- 2012-01-31 Sold (Public Records) — Public Records
Property tax history
+3.0%/yrLatest (2025): $2,060 · +11.1% YoY. Source: county tax records.
Cash-flow waterfall
monthlySold comps — $/sqft
last 12 mo · ≤1 miLoading sold comps…