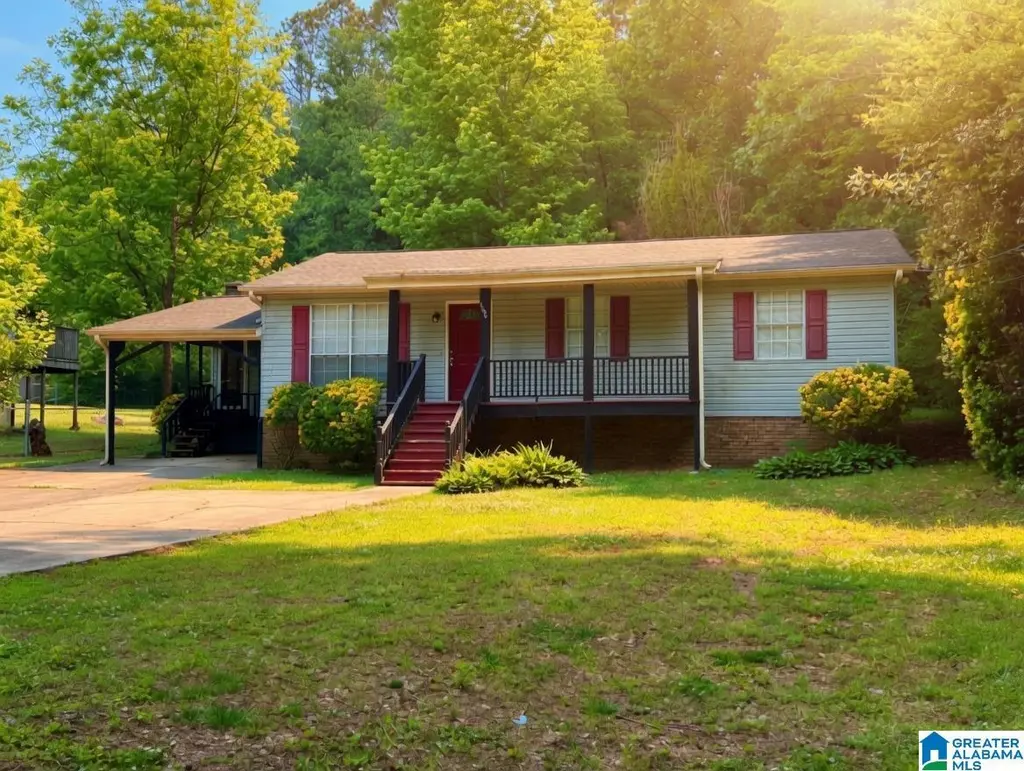
5996 Tyler Loop Rd · Pinson, AL
Flood risk 9/10 · Severe
- FEMA flood zone
- X (unshaded)
- Chance of flooding over 30 yrs
- 0.99%
- Est. flood insurance / yr
- $507 – $1,088
Fire risk 3/10 · Minor
- Est. fire insurance / yr
- $916 – $1,700
Heat risk 5/10 · Moderate
- Hot days now (above 105°F)
- 7 days/yr
- Hot days in 30 yrs
- 19 days/yr
Wind risk 6/10 · Moderate
- Chance of severe wind over 30 yrs
- 27.0%
Air-quality risk 5/10 · Moderate
- Unhealthy air days now
- 6 days/yr
- Unhealthy air days in 30 yrs
- 11 days/yr
Risk factors via First Street. Map © Google.
Why this score? — see what drove the C- grade
The composite is a weighted blend of 9 inputs, each scored 0–100. Each bar is that input's sub-score; the figure is the points it added to the 100-point composite (weight × sub-score).
- Cash flow +18.4/30.0
- ARV discount +13.8/15.0
- DSCR +5.8/10.0
- 1% rule +4.3/10.0
- Livability +3.0/5.0
- Rent growth +2.9/5.0
- Condition / age +2.5/5.0
- Schools +1.8/10.0
- Appreciation +0.0/10.0
$174,900
🖨 Deal sheet 📄 Offer letter ✓ Due diligence
Listing remarks MLS
Welcome home to this precious 3 bedroom 2 full bath home on a large lot. The family room is large and is big enough for the whole family to gather. The open kitchen overlooks the private backyard and has a cozy den with a fireplace. HVAC 2020, Water Heater 2021, Roof 2009, New paint throughout and new carpet in bedrooms. Approximately 1756 sq ft per seller!
Key facts
- Large family room
- Private backyard
- Stainless appliances
Tags
Property features AI
Finance
- Financial info: Fire fee assessed yearly ($300); Garbage fee assessed quarterly ($55)
- HOA & community: No association fee
Exterior
- Parking: Driveway parking; Parking on the main level; 1 carport space
- Utilities: Public water; Septic system; Gas water heater; Internet available
- Home design: Existing home; Single-story layout (rooms listed at main level); Brick over foundation with vinyl siding; Crawl space foundation
- Construction: Brick over foundation exterior; Vinyl siding
- Exterior features: Open patio; Open deck; Storage building; No pool; No garden view
Interior
- Kitchen: Dishwasher (built-in); Refrigerator; Electric stove; Solid surface countertops
- Bedrooms: Master bedroom on main level; Additional bedrooms on main level
- Flooring: Carpet; Hardwood; Tile
- Bathrooms: 2 full bathrooms
- Heating & cooling: Central heating; Central air conditioning
- Interior features: Crown molding; Gas fireplace with insert in the den; Eating area
- Laundry & utility: Main level laundry room; Washer hookup; Electric dryer hookup
Neighborhood map
What this means for you Summary
Snapshot
- This is a 3-bed/2.0-bath single-family listed at $175k.
Deal economics
- At list price, monthly cash flow is $97 ($1k/yr) — positive.
- The deal already cash-flows at list — no discount required.
- To meet the 1% rule (rent ≥ 1% of price), the offer needs to be $162k (7.4% below list).
- Recommended offer: $162k (7.4% below list) — sets the bar for 1% rule.
- Cap rate 7.4% vs local median 5.3% in Pinson — top-decile yield for the area; either an underpriced asset or a hidden risk that comps aren't pricing in. Stress-test before assuming the spread holds.
Location & tenants
- Location reads 60/100 on livability (#289 in AL) — a middle-class / working-renter tenant base. Strengths: cost of living A+, housing A+, crime B+; Watch: amenities F, commute F, health & safety F.
- Jefferson County (suburban): math 9% / reading 32% proficiency, ranked #104 of 129 in AL (top 81%) — low school quality limits family demand, transient renter base, plan for 1-2y turnover.
- Zoned schools: Kermit Johnson School (math 12% / reading 32%, grade F, #442 of 627 statewide, top 72%, 606 students, 62% FRL); Pinson Valley High School (math 6% / reading 17%, grade F, #246 of 305 statewide, top 81%, 1,029 students, 81% FRL) — zoned schools average 71% FRL vs 49% district-wide (23 pts higher); higher-poverty schools than district average — tighter screening recommended.
- Market conditions: Rents rising (+1.6%/yr); 186 active listings in the ZIP; 18 comparable units currently listed for rent nearby; rentals at typical pace (median 22d on market — plan ~3-4 weeks tenant-placement turnaround); solid renter incomes; 2,114 units permitted in Jefferson County in 2024 (556 in 5+ unit buildings).
Forward outlook
- Local home prices are declining (-3.0%/yr); year-one equity from $1k of loan paydown is wiped out by about $5k of value loss. Plan a longer hold.
- Jefferson County population projected to shrink 4% by 2050 — rents likely to lag national; underwrite the cash flow, not the appreciation.
Negotiation context
- It's been on market 35 days — a 3% lower offer ($170k) is reasonable based on typical stale-listing flexibility.
- 4 sale attempts since 4y ago with the ask held roughly flat each time — persistent listings suggest the price (not the market) is what's stuck; bring a comps-based counter.
Risks & watch-outs
- Watch-outs: flood insurance adds $66/mo.
- Climate carrying-cost: severe flood risk; major wind risk, 27% chance of damaging wind over 30y; extreme-heat days projected 7→19/yr by 2055 (HVAC capex compounding) — expect insurance premiums to compound above CPI over the hold.
Questions for the listing agent
- It's been on market 35 days. Have you received any prior offers? Is the seller open to a 7% concession, seller financing, or rate buy-down credit?
- Built in 1979 — when were the roof, HVAC, electrical panel, plumbing, and water heater last replaced?
- What's the actual annual flood-insurance premium (NFIP or private), and is the property in a SFHA with mandatory coverage?
- Is there a deadline driving the sale (1031 exchange, divorce, estate, relocation)? That informs how much negotiation room exists.
- Schools are D-rated, which usually means shorter tenancies and higher turnover. Who's the typical renter profile here, and what's been the actual vacancy rate?
- What's the average days-on-market for RENTAL listings here right now (not sales)? A rising rental-DOM trend means longer vacancies and softer asking-rent achievability than the comps imply.
- What's the recent tenant-quality profile in this submarket — average credit score on applications, eviction rate, late-payment / NSF rate, and stable-employment percentage? A property-management company in the area should have these aggregated.
- How much new for-sale + rental construction is in the pipeline within 1–3 miles? Heavy new supply typically softens prices + rents 12–24 months out; constrained supply supports both.
Investment metrics
- 1% rule
- 0.93% ✗
- Cap rate
- 7.42%
- Cash-on-cash
- 4.02%
- DSCR
- 1.18
- GRM
- 9.0
CMA / ARV
- ARV (median comp)
- $203,600
- List price
- $174,900
- Delta
- -14.10%
- Verdict
- UNDERPRICED
- Comps
- 20 within 1.0 mi
Show comp detail 12 sales within ~0.75 mi
| Address | Dist | Beds/Ba | Sqft | Sold | Price | $/sf | Match |
|---|---|---|---|---|---|---|---|
| 5100 Willow Ridge Dr | 0.14mi | 3/2.0 | 1,290 (-5%) | 12mo | $150,000 | $116 | 76 |
| 5559 Saddle Ridge Dr | 0.36mi | 3/2.0 | 1,400 (+3%) | 4mo | $220,000 | $157 | 75 |
| 5801 Stonearbor Pl | 0.25mi | 3/2.0 | 1,442 (+6%) | 7mo | $223,000 | $155 | 72 |
| 5007 Stonearbor Dr | 0.34mi | 3/2.0 | 1,414 (+4%) | 10mo | $205,000 | $145 | 69 |
| 5414 Saddle Ridge Ln | 0.45mi | 3/2.0 | 1,444 (+6%) | 1mo | $230,000 | $159 | 68 |
| 5826 Willow Crest Dr | 0.38mi | 3/2.0 | 1,434 (+6%) | 9mo | $167,500 | $117 | 65 |
| 5120 Willow Ridge Dr | 0.15mi | 3/2.0 | 1,546 (+14%) | 18mo | $165,900 | $107 | 54 |
| 5950 Honeysuckle Cir | 0.29mi | 3/2.0 | 1,474 (+9%) | 22mo | $220,000 | $149 | 53 |
| 5162 Willow Ridge Ln | 0.49mi | 3/1.0 | 1,482 (+9%) | 7mo | $80,000 | $54 | 52 |
| 6133 Judy Cir | 0.64mi | 3/2.0 | 1,448 (+7%) | 18mo | $250,000 | $173 | 44 |
| 6419 Tyler Loop Rd | 0.69mi | 4/2.0 (+1) | 1,430 (+6%) | 14mo | $191,000 | $134 | 42 |
| 6241 Anne Dr | 0.64mi | 3/2.0 | 1,460 (+8%) | 19mo | $235,000 | $161 | 41 |
Match score weights: distance 35% · size 25% · config 20% · recency 20%. Top-matched comps best support the ARV.
Projected returns pro-forma
-3.0% appreciation · 1.61% rent growth · sell at horizon
- IRR
- -14.1%
- Equity multiple
- 0.50×
- Total profit
- $-24,364
- Equity at exit
- $26,078
- IRR
- -7.6%
- Equity multiple
- 0.55×
- Total profit
- $-22,111
- Equity at exit
- $15,122
Cash invested: $48,972 (down + closing). Projections, not guarantees.
Landlord ↔ Tenant lean methodology
- Overall (STATE)
- 90 Strongly Landlord-Friendly
- State Alabama
- 90 Strongly Landlord-Friendly · R+15
- County
- — inherits STATE
- City
- — inherits STATE
ZIP-level market 35126
- Home prices YoY
- -22.4%
- Rents YoY
- 1.6%
- Active inventory
- 186
- Price-to-rent
- 9.0×
Monthly cashflow live
- Estimated rent
- $1,620 high interval (Pro) →
- Mortgage (P&I)
- −$917
- Tax from tax record
- −$126 /mo · $1,510/yr
- Insurance
- −$73
- Flood insurance flood zone
- −$66 /mo · $798/yr
- HOA
- −$0
- Vacancy / Maint / Mgmt
- −$340
- Net cashflow
- $97
Break-even live
UW: 25.0% down · 7.5% · 30yr · 1.5% tax · 5.0% vac · 8.0% maint · 8.0% mgmt
Financing live
Cash to close
- Down payment
- $43,725
- Closing costs
- $5,247
- Reserves months
- —
- Total cash needed
- —
Loan-product check · same deal, 3 products live
Conventional
25% down · 7.5% · 30yr
- Down + closing
- —
- Monthly P&I
- —
- Monthly cashflow
- —
- DSCR
- —
- Eligible?
- —
Personal DTI + credit; lowest rate.
DSCR
20% down · 8.5% · 30yr
- Down + closing
- —
- Monthly P&I
- —
- Monthly cashflow
- —
- DSCR
- —
- Eligible?
- —
No personal income docs; deal must DSCR.
Hard money
10% down · 12.0% · 12mo
- Down + closing
- —
- Monthly P&I
- —
- Monthly cashflow
- —
- DSCR
- —
- Eligible?
- —
Short-term bridge; refi at stabilization.
Rent comps 18 comps
| Address | Beds | Baths | Sqft | Rent | $/sqft | DOM | Units | Dist |
|---|---|---|---|---|---|---|---|---|
| 5944 Tyler Loop Rd Pinson, AL | 3.0 | 2.0 | 1247 | $1,485 | $1.19 | 23d | 1 | 0.10mi |
| 5764 Desoto Dr Pinson, AL | 3.0 | 1.5 | 1104 | $1,225 | $1.11 | 2d | 1 | 0.57mi |
| 5520 Desoto Cir Pinson, AL | 3.0 | 2.0 | 1720 | $1,823 | $1.06 | 11d | 1 | 0.81mi |
| 3104 Cobblestone Dr Birmingham, AL | 3.0 | 1.5 | 1533 | $1,516 | $0.99 | 3d | 1 | 1.05mi |
| 4246 Centerwood Dr Birmingham, AL | 3.0 | 2.0 | 1336 | $1,450 | $1.09 | 16d | 1 | 1.07mi |
| 1104 Oak Creek Trl NE Birmingham, AL | 3.0 | 2.0 | 1233 | $1,543 | $1.25 | 2d | 1 | 1.09mi |
| 4464 Winchester Hills Ln Pinson, AL | 3.0 | 2.0 | 1500 | $1,750 | $1.17 | 11d | 1 | 1.11mi |
| 4464 Winchester Hills Way Birmingham, AL | 3.0 | 2.0 | 1178 | $1,750 | $1.49 | 43d | 1 | 1.12mi |
| 5505 Leighaven Way Pinson, AL | 3.0 | 2.5 | 1682 | $2,000 | $1.19 | 10d | 1 | 1.23mi |
| 5140 Hickory Dr NE Pinson, AL | 3.0 | 1.5 | 1518 | $1,465 | $0.97 | 21d | 1 | 1.33mi |
| 6541 Womack Rd Pinson, AL | 3.0 | 2.0 | 1146 | $1,470 | $1.28 | 23d | 1 | 1.36mi |
| 5653 Cheryl Dr Pinson, AL | 3.0 | 2.0 | 1015 | $1,220 | $1.20 | 11d | 1 | 1.39mi |
| 6568 Davison Rd Pinson, AL | 3.0 | 2.0 | 1054 | $1,435 | $1.36 | 43d | 1 | 1.39mi |
| 4832 Deer Foot Cv Pinson, AL | 3.0 | 2.0 | 1714 | $1,556 | $0.91 | 21d | 1 | 1.40mi |
| 4800 Deer Foot Cv Pinson, AL | 3.0 | 2.0 | 1550 | $1,730 | $1.12 | 43d | 1 | 1.44mi |
| 6594 Davison Rd Pinson, AL | 3.0 | 2.0 | 1304 | $1,650 | $1.27 | 23d | 1 | 1.44mi |
| 6599 Womack Rd Pinson, AL | 4.0 | 2.0 | 1650 | $1,870 | $1.13 | 2d | 1 | 1.46mi |
| 2504 Beechwood Trl Pinson, AL | 3.0 | 2.0 | 1359 | $1,435 | $1.06 | 21d | 1 | 1.47mi |
Listing history 30 events
-
2026-06-18days on market $174,900 Active 35 DOM
-
2026-06-17days on market $174,900 Active 34 DOM
-
2026-06-16days on market $174,900 Active 33 DOM
-
2026-06-15days on market $174,900 Active 32 DOM
-
2026-06-13days on market $174,900 Active 30 DOM
-
2026-06-10days on market $174,900 Active 27 DOM
-
2026-06-09pricedays on market $174,900 Active 26 DOM
-
2026-06-08days on market $177,900 Active 25 DOM
-
2026-06-07days on market $177,900 Active 24 DOM
-
2026-06-03days on market $177,900 Active 20 DOM
-
2026-06-02days on market $177,900 Active 19 DOM
-
2026-06-01days on market $177,900 Active 18 DOM
-
2026-05-31days on market $177,900 Active 17 DOM
-
2026-05-14$182,900 Active 685-char remark
-
2025-03-24historical $1,425
-
2025-03-13$1,425
-
2023-11-14historical $1,375
-
2023-11-08price $1,375
-
2023-11-03price $1,400
-
2023-10-07price $1,425
-
2023-09-21
-
2022-05-26soldstatus $190,000
-
2022-05-24soldstatus $190,000 Sold 359-char remark
Show marketing remark (359 chars)
Welcome home to this precious 3 bedroom 2 full bath home on a large lot. The family room is large and is big enough for the whole family to gather. The open kitchen overlooks the private backyard and has a cozy den with a fireplace. HVAC 2020, Water Heater 2021, Roof 2009, New paint throughout and new carpet in bedrooms. Approximately 1756 sq ft per seller!
-
2022-05-03historical Contingent 359-char remark
Show marketing remark (359 chars)
Welcome home to this precious 3 bedroom 2 full bath home on a large lot. The family room is large and is big enough for the whole family to gather. The open kitchen overlooks the private backyard and has a cozy den with a fireplace. HVAC 2020, Water Heater 2021, Roof 2009, New paint throughout and new carpet in bedrooms. Approximately 1756 sq ft per seller!
-
2022-04-30$175,000 Active 359-char remark
Show marketing remark (359 chars)
Welcome home to this precious 3 bedroom 2 full bath home on a large lot. The family room is large and is big enough for the whole family to gather. The open kitchen overlooks the private backyard and has a cozy den with a fireplace. HVAC 2020, Water Heater 2021, Roof 2009, New paint throughout and new carpet in bedrooms. Approximately 1756 sq ft per seller!
-
2022-04-30historical $175,000 359-char remark
Show marketing remark (359 chars)
Welcome home to this precious 3 bedroom 2 full bath home on a large lot. The family room is large and is big enough for the whole family to gather. The open kitchen overlooks the private backyard and has a cozy den with a fireplace. HVAC 2020, Water Heater 2021, Roof 2009, New paint throughout and new carpet in bedrooms. Approximately 1756 sq ft per seller!
-
2009-03-27soldstatus $123,000
-
2004-10-18soldstatus $103,000
-
1990-04-14soldstatus $42,200
-
1979-10-01soldstatus $39,200
ⓘ Source: listings_history table (triggers on properties + properties_extension) + one-shot
backfill from property_details.listing_events for pre-trigger history.
Tax reassessment forecast AL · Resets to sale price
- Current annual tax
- $1,510 · $126/mo
- Projected year-2 tax
- $1,510 · $126/mo
- Expected delta
- $0/yr ($0/mo · -0.0%)
ⓘ Screening estimate from a state-policy table — verify with the county assessor before closing.
Climate risk First Street
- Flood 9/10 Extreme FEMA zone X (unshaded) · 99% chance over 30 yrs
- Wildfire 3/10 Moderate
- Heat 5/10 Major 7 d/yr ≥105°F today · 19 d/yr by 30 yrs out
- Wind 6/10 Major 27% chance of damaging wind over 30 yrs
- Air quality 5/10 Major 6 unhealthy d/yr today · 11 by 30 yrs out
Nearby sold comps map
Loading sold comps map…
Walkable amenities ~0.75 mi
Loading nearby amenities…
Taxation est. · year 1
- Rental income
- $19,440
- − Mortgage interest
- −$9,797
- − Property taxes
- −$1,510
- − Insurance
- −$1,672
- − Repairs & maintenance
- −$1,555
- − Management
- −$1,555
- − Depreciation
- −$5,088
- Taxable loss
- −$1,738
- Est. tax savings @ 24.0%
- +$417
- After-tax cash flow
- $1,586/yr
For passive investors: Depreciation is non-cash, so a rental often shows a tax loss while cash-flowing — sheltering income. Rental losses are passive: they offset passive income freely, and up to $25,000/yr can offset ordinary (W-2) income if you actively participate and your MAGI is under $100k (phasing out to $0 by $150k); unused losses carry forward. On sale, claimed depreciation is recaptured at up to 25%, and gains may owe capital-gains tax (a 1031 exchange can defer both). Figures are a year-1 estimate at your 24.0% rate — not tax advice; consult a CPA.
Schools (NCES district)
- District
- Jefferson County
- NCES district ID
- 0101920
- Math proficiency
- 9% ▼ -24.00%
- Reading proficiency
- 32% ▼ -5.00%
- Median HH income
- $51,712
- Composite
- 18.4/100
- National rank
- #8937
- State rank
- #104 of 129 in AL
Livability — Pinson
- Score
- 60/100
- State rank
- #289
- US rank
- #18763
Category grades
Schools grade is shown separately in the Schools card above.
Census & demographics
- Census place
- Pinson, AL
- County
- Jefferson County · 527,445 people
- City population
- 22,599
- Metro
- Birmingham-Hoover, AL
- Population (ZIP)
- 22,599
- Household income
- $83,732
- Rent vs Own
- Severe rent burden
- 267.0
Population outlook (Jefferson County) Hauer SSP2
- Today (2025)
- 669,185 people
- By 2030
- 669,694 · +0.1%
- By 2040
- 661,388 · -1.2%
- By 2050
- 643,086 · -3.9%
- By 2075
- 577,267 · -13.7%
- By 2100
- 474,758 · -29.1%
Race, ethnicity, and origin ACS 2023
- Neighborhood character
- Diverse neighborhood (Simpson 0.58)
- Race & ethnicity
- White 58% Black 28% Hispanic / Latino 8% Two or more races 7% Asian 2%
- Hispanic origin (detail)
- Mexican 5% Puerto Rican 1%
- Common ancestry
- Slovak 2% Lithuanian 1% Italian 1%
- Foreign-born
- 5% · Canada, China, Jamaica
- Languages at home
- 92% English-only · Spanish 5% Vietnamese 1% Chinese 0%
Political lean MEDSL · Jefferson
- 2024 margin
- D (+10.4) · D 54.6% · R 44.2% · Other 1.2%
- 2008→2024 swing
- +5.4pp toward D · 2008: 5.1pp · 2024: 10.4pp
- All cycles
- 2024: D+10.4 2020: D+13.2 2016: D+7.2 2012: D+6.0 2008: D+5.1
Not yet ingested
- Civics
- —
Market trends
- HPI YoY
- ▼ -54.52%
- Current HPI
- 188.6439
- Rent YoY
- ▲ 1.61%
- Metro
- Birmingham-Hoover, AL
- State GDP YoY
- ▲ 2.94%
- F500 in state
- 4
Industry mix (Fortune 500 HQ in AL)
| Industry | F500 HQs | Revenue |
|---|---|---|
| Financial Services | 1 | $8B |
|
||
| Healthcare | 1 | $5B |
|
||
Price history
+346.2% since first listed19 events — show timeline
- 2026-06-09 Price Changed $174,900 Greater Alabama MLS
- 2026-05-28 Price Changed $177,900 Greater Alabama MLS
- 2026-05-14 Listed $182,900 Greater Alabama MLS
- 2025-03-24 Rental Removed $1,425 RENTLY
- 2025-03-13 Listed for Rent $1,425 RENTLY
- 2023-11-14 Rental Removed $1,375 RENTLY
- 2023-11-08 Price Changed $1,375 RENTLY
- 2023-11-03 Price Changed $1,400 RENTLY
- 2023-10-07 Price Changed $1,425 RENTLY
- 2023-09-21 Listed for Rent — RENTLY
- 2022-05-26 Sold (Public Records) $190,000 Public Records
- 2022-05-24 Sold (MLS) $190,000 Greater Alabama MLS
- 2022-05-03 Contingent — Greater Alabama MLS
- 2022-04-30 Listed $175,000 Greater Alabama MLS
- 2022-04-30 Coming Soon $175,000 Greater Alabama MLS
- 2009-03-27 Sold (Public Records) $123,000 Public Records
- 2004-10-18 Sold (Public Records) $103,000 Public Records
- 1990-04-14 Sold (Public Records) $42,200 Public Records
- 1979-10-01 Sold (Public Records) $39,200 Public Records
Property tax history
+5.6%/yrLatest (2025): $1,510 · -0.1% YoY. Source: county tax records.
Cash-flow waterfall
monthlySold comps — $/sqft
last 12 mo · ≤1 miLoading sold comps…