 Duplex
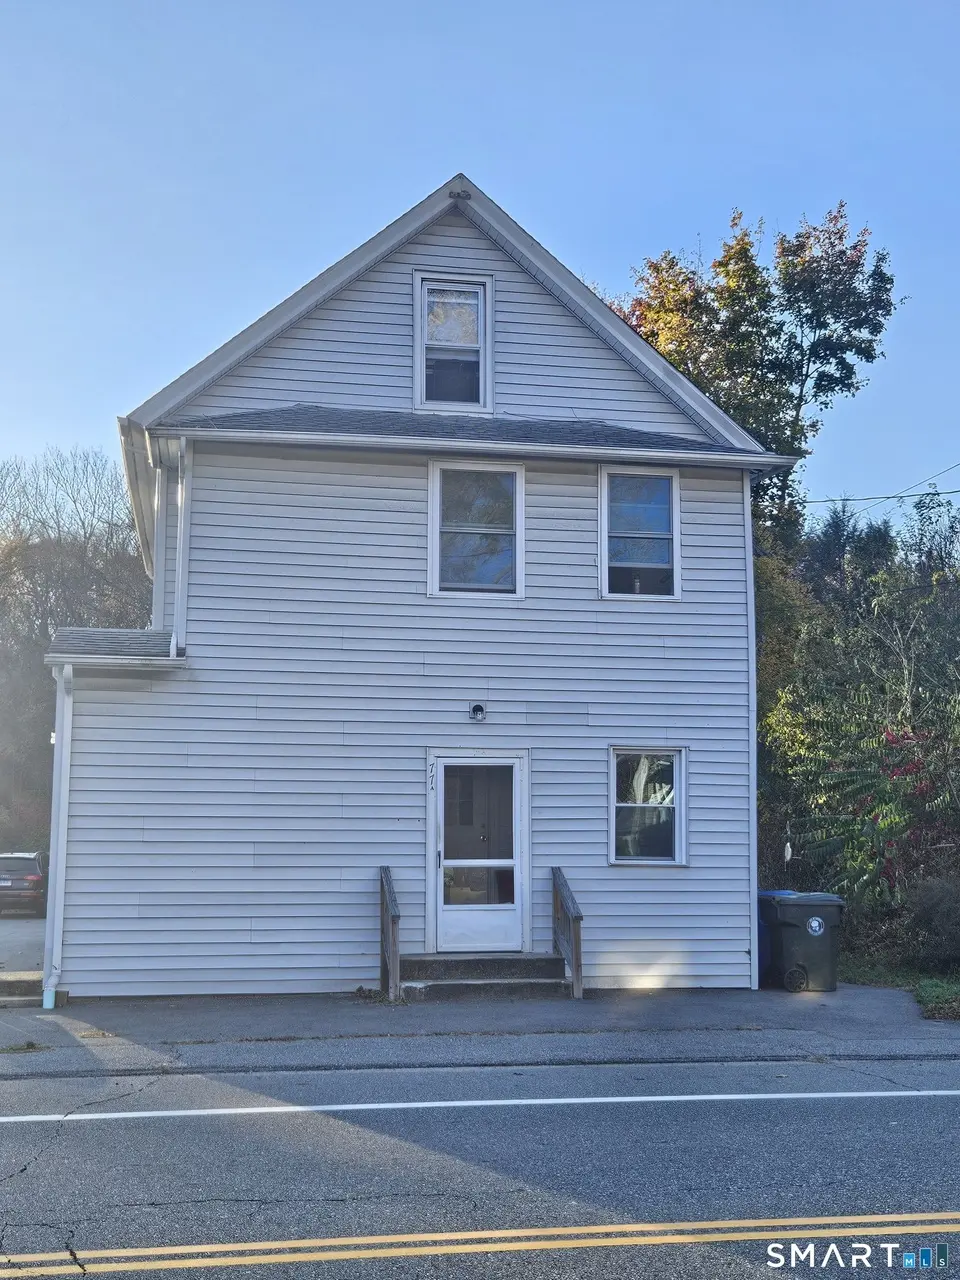
77 Taftville Occum Rd · Norwich, CT
Flood risk 9/10 · Severe
- FEMA flood zone
- X (shaded)
- Chance of flooding over 30 yrs
- 0.99%
- Est. flood insurance / yr
- $473 – $860
Fire risk 3/10 · Minor
- Est. fire insurance / yr
- $829 – $1,539
Heat risk 5/10 · Moderate
- Hot days now (above 98°F)
- 7 days/yr
- Hot days in 30 yrs
- 16 days/yr
Wind risk 6/10 · Moderate
- Chance of severe wind over 30 yrs
- 61.0%
Air-quality risk 3/10 · Minor
- Unhealthy air days now
- 2 days/yr
- Unhealthy air days in 30 yrs
- 3 days/yr
Risk factors via First Street. Map © Google.
Why this score? — see what drove the B- grade
The composite is a weighted blend of 9 inputs, each scored 0–100. Each bar is that input's sub-score; the figure is the points it added to the 100-point composite (weight × sub-score).
- Cash flow +30.0/30.0
- DSCR +10.0/10.0
- 1% rule +8.1/10.0
- ARV discount +7.5/15.0
- Rent growth +4.2/5.0
- Livability +4.0/5.0
- Condition / age +2.5/5.0
- Schools +2.1/10.0
- Appreciation +0.0/10.0
$268,000
🖨 Deal sheet (PDF) 📄 Offer letter ✓ Due diligence
Multi-family units
County records classify this as Multi-Family (2-4 Unit). Listing-text estimate: 2 units. confirmed
Listing remarks MLS
Priced to sell, 2-Family. First floor 1 bedroom, 1 Bath. Second floor unit 3 Bedrooms 1 Bath. Good condition, needs some cosmetic finishing touches. Private off street park. Selling "AS IS" any inspections for Buyer's information. Seller will not make any repairs. Subject to release of current contract. Great location, right of the Rt. 395 ramps.
Key facts
- Near i-395
- Local schools
- Multi-family home
Tags
Property features AI
Finance
- Financial info: Assessed value listed
Exterior
- Utilities: Public water connected; Public sewer connected; Hot water: other
- Home design: Multi-family (2-family); Multi-family for sale
- Construction: Built with frame construction; Concrete foundation; Asphalt shingle roof
- Exterior features: Level lot; Vinyl siding
Interior
- Bedrooms: 4 bedrooms
- Bathrooms: 2 full bathrooms
- Heating & cooling: Hot water heating; Ceiling fans for cooling; Gas supplied in street for heat fuel
- Interior features: Ceiling fans; Full basement; Walk-up attic
Neighborhood map
What this means for you Summary
Snapshot
- This is a 2 × 2-bed/1.0-bath units multifamily listed at $268k.
Deal economics
- At list price, monthly cash flow is $959 ($12k/yr) — positive. Per door: $480/mo.
- The deal already cash-flows at list — no discount required.
- Meets the 1% rule at list price ($4k rent vs $268k).
- Recommended offer: $264k (1.5% below list) — sets the bar for market timing.
- Cap rate 10.8% vs local median 4.1% in Norwich — top-decile yield for the area; either an underpriced asset or a hidden risk that comps aren't pricing in. Stress-test before assuming the spread holds.
Location & tenants
- Location reads 81/100 on livability (#18 in CT, #1,391 nationally) — a professional / high-income tenant draw. Strengths: housing A+, health & safety A+, commute A-.
- Norwich School District (urban): math 19% / reading 29% proficiency, ranked #139 of 153 in CT (top 91%) — low school quality limits family demand, transient renter base, plan for 1-2y turnover; 62% free/reduced lunch — lower-income household profile, screen leases tightly.
- Zoned schools: Moriarty Magnet School (math 26% / reading 31%, grade F, #396 of 553 statewide, top 72%, 368 students, 62% FRL); Kelly Steam Magnet Middle School (math 15% / reading 32%, grade F, #156 of 175 statewide, top 90%, 556 students, 72% FRL).
- Market conditions: Rents rising fast (+6.6%/yr); 243 active listings in the ZIP; 1 comparable units currently listed for rent nearby; 487 units permitted in Southeastern Connecticut Planning Region in 2024 (244 in 5+ unit buildings).
- At $3,512/mo this rent would consume 64% of the median local household income ($66k/yr) (locally 1643% of renters already pay >50% of income on rent) — very limited rent-growth headroom before tenants either downsize or default.
Forward outlook
- Local home prices are declining (-3.0%/yr); year-one equity from $2k of loan paydown is wiped out by about $8k of value loss. Plan a longer hold.
- At projected returns (-3.0% appreciation + 6.6% rent growth), your $75k cash investment doubles in ~7 years — after that, you're playing with house money.
Negotiation context
- It's been on market 18 days — a 2% lower offer ($264k) is reasonable based on typical stale-listing flexibility.
- 5 sale attempts since 7y ago with the ask held roughly flat each time — persistent listings suggest the price (not the market) is what's stuck; bring a comps-based counter.
- Current owner paid $173k; list at $268k implies a 55% gain — meaningful room to come down on a strong offer.
Risks & watch-outs
- Watch-outs: flood insurance adds $56/mo; built in 1911 — expect roof / HVAC / electrical / plumbing capex.
- Climate carrying-cost: severe flood risk; major wind risk, 61% chance of damaging wind over 30y; extreme-heat days projected 7→16/yr by 2055 (HVAC capex compounding) — expect insurance premiums to compound above CPI over the hold.
Questions for the listing agent
- Can we see the unit-by-unit rent roll, current vacancy, and any below-market leases? What's the average tenancy length?
- What capital expenditures (roof, boiler, parking lot, exteriors) have been made in the last 5 years, and what's planned in the next 2?
- Built in 1911 — when were the roof, HVAC, electrical panel, plumbing, and water heater last replaced?
- What's the actual annual flood-insurance premium (NFIP or private), and is the property in a SFHA with mandatory coverage?
- Is there a deadline driving the sale (1031 exchange, divorce, estate, relocation)? That informs how much negotiation room exists.
- Schools are D-rated, which usually means shorter tenancies and higher turnover. Who's the typical renter profile here, and what's been the actual vacancy rate?
- What's the average days-on-market for RENTAL listings here right now (not sales)? A rising rental-DOM trend means longer vacancies and softer asking-rent achievability than the comps imply.
- What's the recent tenant-quality profile in this submarket — average credit score on applications, eviction rate, late-payment / NSF rate, and stable-employment percentage? A property-management company in the area should have these aggregated.
- How much new apartment / multifamily construction is in the pipeline within 1–3 miles? Heavy new supply (>2% of stock underway) typically softens rents 12–24 months out; light construction supports rent growth.
Investment metrics
- 1% rule
- 1.31% ✓
- Cap rate
- 10.84%
- Cash-on-cash
- 16.23%
- DSCR
- 1.72
- GRM
- 6.4
CMA / ARV
No comps found within radius.
Projected returns pro-forma
-3.0% appreciation · 6.62% rent growth · sell at horizon
- IRR
- 10.0%
- Equity multiple
- 1.41×
- Total profit
- $30,966
- Equity at exit
- $39,960
- IRR
- 21.9%
- Equity multiple
- 3.19×
- Total profit
- $164,381
- Equity at exit
- $23,172
Cash invested: $75,040 (down + closing). Projections, not guarantees.
Landlord ↔ Tenant lean methodology
- Overall (STATE)
- 27 Tenant-Leaning
- State Connecticut
- 27 Tenant-Leaning · D+7
- County
- — inherits STATE
- City
- — inherits STATE
ZIP-level market 06360
- Home prices YoY
- -19.9%
- Rents YoY
- 6.6%
- Active inventory
- 243
- Price-to-rent
- 12.7×
Monthly cashflow live
- Estimated rent
- $3,512 medium interval (Pro) →
- Mortgage (P&I)
- −$1,405
- Tax from tax record
- −$242 /mo · $2,909/yr
- Insurance
- −$112
- Flood insurance flood zone
- −$56 /mo · $666/yr
- HOA
- −$0
- Vacancy / Maint / Mgmt
- −$738
- Net cashflow
- $959
Break-even live
Sensitivity live
| Price | -10% $1,111 | -5% $1,035 | +0% $959 | +5% $884 | +10% $808 |
|---|---|---|---|---|---|
| Rent | -10% $682 | -5% $821 | +0% $959 | +5% $1,098 | +10% $1,237 |
| Rate | -1.0pp $1,094 | -0.5pp $1,028 | base $959 | +0.5pp $890 | +1.0pp $819 |
2-unit breakdown (identical units grouped — click to expand)
| Units | Beds | Baths | Est. rent |
|---|---|---|---|
| 2× units | 2 | 1 | $3,512 |
| #1 | 2 | 1 | $1,756 |
| #2 | 2 | 1 | $1,756 |
| Total (2 units) | $3,512 | ||
UW: 25.0% down · 7.5% · 30yr · 1.5% tax · 5.0% vac · 8.0% maint · 8.0% mgmt
Financing live
Cash to close
- Down payment
- $67,000
- Closing costs
- $8,040
- Reserves months
- —
- Total cash needed
- —
Loan-product check · same deal, 3 products live
Conventional
25% down · 7.5% · 30yr
- Down + closing
- —
- Monthly P&I
- —
- Monthly cashflow
- —
- DSCR
- —
- Eligible?
- —
Personal DTI + credit; lowest rate.
DSCR
20% down · 8.5% · 30yr
- Down + closing
- —
- Monthly P&I
- —
- Monthly cashflow
- —
- DSCR
- —
- Eligible?
- —
No personal income docs; deal must DSCR.
Hard money
10% down · 12.0% · 12mo
- Down + closing
- —
- Monthly P&I
- —
- Monthly cashflow
- —
- DSCR
- —
- Eligible?
- —
Short-term bridge; refi at stabilization.
Rent comps 1 comps
| Address | Beds | Baths | Sqft | Rent | $/sqft | DOM | Units | Dist |
|---|---|---|---|---|---|---|---|---|
| 755 Scotland Rd Norwich, CT | 4.0 | 2.0 | 1600 | $2,650 | $1.66 | 45d | 1 | 1.28mi |
Listing history 13 events
-
2026-06-21days on market $268,000 Active 18 DOM
-
2026-06-19days on market $268,000 Active 16 DOM
-
2026-06-18days on market $268,000 Active 15 DOM
-
2026-06-17days on market $268,000 Active 14 DOM
-
2026-06-16days on market $268,000 Active 13 DOM
-
2026-06-15days on market $268,000 Active 12 DOM
-
2026-06-14days on market $268,000 Active 10 DOM
-
2026-06-13days on market $268,000 Active 9 DOM
-
2026-06-10days on market $268,000 Active 7 DOM
-
2026-06-09days on market $268,000 Active 6 DOM
-
2026-06-08days on market $268,000 Active 5 DOM
-
2026-06-07remarks 699-char remark
-
2026-06-07$268,000 Active 4 DOM
ⓘ Source: listings_history table (triggers on properties + properties_extension) + one-shot
backfill from property_details.listing_events for pre-trigger history.
Tax reassessment forecast CT · Partial reset (capped growth)
- Current annual tax
- $2,909 · $242/mo
- Projected year-2 tax
- $4,322 · $360/mo
- Expected delta
- +$1,413/yr (+$118/mo · 48.6%)
ⓘ Screening estimate from a state-policy table — verify with the county assessor before closing.
Climate risk First Street
- Flood 9/10 Extreme FEMA zone X (shaded) · 99% chance over 30 yrs
- Wildfire 3/10 Moderate
- Heat 5/10 Major 7 d/yr ≥98°F today · 16 d/yr by 30 yrs out
- Wind 6/10 Major 61% chance of damaging wind over 30 yrs
- Air quality 3/10 Moderate 2 unhealthy d/yr today · 3 by 30 yrs out
Nearby sold comps map
Loading sold comps map…
Walkable amenities ~0.75 mi
Loading nearby amenities…
Taxation est. · year 1
- Rental income
- $42,144
- − Mortgage interest
- −$15,012
- − Property taxes
- −$2,909
- − Insurance
- −$2,006
- − Repairs & maintenance
- −$3,372
- − Management
- −$3,372
- − Depreciation
- −$7,796
- Taxable income
- $7,677
- Est. tax owed @ 24.0%
- −$1,842
- After-tax cash flow
- $9,671/yr
For passive investors: Depreciation is non-cash, so a rental often shows a tax loss while cash-flowing — sheltering income. Rental losses are passive: they offset passive income freely, and up to $25,000/yr can offset ordinary (W-2) income if you actively participate and your MAGI is under $100k (phasing out to $0 by $150k); unused losses carry forward. On sale, claimed depreciation is recaptured at up to 25%, and gains may owe capital-gains tax (a 1031 exchange can defer both). Figures are a year-1 estimate at your 24.0% rate — not tax advice; consult a CPA.
Schools (NCES district)
- District
- Norwich School District
- NCES district ID
- 0903120
- Math proficiency
- 19% ▼ -8.00%
- Reading proficiency
- 29% ▼ -7.00%
- Median HH income
- $50,813
- Composite
- 21.27/100
- National rank
- #8395
- State rank
- #139 of 153 in CT
Livability — Norwich
- Score
- 81/100
- State rank
- #18
- US rank
- #1391
Category grades
Schools grade is shown separately in the Schools card above.
Census & demographics
- Census place
- Norwich, CT
- County
- New London County · 147,197 people
- City population
- 37,216
- Metro
- Norwich-New London, CT
- Population (ZIP)
- 37,216
- Household income
- $65,539
- Rent vs Own
- Severe rent burden
- 1643.0
Population outlook (Southeastern Connecticut County) Hauer SSP2
- By 2040
- 293,442
Race, ethnicity, and origin ACS 2023
- Neighborhood character
- Diverse neighborhood (Simpson 0.63)
- Race & ethnicity
- White 56% Hispanic / Latino 21% Two or more races 12% Black 10% Asian 7%
- Hispanic origin (detail)
- Mexican 3% Puerto Rican 9% Cuban 1% Dominican 3%
- Common ancestry
- Lithuanian 8% Romanian 5% Hispanic 4%
- Foreign-born
- 15% · Canada, China
- Languages at home
- 77% English-only · Spanish 11% French/Haitian/Cajun 4% Chinese 3%
Political lean MEDSL · Southeastern Connecticut
- 2024 margin
- D (+13.0) · D 55.6% · R 42.6% · Other 1.8%
- All cycles
- 2024: D+13.0
Not yet ingested
- Civics
- —
Market trends
- HPI YoY
- ▼ -65.27%
- Current HPI
- 261.8575
- Rent YoY
- ▲ 6.62%
- Metro
- Norwich-New London, CT
- State GDP YoY
- ▲ 1.06%
- F500 in state
- 38
Industry mix (Fortune 500 HQ in CT)
| Industry | F500 HQs | Revenue |
|---|---|---|
| Industrial Machinery | 4 | $38B |
|
||
| Insurance | 3 | $71B |
|
||
| Financial Services | 2 | $25B |
|
||
| Transportation / Logistics | 2 | $18B |
|
||
| Healthcare | 1 | $247B |
|
||
| Telecommunications | 1 | $55B |
|
||
Price history
+239.2% since first listed13 events — show timeline
- 2026-06-04 Listed $268,000 Smart MLS
- 2022-06-30 Sold (Public Records) $173,000 Public Records
- 2022-03-31 Relisted — Smart MLS
- 2022-03-31 Listing Removed — Smart MLS
- 2022-01-31 Contingent — Smart MLS
- 2021-09-28 Listed $175,000 Smart MLS
- 2020-06-08 Sold (Public Records) $75,000 Public Records
- 2020-06-08 Sold (MLS) $75,000 Smart MLS
- 2020-05-15 Pending — Smart MLS
- 2020-04-15 Relisted — Smart MLS
- 2020-02-06 Pending — Smart MLS
- 2020-02-06 Contingent — Smart MLS
- 2019-12-23 Listed $79,000 Smart MLS
Property tax history
-1.1%/yrLatest (2023): $2,909 · -3.0% YoY. Source: county tax records.
Cash-flow waterfall
monthlySold comps — $/sqft
last 12 mo · ≤1 miLoading sold comps…