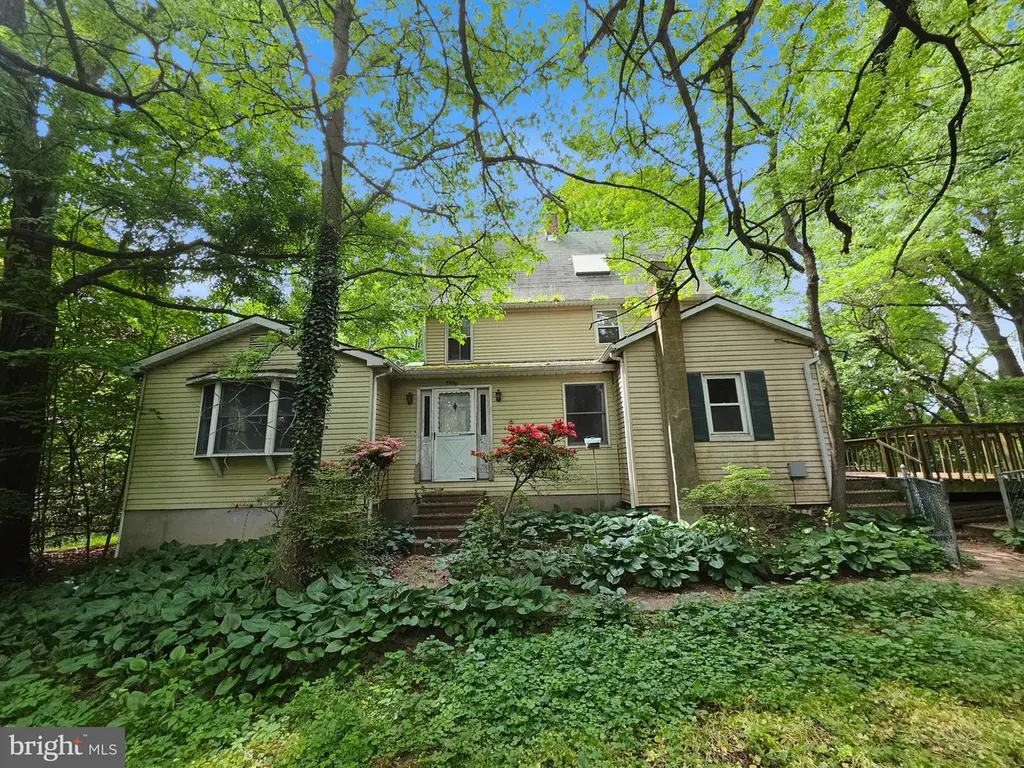
5424 Glenview Rd · Perry Hall, MD
Flood risk 1/10 · Minimal
- FEMA flood zone
- X (unshaded)
- Chance of flooding over 30 yrs
- 0.0%
- Est. flood insurance / yr
- $473 – $860
Fire risk 4/10 · Minor
- Est. fire insurance / yr
- $755 – $1,403
Heat risk 6/10 · Moderate
- Hot days now (above 105°F)
- 6 days/yr
- Hot days in 30 yrs
- 13 days/yr
Wind risk 6/10 · Moderate
- Chance of severe wind over 30 yrs
- 27.0%
Air-quality risk 4/10 · Minor
- Unhealthy air days now
- 5 days/yr
- Unhealthy air days in 30 yrs
- 7 days/yr
Risk factors via First Street. Map © Google.
Why this score? — see what drove the D grade
The composite is a weighted blend of 9 inputs, each scored 0–100. Each bar is that input's sub-score; the figure is the points it added to the 100-point composite (weight × sub-score).
- ARV discount +15.0/15.0
- Cash flow +9.5/30.0
- Livability +4.4/5.0
- 1% rule +2.8/10.0
- DSCR +2.7/10.0
- Rent growth +2.5/5.0
- Condition / age +2.5/5.0
- Schools +2.3/10.0
- Appreciation +0.0/10.0
$359,900
🖨 Deal sheet 📄 Offer letter ✓ Due diligence
Listing remarks
Nestled in the peaceful Glen Arm section of Baltimore County, this extraordinary property offers a rare opportunity to restore and reimagine a truly unique estate. Set on nearly 5 private acres surrounded by mature trees, the home delivers exceptional space, character, and endless potential for renovation enthusiasts, investors, or buyers seeking a secluded retreat. Boasting approximately 3,000 square feet of living space across five levels — including a finished attic — the residence features generously sized rooms and a flexible layout ready for your vision. The expansive primary suite includes a private full bath and access to its own deck overlooking the serene wooded settin
Key facts
- Private acres
- Finished attic
- Primary suite
Tags
Property features AI
Exterior
- Parking: Driveway
- Utilities: Water from a well; Private septic tank; Electric hot water; No municipal trash service
- Home design: Detached structure; Building is winterized; Major rehab needed
- Construction: Frame construction; Block foundation; Above-grade and below-grade other structures
- Exterior features: In-ground personal pool; Not located in a federal flood zone
Interior
- Bedrooms: Three bedrooms on the upper level; One bedroom on the main level
- Bathrooms: Two full bathrooms (both on the upper level / total full baths: 2)
- Heating & cooling: Forced air heating (natural gas); Ceiling fans for cooling (electric)
- Interior features: Not furnished; Basement with interior access and rear entrance; Basement includes space for rooms, a workshop, and is partially finished
Neighborhood map
What this means for you Summary
Snapshot
- This is a 4-bed/3.0-bath single-family listed at $360k.
Deal economics
- At list price, monthly cash flow is $-249 ($-3k/yr) — negative.
- To cash-flow at today's rent, offer at most $316k (12.2% below list).
- To meet the 1% rule (rent ≥ 1% of price), the offer needs to be $280k (22.2% below list).
- Recommended offer: $280k (22.2% below list) — sets the bar for 1% rule.
- Cap rate 5.5% vs local median 4.2% in Perry Hall — top-decile yield for the area; either an underpriced asset or a hidden risk that comps aren't pricing in. Stress-test before assuming the spread holds.
Location & tenants
- Location reads 87/100 on livability (#8 in MD, #313 nationally) — a professional / high-income tenant draw. Strengths: employment A+, housing A+, health & safety A+; Watch: cost of living C-, crime D-.
- Baltimore County Public Schools (suburban): math 15% / reading 34% proficiency, ranked #11 of 24 in MD (top 46%) — low school quality limits family demand, transient renter base, plan for 1-2y turnover.
- Market conditions: 17 active listings in the ZIP; 1 comparable units currently listed for rent nearby; 1,511 units permitted in Baltimore County in 2024 (643 in 5+ unit buildings).
Forward outlook
- Local home prices are declining (-3.0%/yr); year-one equity from $2k of loan paydown is wiped out by about $11k of value loss. Plan a longer hold.
- Baltimore County population projected at +12% by 2050 — modest demand growth; plan on rents tracking national, not racing it.
Negotiation context
- It's been on market 25 days — a 2% lower offer ($355k) is reasonable based on typical stale-listing flexibility.
Risks & watch-outs
- Watch-outs: built in 1875 — expect roof / HVAC / electrical / plumbing capex.
- Climate carrying-cost: major wind risk, 27% chance of damaging wind over 30y; extreme-heat days projected 6→13/yr by 2055 (HVAC capex compounding) — expect insurance premiums to compound above CPI over the hold.
Questions for the listing agent
- What do current leases actually rent for vs. the listed asking? Can we see a recent rent roll and the last 12 months of T-12 income?
- Built in 1875 — when were the roof, HVAC, electrical panel, plumbing, and water heater last replaced?
- Is there a deadline driving the sale (1031 exchange, divorce, estate, relocation)? That informs how much negotiation room exists.
- Schools are A-rated — typically a magnet for longer-tenancy family renters. What's the average tenant stay here, and is there a school-zone premium baked into asking?
- Crime grade is D in this area — have there been break-ins, vandalism, or insurance claims at this property in the last 3 years? What carrier currently insures it and at what premium?
- The area grade is low — what's the realistic commute time and amenity access for the typical tenant pool here? Any planned neighborhood developments (good or bad) we should know about?
- What's the average days-on-market for RENTAL listings here right now (not sales)? A rising rental-DOM trend means longer vacancies and softer asking-rent achievability than the comps imply.
- What's the recent tenant-quality profile in this submarket — average credit score on applications, eviction rate, late-payment / NSF rate, and stable-employment percentage? A property-management company in the area should have these aggregated.
- How much new for-sale + rental construction is in the pipeline within 1–3 miles? Heavy new supply typically softens prices + rents 12–24 months out; constrained supply supports both.
Investment metrics
- 1% rule
- 0.78% ✗
- Cap rate
- 5.46%
- Cash-on-cash
- -2.97%
- DSCR
- 0.87
- GRM
- 10.7
CMA / ARV
- ARV (median comp)
- $493,798
- List price
- $359,900
- Delta
- -27.12%
- Verdict
- UNDERPRICED
- Comps
- 16 within 1.0 mi
Show comp detail 1 sale within ~0.75 mi
| Address | Dist | Beds/Ba | Sqft | Sold | Price | $/sf | Match |
|---|---|---|---|---|---|---|---|
| 9721 Hickoryhurst Dr | 0.69mi | 4/4.0 | 2,734 (-11%) | 6mo | $492,500 | $180 | 40 |
Match score weights: distance 35% · size 25% · config 20% · recency 20%. Top-matched comps best support the ARV.
Projected returns pro-forma
-3.0% appreciation · 3.0% rent growth · sell at horizon
- IRR
- -21.2%
- Equity multiple
- 0.26×
- Total profit
- $-74,175
- Equity at exit
- $53,662
- IRR
- -14.8%
- Equity multiple
- 0.16×
- Total profit
- $-84,934
- Equity at exit
- $31,118
Cash invested: $100,772 (down + closing). Projections, not guarantees.
Landlord ↔ Tenant lean methodology
- Overall (STATE)
- 27 Tenant-Leaning
- State Maryland
- 27 Tenant-Leaning · D+14
- County
- — inherits STATE
- City
- — inherits STATE
ZIP-level market 21057
- Home prices YoY
- -18.5%
- Active inventory
- 17
- Price-to-rent
- 10.7×
Monthly cashflow live
- Estimated rent
- $2,800 medium interval (Pro) →
- Mortgage (P&I)
- −$1,887
- Tax from tax record
- −$424 /mo · $5,089/yr
- Insurance
- −$150
- HOA
- −$0
- Vacancy / Maint / Mgmt
- −$588
- Net cashflow
- $-249
Break-even live
UW: 25.0% down · 7.5% · 30yr · 1.5% tax · 5.0% vac · 8.0% maint · 8.0% mgmt
Financing live
Cash to close
- Down payment
- $89,975
- Closing costs
- $10,797
- Reserves months
- —
- Total cash needed
- —
Loan-product check · same deal, 3 products live
Conventional
25% down · 7.5% · 30yr
- Down + closing
- —
- Monthly P&I
- —
- Monthly cashflow
- —
- DSCR
- —
- Eligible?
- —
Personal DTI + credit; lowest rate.
DSCR
20% down · 8.5% · 30yr
- Down + closing
- —
- Monthly P&I
- —
- Monthly cashflow
- —
- DSCR
- —
- Eligible?
- —
No personal income docs; deal must DSCR.
Hard money
10% down · 12.0% · 12mo
- Down + closing
- —
- Monthly P&I
- —
- Monthly cashflow
- —
- DSCR
- —
- Eligible?
- —
Short-term bridge; refi at stabilization.
Rent comps 1 comps
| Address | Beds | Baths | Sqft | Rent | $/sqft | DOM | Units | Dist |
|---|---|---|---|---|---|---|---|---|
| 4117 Baker Ln Nottingham, MD | 4.0 | 4.0 | 3100 | $2,800 | $0.90 | 17d | 1 | 1.37mi |
Listing history 7 events
-
2026-06-07statusdays on market $359,900 Pending 25 DOM
-
2026-06-04days on market $359,900 Active 23 DOM
-
2026-06-03days on market $359,900 Active 22 DOM
-
2026-06-02days on market $359,900 Active 21 DOM
-
2026-06-01days on market $359,900 Active 20 DOM
-
2026-05-31days on market $359,900 Active 19 DOM
-
2026-05-12$359,900 Active 1207-char remark
ⓘ Source: listings_history table (triggers on properties + properties_extension) + one-shot
backfill from property_details.listing_events for pre-trigger history.
Tax reassessment forecast MD · Partial reset (capped growth)
- Current annual tax
- $5,089 · $424/mo
- Projected year-2 tax
- $5,089 · $424/mo
- Expected delta
- $0/yr ($0/mo · 0.0%)
ⓘ Screening estimate from a state-policy table — verify with the county assessor before closing.
Climate risk First Street
- Flood 1/10 Low FEMA zone X (unshaded) · 0% chance over 30 yrs
- Wildfire 4/10 Moderate
- Heat 6/10 Major 6 d/yr ≥105°F today · 13 d/yr by 30 yrs out
- Wind 6/10 Major 27% chance of damaging wind over 30 yrs
- Air quality 4/10 Moderate 5 unhealthy d/yr today · 7 by 30 yrs out
Nearby sold comps map
Loading sold comps map…
Walkable amenities ~0.75 mi
Loading nearby amenities…
Taxation est. · year 1
- Rental income
- $33,600
- − Mortgage interest
- −$20,160
- − Property taxes
- −$5,089
- − Insurance
- −$1,800
- − Repairs & maintenance
- −$2,688
- − Management
- −$2,688
- − Depreciation
- −$10,470
- Taxable loss
- −$9,294
- Est. tax savings @ 24.0%
- +$2,231
- After-tax cash flow
- $-762/yr
For passive investors: Depreciation is non-cash, so a rental often shows a tax loss while cash-flowing — sheltering income. Rental losses are passive: they offset passive income freely, and up to $25,000/yr can offset ordinary (W-2) income if you actively participate and your MAGI is under $100k (phasing out to $0 by $150k); unused losses carry forward. On sale, claimed depreciation is recaptured at up to 25%, and gains may owe capital-gains tax (a 1031 exchange can defer both). Figures are a year-1 estimate at your 24.0% rate — not tax advice; consult a CPA.
Schools (NCES district)
- District
- Baltimore County Public Schools
- NCES district ID
- 2400120
- Math proficiency
- 15% ▼ -16.00%
- Reading proficiency
- 34% ▼ -5.00%
- Median HH income
- $66,746
- Composite
- 23.17/100
- National rank
- #7948
- State rank
- #11 of 24 in MD
Livability — Perry Hall
- Score
- 87/100
- State rank
- #8
- US rank
- #313
Category grades
Schools grade is shown separately in the Schools card above.
Census & demographics
- City population
- 15,501
- Population (ZIP)
- 4,463
Population outlook (Baltimore County) Hauer SSP2
- Today (2025)
- 885,518 people
- By 2030
- 909,272 · +2.7%
- By 2040
- 951,547 · +7.5%
- By 2050
- 990,955 · +11.9%
- By 2075
- 1,086,411 · +22.7%
- By 2100
- 1,135,078 · +28.2%
Race, ethnicity, and origin ACS 2023
- Neighborhood character
- Predominantly White (83%)
- Race & ethnicity
- White 83% Hispanic / Latino 8% Black 5% Two or more races 3% Asian 2%
- Hispanic origin (detail)
- Puerto Rican 6%
- Common ancestry
- Romanian 7% Italian 2% Slovak 1%
- Foreign-born
- 6% · Canada, Jamaica
- Languages at home
- 91% English-only · Spanish 4% Other Indo-European 2%
Political lean MEDSL · Baltimore
- 2024 margin
- Strong D (+24.5) · D 61.0% · R 36.5% · Other 2.5%
- 2008→2024 swing
- +9.9pp toward D · 2008: 14.6pp · 2024: 24.5pp
- All cycles
- 2024: D+24.5 2020: D+27.0 2016: D+17.4 2012: D+16.4 2008: D+14.6
Not yet ingested
- Civics
- —
Market trends
- HPI YoY
- ▼ -53.75%
- Current HPI
- 237.2063
- Rent YoY
- —
- Metro
- —
- State GDP YoY
- ▲ 2.97%
- F500 in state
- 12
Industry mix (Fortune 500 HQ in MD)
| Industry | F500 HQs | Revenue |
|---|---|---|
| Aerospace / Defense | 1 | $71B |
|
||
| Utilities | 1 | $25B |
|
||
| Hotels | 1 | $24B |
|
||
| Consumer Goods | 1 | $7B |
|
||
| Real Estate | 1 | $6B |
|
||
| Chemicals | 1 | $2B |
|
||
Price history
2 events — show timeline
- 2026-06-06 Pending — BRIGHT MLS
- 2026-05-12 Listed $359,900 BRIGHT MLS
Property tax history
+1.7%/yrLatest (2025): $5,089 · +5.0% YoY. Source: county tax records.
Cash-flow waterfall
monthlySold comps — $/sqft
last 12 mo · ≤1 miLoading sold comps…