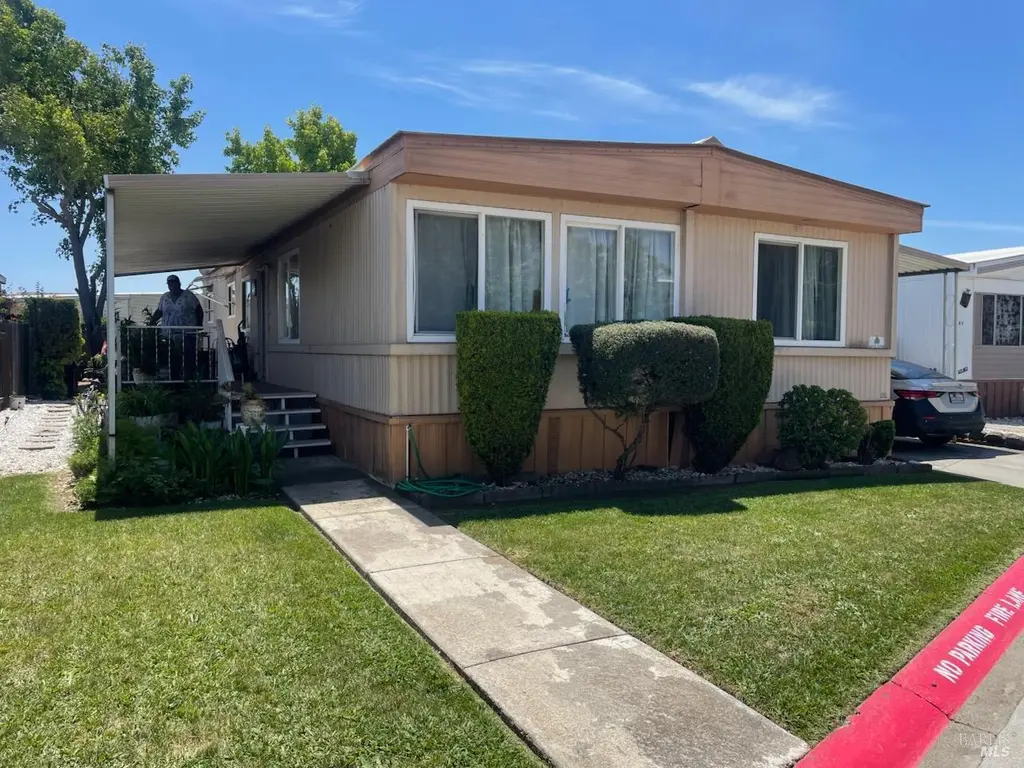
93 Lugo Dr · Fairfield, CA
Flood risk 4/10 · Minor
- FEMA flood zone
- X (unshaded)
- Chance of flooding over 30 yrs
- 0.22%
- Est. flood insurance / yr
- $507 – $1,088
Fire risk 6/10 · Moderate
- Est. fire insurance / yr
- $659 – $1,223
Heat risk 6/10 · Moderate
- Hot days now (above 97°F)
- 7 days/yr
- Hot days in 30 yrs
- 13 days/yr
Wind risk 1/10 · Minimal
- Chance of severe wind over 30 yrs
- —
Air-quality risk 10/10 · Severe
- Unhealthy air days now
- 21 days/yr
- Unhealthy air days in 30 yrs
- 22 days/yr
Risk factors via First Street. Map © Google.
Why this score? — see what drove the B+ grade
The composite is a weighted blend of 9 inputs, each scored 0–100. Each bar is that input's sub-score; the figure is the points it added to the 100-point composite (weight × sub-score).
- Cash flow +30.0/30.0
- ARV discount +15.0/15.0
- 1% rule +10.0/10.0
- DSCR +10.0/10.0
- Schools +3.5/10.0
- Livability +3.4/5.0
- Rent growth +2.5/5.0
- Condition / age +2.2/5.0
- Appreciation +0.0/10.0
$139,000
🖨 Deal sheet (PDF) 📄 Offer letter ✓ Due diligence
Listing remarks
Spacious 1,440 Sq. Ft. double-wide with 3 bedroom and 2 full bathrooms with central heat and air conditioning. Dover Mobile Home Park is an all-ages park in one of Fairfield's Most Desirable Mobile Home Parks, located near Travis Air Force Base and features family-friendly amenities including Swimming Pool, Spa, Exercise Room, Recreation Hall, Basketball Court, Barbecue Pits, Horse Shoe Pit, Library & Billiards.
Key facts
- Double-wide
- Spa
- Exercise room
Tags
Property features AI
Finance
- HOA & community: No homeowners association; Not a senior community
Exterior
- Parking: Covered parking for 2 vehicles
- Utilities: Gas plumbed; Public water; Public sewer
- Home design: Parkhome manufacturer (unknown); Metal skirting; Built in 1971
- Construction: Metal skirting
- Exterior features: Manufactured home in a park; Double wide; Land lease: $700
Interior
- Bedrooms: 3 bedrooms
- Flooring: Linoleum; Carpet
- Bathrooms: 2 full bathrooms; Tub with shower over
- Heating & cooling: Central cooling; Gas heating; Central heating
- Interior features: Pets allowed
- Laundry & utility: Indoor laundry area with gas hookup
Neighborhood map
What this means for you Summary
Snapshot
- This is a 3-bed/2.0-bath manufactured listed at $139k. Condition is rated fair.
Deal economics
- At list price, monthly cash flow is $1k ($15k/yr) — positive.
- The deal already cash-flows at list — no discount required.
- Meets the 1% rule at list price ($3k rent vs $139k).
- Cap rate 16.8% vs local median 3.0% in Fairfield — top-decile yield for the area; either an underpriced asset or a hidden risk that comps aren't pricing in. Stress-test before assuming the spread holds.
Location & tenants
- Location reads 67/100 on livability (#314 in CA) — a middle-class / working-renter tenant base. Strengths: employment A+, housing A+, health & safety A+; Watch: crime D-, commute F, cost of living F.
- Fairfield-Suisun Unified (urban): math 23% / reading 53% proficiency, ranked #238 of 517 in CA (top 46%) — families likely to look elsewhere, expect single-tenant / working-renter base with shorter leases.
- Zoned schools: Tolenas Academy of Music And Media (583 students, 61% FRL); Grange Middle (780 students, 73% FRL); Fairfield High (math 16% / reading 41%, grade F, #774 of 1,170 statewide, top 66%, 1,633 students, 58% FRL) — zoned schools average 64% FRL vs 47% district-wide (17 pts higher); higher-poverty schools than district average — tighter screening recommended.
- Market conditions: Rents flat; 265 active listings in the ZIP; 22 comparable units currently listed for rent nearby; rentals at typical pace (median 25d on market — plan ~3-4 weeks tenant-placement turnaround); 41% of comp listings sitting > 30 days — soft ceiling on asking rent; solid renter incomes; 1,472 units permitted in Solano County in 2024 (131 in 5+ unit buildings).
- This rent runs 38% of the median local income ($87k/yr) — at the standard rent-burdened threshold; future hikes will face affordability resistance.
Forward outlook
- Local home prices are declining (-3.0%/yr); year-one equity from $961 of loan paydown is wiped out by about $4k of value loss. Plan a longer hold.
- Solano County population projected at +15% by 2050 — modest demand growth; plan on rents tracking national, not racing it.
- At projected returns (-3.0% appreciation + 0.1% rent growth), your $39k cash investment doubles in ~4 years — after that, you're playing with house money.
Negotiation context
- Only 10 days on market — expect competitive offers; lowballing is unlikely to land.
Risks & watch-outs
- Climate carrying-cost: major wildfire risk; extreme-heat days projected 7→13/yr by 2055 (HVAC capex compounding) — expect insurance premiums to compound above CPI over the hold.
Questions for the listing agent
- Have any recent inspections been done? Can we get a copy of the seller's disclosures and any deferred-maintenance estimates?
- Built in 1971 — when were the roof, HVAC, electrical panel, plumbing, and water heater last replaced?
- Is there a deadline driving the sale (1031 exchange, divorce, estate, relocation)? That informs how much negotiation room exists.
- Crime grade is D in this area — have there been break-ins, vandalism, or insurance claims at this property in the last 3 years? What carrier currently insures it and at what premium?
- What's the average days-on-market for RENTAL listings here right now (not sales)? A rising rental-DOM trend means longer vacancies and softer asking-rent achievability than the comps imply.
- What's the recent tenant-quality profile in this submarket — average credit score on applications, eviction rate, late-payment / NSF rate, and stable-employment percentage? A property-management company in the area should have these aggregated.
- How much new for-sale + rental construction is in the pipeline within 1–3 miles? Heavy new supply typically softens prices + rents 12–24 months out; constrained supply supports both.
Investment metrics
- 1% rule
- 1.98% ✓
- Cap rate
- 16.75%
- Cash-on-cash
- 37.35%
- DSCR
- 2.66
- GRM
- 4.2
CMA / ARV
- ARV (on-the-fly)
- $214,560
- Comps found
- 11
Show comp detail 11 sales within ~0.75 mi
| Address | Dist | Beds/Ba | Sqft | Sold | Price | $/sf | Match |
|---|---|---|---|---|---|---|---|
| 137 Valencia | 0.06mi | 3/2.0 | 1,344 (-7%) | 2mo | $159,000 | $118 | 85 |
| 51 Barcelona Cir | 0.04mi | 3/2.0 | 1,560 (+8%) | 7mo | $232,000 | $149 | 78 |
| 41 Bel Air Cir | 0.34mi | 3/2.0 | 1,440 (0%) | 13mo | $272,000 | $189 | 74 |
| 131 Zaragoza Dr | 0.06mi | 3/2.0 | 1,340 (-7%) | 16mo | $213,000 | $159 | 72 |
| 120 Century Ct Ct | 0.29mi | 2/2.0 (-1) | 1,368 (-5%) | 4mo | $225,000 | $164 | 69 |
| 190 Granada Dr | 0.17mi | 3/2.0 | 1,344 (-7%) | 17mo | $40,000 | $30 | 66 |
| 126 Chevy Chase Ct | 0.29mi | 3/2.0 | 1,550 (+8%) | 9mo | $225,000 | $145 | 66 |
| 131 Chevy Chase Ct | 0.26mi | 2/2.0 (-1) | 1,344 (-7%) | 10mo | $222,000 | $165 | 64 |
| 158 Olympic Ct | 0.22mi | 3/2.0 | 1,344 (-7%) | 22mo | $230,000 | $171 | 60 |
| 49 Bel Air Cir | 0.28mi | 2/2.0 (-1) | 1,594 (+11%) | 16mo | $190,000 | $119 | 50 |
| 144 Northridge Ct | 0.25mi | 2/2.0 (-1) | 1,640 (+14%) | 15mo | $239,000 | $146 | 48 |
Match score weights: distance 35% · size 25% · config 20% · recency 20%. Top-matched comps best support the ARV.
Projected returns pro-forma
-3.0% appreciation · 0.15% rent growth · sell at horizon
- IRR
- 30.0%
- Equity multiple
- 2.21×
- Total profit
- $47,003
- Equity at exit
- $20,725
- IRR
- 35.6%
- Equity multiple
- 3.85×
- Total profit
- $110,731
- Equity at exit
- $12,018
Cash invested: $38,920 (down + closing). Projections, not guarantees.
Landlord ↔ Tenant lean methodology
- Overall (STATE)
- 18 Strongly Tenant-Friendly
- State California
- 18 Strongly Tenant-Friendly · D+13
- County
- — inherits STATE
- City
- — inherits STATE
ZIP-level market 94533
- Rents YoY
- 0.1%
- Active inventory
- 265
- Price-to-rent
- 4.2×
Monthly cashflow live
- Estimated rent
- $2,749 high interval (Pro) →
- Mortgage (P&I)
- −$729
- Tax est. 1.5%
- −$174 /mo · $2,085/yr
- Insurance
- −$58
- HOA
- −$0
- Vacancy / Maint / Mgmt
- −$577
- Net cashflow
- $1,211
Break-even live
Sensitivity live
| Price | -10% $1,307 | -5% $1,259 | +0% $1,211 | +5% $1,163 | +10% $1,115 |
|---|---|---|---|---|---|
| Rent | -10% $994 | -5% $1,103 | +0% $1,211 | +5% $1,320 | +10% $1,429 |
| Rate | -1.0pp $1,281 | -0.5pp $1,247 | base $1,211 | +0.5pp $1,175 | +1.0pp $1,139 |
UW: 25.0% down · 7.5% · 30yr · 1.5% tax · 5.0% vac · 8.0% maint · 8.0% mgmt
Financing live
Cash to close
- Down payment
- $34,750
- Closing costs
- $4,170
- Reserves months
- —
- Total cash needed
- —
Loan-product check · same deal, 3 products live
Conventional
25% down · 7.5% · 30yr
- Down + closing
- —
- Monthly P&I
- —
- Monthly cashflow
- —
- DSCR
- —
- Eligible?
- —
Personal DTI + credit; lowest rate.
DSCR
20% down · 8.5% · 30yr
- Down + closing
- —
- Monthly P&I
- —
- Monthly cashflow
- —
- DSCR
- —
- Eligible?
- —
No personal income docs; deal must DSCR.
Hard money
10% down · 12.0% · 12mo
- Down + closing
- —
- Monthly P&I
- —
- Monthly cashflow
- —
- DSCR
- —
- Eligible?
- —
Short-term bridge; refi at stabilization.
Rent comps 22 comps
| Address | Beds | Baths | Sqft | Rent | $/sqft | DOM | Units | Dist |
|---|---|---|---|---|---|---|---|---|
| 1431 Catlin Ct Fairfield, CA | 3.0 | 2.0 | 1696 | $2,750 | $1.62 | 45d | 1 | 0.60mi |
| 1648 Little Rock Cir Suisun City, CA | 3.0 | 3.0 | 1839 | $3,300 | $1.79 | 45d | 1 | 0.70mi |
| 1648 Little Rock Cir Suisun City, CA | 3.0 | 3.0 | 1839 | $3,300 | $1.79 | 23d | 1 | 0.70mi |
| 2000 Clay Bank Rd Fairfield, CA | 1.0–2.0 | 1.0–2.0 | 834 | $2,699 | $3.24 | 0d | 12 | 0.87mi |
| 745 Monte Carlo Dr Suisun City, CA | 4.0 | 3.0 | 1775 | $3,400 | $1.92 | 15d | 1 | 1.00mi |
| 1400 Humphrey Dr Suisun City, CA | 2.0–3.0 | 1.5 | 1075 | $2,425 | $2.26 | 5d | 4 | 1.00mi |
| 1335 Phillip Way Suisun City, CA | 3.0 | 2.5 | 1606 | $3,000 | $1.87 | 15d | 1 | 1.02mi |
| 89 Villa Cir Fairfield, CA | 2.0 | 1.5 | 968 | $1,900 | $1.96 | 25d | 1 | 1.04mi |
| 1930 Grande Cir #77 Fairfield, CA | 2.0 | 2.0 | 1095 | $1,750 | $1.60 | 45d | 1 | 1.05mi |
| 1990 Grande Cir Fairfield, CA | 2.0 | 1.0–1.5 | 895 | $2,135 | $2.39 | 5d | 15 | 1.06mi |
| 1970 Grande Cir #19 Fairfield, CA | 2.0 | 1.5 | 1095 | $2,200 | $2.01 | 25d | 1 | 1.08mi |
| 1960 Grande Cir #42 Fairfield, CA | 3.0 | 1.5 | 1176 | $2,500 | $2.13 | 45d | 1 | 1.10mi |
| 1955 Grande Cir Unit U Fairfield, CA | 2.0 | 1.5 | 964 | $1,800 | $1.87 | 45d | 1 | 1.17mi |
| 1955 Grande Cir Unit U Fairfield, CA | 2.0 | 1.5 | 964 | $1,800 | $1.87 | 15d | 1 | 1.17mi |
| 1930 Manor Pl Unit 1 Fairfield, CA | 2.0 | 1.5 | 1100 | $2,150 | $1.95 | 23d | 1 | 1.18mi |
| 2776 Woodmont Dr Fairfield, CA | 3.0 | 2.5 | 1578 | $2,995 | $1.90 | 45d | 1 | 1.30mi |
| 1513 Casa Loma Way Suisun City, CA | 3.0 | 2.0 | 1334 | $3,500 | $2.62 | 15d | 1 | 1.31mi |
| 1037 Mockingbird Ln Fairfield, CA | 3.0 | 2.0 | 1476 | $2,695 | $1.83 | 45d | 1 | 1.35mi |
| 1104 Waxwing Dr Suisun City, CA | 3.0 | 2.0 | 1279 | $3,079 | $2.41 | 45d | 1 | 1.39mi |
| 1349 Blossom Ave Fairfield, CA | 1.0–3.0 | 1.0–3.0 | 1017 | $3,340 | $3.28 | 3d | 11 | 1.39mi |
| 2751 Peppertree Dr Fairfield, CA | 2.0 | 1.0–2.0 | 726 | $2,175 | $2.99 | 15d | 7 | 1.49mi |
| 2916 Cascade Cir Fairfield, CA | 3.0 | 2.0 | 1080 | $2,850 | $2.64 | 45d | 1 | 1.49mi |
Listing history 8 events
-
2026-06-15status $139,000 Pending 10 DOM
-
2026-06-15days on market $139,000 Active 10 DOM
-
2026-06-14days on market $139,000 Active 8 DOM
-
2026-06-10days on market $139,000 Active 5 DOM
-
2026-06-09days on market $139,000 Active 4 DOM
-
2026-06-08days on market $139,000 Active 3 DOM
-
2026-06-07remarks 421-char remark
-
2026-06-07$139,000 Active 2 DOM
ⓘ Source: listings_history table (triggers on properties + properties_extension) + one-shot
backfill from property_details.listing_events for pre-trigger history.
Climate risk First Street
- Flood 4/10 Moderate FEMA zone X (unshaded) · 22% chance over 30 yrs
- Wildfire 6/10 Major
- Heat 6/10 Major 7 d/yr ≥97°F today · 13 d/yr by 30 yrs out
- Wind 1/10 Low
- Air quality 10/10 Extreme 21 unhealthy d/yr today · 22 by 30 yrs out
Nearby sold comps map
Loading sold comps map…
Walkable amenities ~0.75 mi
Loading nearby amenities…
Taxation est. · year 1
- Rental income
- $32,992
- − Mortgage interest
- −$7,786
- − Property taxes
- −$2,085
- − Insurance
- −$695
- − Repairs & maintenance
- −$2,639
- − Management
- −$2,639
- − Depreciation
- −$4,044
- Taxable income
- $13,103
- Est. tax owed @ 24.0%
- −$3,145
- After-tax cash flow
- $11,391/yr
For passive investors: Depreciation is non-cash, so a rental often shows a tax loss while cash-flowing — sheltering income. Rental losses are passive: they offset passive income freely, and up to $25,000/yr can offset ordinary (W-2) income if you actively participate and your MAGI is under $100k (phasing out to $0 by $150k); unused losses carry forward. On sale, claimed depreciation is recaptured at up to 25%, and gains may owe capital-gains tax (a 1031 exchange can defer both). Figures are a year-1 estimate at your 24.0% rate — not tax advice; consult a CPA.
Condition & rehab AI · 11 photos
This manufactured home requires moderate repairs and maintenance, including painting, HVAC replacement, and landscaping. These updates will significantly improve its resale and rental value.
Repairs flagged
- Major HVAC unit — Visible wear and tear
- Moderate exterior siding — Weathered and discolored
- Major interior walls — Worn paint
Value-add opportunities
- Both Paint interior walls — Fresh paint enhances curb appeal and interior aesthetics
- Both Replace HVAC unit — A new HVAC system improves comfort and energy efficiency
- Both Landscaping — Well-maintained landscaping enhances curb appeal and property value
Renovation cost estimate screening
| Repair item | Severity | Est. cost |
|---|---|---|
| HVAC unit · Visible wear and tear | Major | $15,000–50,000 |
| exterior siding · Weathered and discolored | Moderate | $3,000–15,000 |
| interior walls · Worn paint | Major | $15,000–50,000 |
| Total estimated repair cost · 3 items | $33,000–115,000 |
Value-add ROI direction
- Both Paint interior walls — Fresh paint enhances curb appeal and interior aesthetics ↑
- Both Replace HVAC unit — A new HVAC system improves comfort and energy efficiency ↑
- Both Landscaping — Well-maintained landscaping enhances curb appeal and property value ↑
ⓘ Cost ranges are severity-bucket heuristics (US national rule-of-thumb). Get contractor quotes + a written scope before underwriting a rehab budget.
Schools (NCES district)
- District
- Fairfield-Suisun Unified
- NCES district ID
- 0613360
- Math proficiency
- 23% ▼ -10.00%
- Reading proficiency
- 53% ▲ 8.00%
- Median HH income
- $69,654
- Composite
- 34.59/100
- National rank
- #5157
- State rank
- #238 of 517 in CA
Livability — Fairfield
- Score
- 67/100
- State rank
- #314
- US rank
- #10551
Category grades
Schools grade is shown separately in the Schools card above.
Census & demographics
- Census place
- Fairfield, CA
- County
- Solano County · 433,239 people
- City population
- 120,008
- Metro
- Vallejo, CA
- Population (ZIP)
- 78,805
- Household income
- $87,384
- Rent vs Own
- Severe rent burden
- 3474.0
Population outlook (Solano County) Hauer SSP2
- Today (2025)
- 478,685 people
- By 2030
- 497,974 · +4.0%
- By 2040
- 528,515 · +10.4%
- By 2050
- 549,115 · +14.7%
- By 2075
- 587,229 · +22.7%
- By 2100
- 571,378 · +19.4%
Race, ethnicity, and origin ACS 2023
- Neighborhood character
- Highly diverse neighborhood (Simpson 0.75)
- Race & ethnicity
- Hispanic / Latino 39% White 23% Black 16% Two or more races 16% Asian 14% Pacific Islander 1%
- Hispanic origin (detail)
- Mexican 34%
- Common ancestry
- Italian 5% Lithuanian 1% Slovak 1%
- Foreign-born
- 26% · Canada, Vietnam, China
- Languages at home
- 59% English-only · Spanish 28% Tagalog/Filipino 6% Other Indo-European 2%
Political lean MEDSL · Solano
- 2024 margin
- Strong D (+23.0) · D 60.0% · R 37.1% · Other 2.9%
- 2008→2024 swing
- -5.6pp toward R · 2008: 28.6pp · 2024: 23.0pp
- All cycles
- 2024: D+23.0 2020: D+30.3 2016: D+30.5 2012: D+28.1 2008: D+28.6
Not yet ingested
- Civics
- —
Market trends
- HPI YoY
- ▼ -258.88%
- Current HPI
- 285.4365
- Rent YoY
- ▲ 0.15%
- Metro
- Vallejo, CA
- State GDP YoY
- ▲ 3.21%
- F500 in state
- 116
Industry mix (Fortune 500 HQ in CA)
| Industry | F500 HQs | Revenue |
|---|---|---|
| Technology | 27 | $1,492B |
|
||
| Financial Services | 3 | $174B |
|
||
| Retail | 3 | $44B |
|
||
| Insurance | 3 | $26B |
|
||
| Media / Entertainment | 2 | $115B |
|
||
| Pharmaceuticals / Biotech | 2 | $62B |
|
||
Cash-flow waterfall
monthlySold comps — $/sqft
last 12 mo · ≤1 miLoading sold comps…