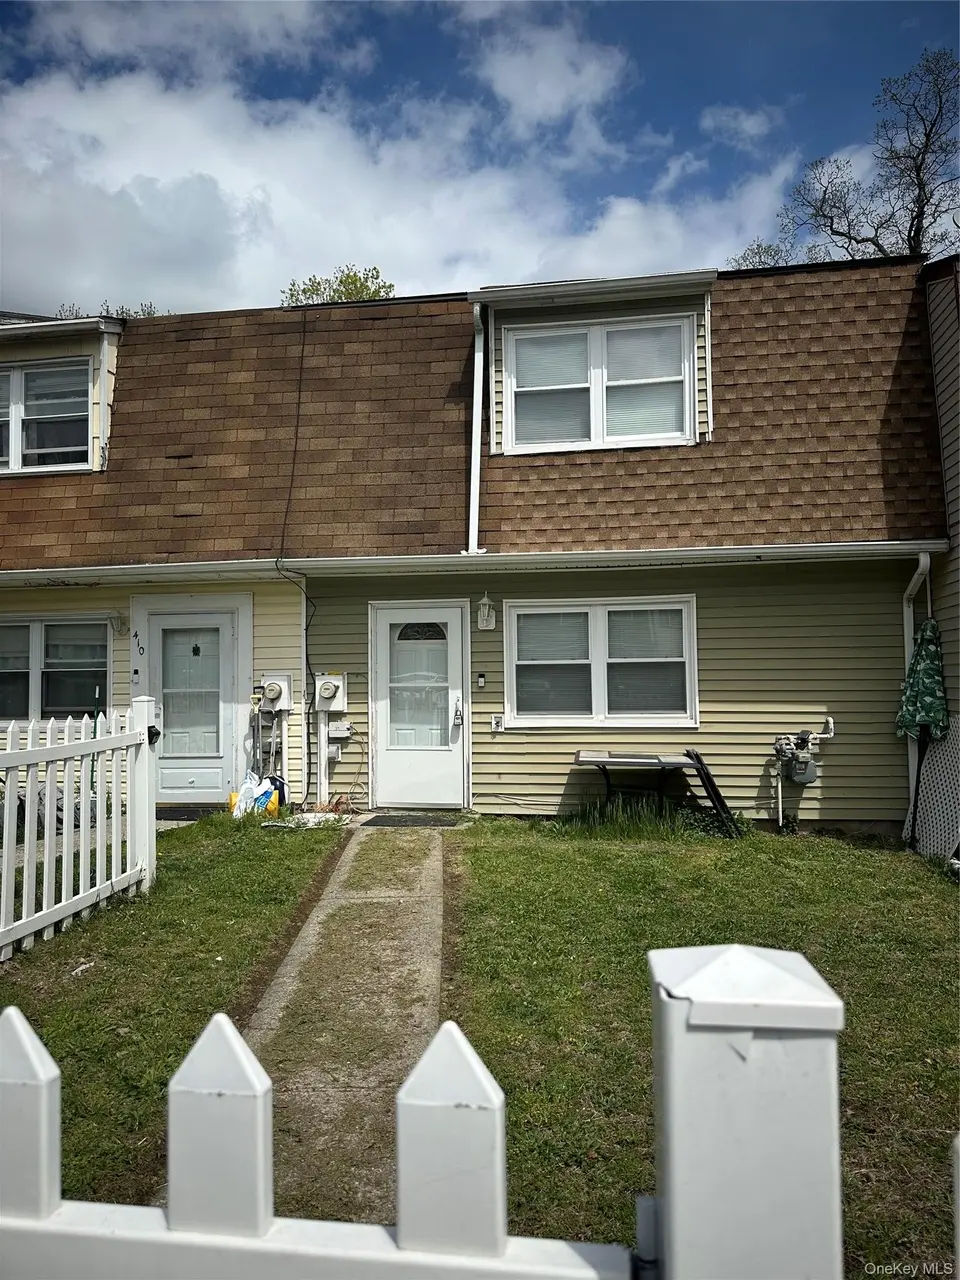
408 Watts Ln · Maybrook, NY
Flood risk 1/10 · Minimal
- FEMA flood zone
- X (unshaded)
- Chance of flooding over 30 yrs
- 0.0%
- Est. flood insurance / yr
- $507 – $1,088
Fire risk 1/10 · Minimal
- Est. fire insurance / yr
- $691 – $1,283
Heat risk 5/10 · Moderate
- Hot days now (above 97°F)
- 7 days/yr
- Hot days in 30 yrs
- 16 days/yr
Wind risk 4/10 · Minor
- Chance of severe wind over 30 yrs
- 10.0%
Air-quality risk 2/10 · Minimal
- Unhealthy air days now
- 1 days/yr
- Unhealthy air days in 30 yrs
- 2 days/yr
Risk factors via First Street. Map © Google.
Why this score? — see what drove the C grade
The composite is a weighted blend of 9 inputs, each scored 0–100. Each bar is that input's sub-score; the figure is the points it added to the 100-point composite (weight × sub-score).
- Cash flow +18.2/30.0
- ARV discount +15.0/15.0
- 1% rule +5.9/10.0
- DSCR +5.7/10.0
- Schools +4.8/10.0
- Livability +3.5/5.0
- Rent growth +2.5/5.0
- Condition / age +2.5/5.0
- Appreciation +0.0/10.0
$225,000
🖨 Deal sheet 📄 Offer letter ✓ Due diligence
Listing remarks MLS
Come see this oversized townhome (1400 Sq ft!) Home has nice eat in kitchen and room for the family-plus convenient fenced in yard for your pets. Dont wait!
Key facts
- 2,340 sq ft lot
- Built 1974
- Listed 34 days
Property features AI
Exterior
- Parking: Common parking
- Utilities: Public sewer; Electricity connected
- Home design: Townhouse; Single family residence; Living area reported from public records
- Construction: Frame construction
- Exterior features: Frame construction; Not waterfront
Interior
- Kitchen: Gas oven
- Bedrooms: Total of 7 rooms (bedroom count not specified)
- Bathrooms: 1 full bathroom; 1 half bathroom
- Heating & cooling: Baseboard heating; Other heating; No air conditioning
- Interior features: Additional unspecified interior features
Neighborhood map
What this means for you Summary
Snapshot
- This is a 3-bed/1.5-bath townhouse listed at $225k.
Deal economics
- At list price, monthly cash flow is $204 ($2k/yr) — positive.
- The deal already cash-flows at list — no discount required.
- Meets the 1% rule at list price ($2k rent vs $225k).
- Recommended offer: $218k (3.0% below list) — sets the bar for market timing.
- Cap rate 7.4% vs local median 2.2% in Maybrook — top-decile yield for the area; either an underpriced asset or a hidden risk that comps aren't pricing in. Stress-test before assuming the spread holds.
Location & tenants
- Location reads 70/100 on livability (#423 in NY) — a middle-class / working-renter tenant base. Strengths: employment A+, housing A+, health & safety A+; Watch: amenities F, commute F.
- Valley Central School District (Montgomery) (rural): math 54% / reading 53% proficiency, ranked #299 of 590 in NY (top 51%) — acceptable for families but not a draw, mixed tenant base, ~2y average lease.
- Zoned schools: Montgomery Elementary School (math 37% / reading 42%, grade F, #1,444 of 2,108 statewide, top 71%, 548 students, 34% FRL); Valley Central Middle School (math 28% / reading 42%, grade F, #480 of 729 statewide, top 66%, 982 students, 41% FRL); Valley Central High School (math 95% / reading 87%, grade A+, #203 of 1,100 statewide, top 20%, 1,346 students, 39% FRL).
- Market conditions: 17 active listings in the ZIP; 9 comparable units currently listed for rent nearby; rentals at typical pace (median 14d on market — plan ~3-4 weeks tenant-placement turnaround); 1,746 units permitted in Orange County in 2024 (1,265 in 5+ unit buildings).
Forward outlook
- Local home prices are declining (-3.0%/yr); year-one equity from $2k of loan paydown is wiped out by about $7k of value loss. Plan a longer hold.
Negotiation context
- It's been on market 34 days — a 3% lower offer ($218k) is reasonable based on typical stale-listing flexibility.
- 6 sale attempts since 24y ago with the ask held roughly flat each time — persistent listings suggest the price (not the market) is what's stuck; bring a comps-based counter.
Risks & watch-outs
- Climate carrying-cost: extreme-heat days projected 7→16/yr by 2055 (HVAC capex compounding) — expect insurance premiums to compound above CPI over the hold.
Questions for the listing agent
- It's been on market 34 days. Have you received any prior offers? Is the seller open to a 3% concession, seller financing, or rate buy-down credit?
- Built in 1974 — when were the roof, HVAC, electrical panel, plumbing, and water heater last replaced?
- Is there a deadline driving the sale (1031 exchange, divorce, estate, relocation)? That informs how much negotiation room exists.
- Schools are F-rated, which usually means shorter tenancies and higher turnover. Who's the typical renter profile here, and what's been the actual vacancy rate?
- What's the average days-on-market for RENTAL listings here right now (not sales)? A rising rental-DOM trend means longer vacancies and softer asking-rent achievability than the comps imply.
- What's the recent tenant-quality profile in this submarket — average credit score on applications, eviction rate, late-payment / NSF rate, and stable-employment percentage? A property-management company in the area should have these aggregated.
- How much new for-sale + rental construction is in the pipeline within 1–3 miles? Heavy new supply typically softens prices + rents 12–24 months out; constrained supply supports both.
Investment metrics
- 1% rule
- 1.09% ✓
- Cap rate
- 7.38%
- Cash-on-cash
- 3.88%
- DSCR
- 1.17
- GRM
- 7.7
CMA / ARV
- ARV (median comp)
- $313,133
- List price
- $225,000
- Delta
- -28.15%
- Verdict
- UNDERPRICED
- Comps
- 20 within 1.0 mi
Show comp detail 10 sales within ~0.75 mi
| Address | Dist | Beds/Ba | Sqft | Sold | Price | $/sf | Match |
|---|---|---|---|---|---|---|---|
| 405 Watts Ln | 0.03mi | 3/1.5 | 1,324 (-5%) | 13mo | $312,000 | $236 | 79 |
| 411 Watts Ln | 0.03mi | 3/1.5 | 1,400 (0%) | 24mo | $299,000 | $214 | 79 |
| 207 Everett Pl | 0.16mi | 3/1.5 | 1,380 (-1%) | 15mo | $312,500 | $226 | 77 |
| 127 Blake Rd | 0.05mi | 3/1.5 | 1,320 (-6%) | 15mo | $260,000 | $197 | 76 |
| 410 Rakov Rd | 0.05mi | 3/1.5 | 1,324 (-5%) | 23mo | $259,900 | $196 | 70 |
| 408 Rakov Rd | 0.05mi | 3/1.5 | 1,324 (-5%) | 23mo | $277,000 | $209 | 69 |
| 536 Saracino Dr | 0.14mi | 3/1.5 | 1,324 (-5%) | 21mo | $295,000 | $223 | 67 |
| 219 Blake Rd | 0.08mi | 3/1.5 | 1,220 (-13%) | 10mo | $265,000 | $217 | 66 |
| 210 Country Club Dr | 0.11mi | 4/2.0 (+1) | 1,456 (+4%) | 20mo | $270,000 | $185 | 64 |
| 543 Saracino Dr | 0.16mi | 3/1.5 | 1,220 (-13%) | 21mo | $260,000 | $213 | 54 |
Match score weights: distance 35% · size 25% · config 20% · recency 20%. Top-matched comps best support the ARV.
Projected returns pro-forma
-3.0% appreciation · 3.0% rent growth · sell at horizon
- IRR
- -10.1%
- Equity multiple
- 0.63×
- Total profit
- $-23,335
- Equity at exit
- $33,548
- IRR
- -0.7%
- Equity multiple
- 0.95×
- Total profit
- $-3,020
- Equity at exit
- $19,454
Cash invested: $63,000 (down + closing). Projections, not guarantees.
Landlord ↔ Tenant lean methodology
- Overall (STATE)
- 15 Strongly Tenant-Friendly
- State New York
- 15 Strongly Tenant-Friendly · D+10
- County
- — inherits STATE
- City
- — inherits STATE
ZIP-level market 12543
- Home prices YoY
- -6.2%
- Active inventory
- 17
- Price-to-rent
- 7.7×
Monthly cashflow live
- Estimated rent
- $2,447 high interval (Pro) →
- Mortgage (P&I)
- −$1,180
- Tax from tax record
- −$456 /mo · $5,472/yr
- Insurance
- −$94
- HOA
- −$0
- Vacancy / Maint / Mgmt
- −$514
- Net cashflow
- $204
Break-even live
UW: 25.0% down · 7.5% · 30yr · 1.5% tax · 5.0% vac · 8.0% maint · 8.0% mgmt
Financing live
Cash to close
- Down payment
- $56,250
- Closing costs
- $6,750
- Reserves months
- —
- Total cash needed
- —
Loan-product check · same deal, 3 products live
Conventional
25% down · 7.5% · 30yr
- Down + closing
- —
- Monthly P&I
- —
- Monthly cashflow
- —
- DSCR
- —
- Eligible?
- —
Personal DTI + credit; lowest rate.
DSCR
20% down · 8.5% · 30yr
- Down + closing
- —
- Monthly P&I
- —
- Monthly cashflow
- —
- DSCR
- —
- Eligible?
- —
No personal income docs; deal must DSCR.
Hard money
10% down · 12.0% · 12mo
- Down + closing
- —
- Monthly P&I
- —
- Monthly cashflow
- —
- DSCR
- —
- Eligible?
- —
Short-term bridge; refi at stabilization.
Rent comps 9 comps
| Address | Beds | Baths | Sqft | Rent | $/sqft | DOM | Units | Dist |
|---|---|---|---|---|---|---|---|---|
| 524 Saracino Dr Maybrook, NY | 3.0 | 1.5 | 1324 | $2,600 | $1.96 | 23d | 1 | 0.10mi |
| 205 Everett Pl Maybrook, NY | 3.0 | 1.5 | 1280 | $2,600 | $2.03 | 43d | 1 | 0.18mi |
| 503 Bluestone Ct Unit 208 Maybrook, NY | 2.0 | 1.5 | 1040 | $2,100 | $2.02 | 14d | 1 | 0.67mi |
| 704 Tower Ave Unit A Maybrook, NY | 2.0 | 1.0 | 1000 | $1,900 | $1.90 | 14d | 1 | 0.72mi |
| 306 Bluestone Ct Unit 223 Maybrook, NY | 2.0 | 2.0 | 1070 | $2,450 | $2.29 | 14d | 1 | 0.76mi |
| 306 Bluestone Ct Unit 116 Maybrook, NY | 2.0 | 1.0 | 935 | $2,250 | $2.41 | 14d | 1 | 0.76mi |
| 401 Bluestone Ct Unit 202 Maybrook, NY | 2.0 | 1.0 | 1040 | $2,000 | $1.92 | 21d | 1 | 0.80mi |
| 304 Tower Ave Maybrook, NY | 2.0 | 1.0 | 906 | $2,200 | $2.43 | 14d | 1 | 0.95mi |
| 201 Main St Apt 5 Maybrook, NY | 2.0 | 1.0 | 1000 | $1,700 | $1.70 | 14d | 1 | 0.98mi |
Listing history 32 events
-
2026-06-18days on market $225,000 Active 34 DOM
-
2026-06-17days on market $225,000 Active 33 DOM
-
2026-06-16days on market $225,000 Active 32 DOM
-
2026-06-15days on market $225,000 Active 31 DOM
-
2026-06-14days on market $225,000 Active 29 DOM
-
2026-06-10days on market $225,000 Active 26 DOM
-
2026-06-09days on market $225,000 Active 25 DOM
-
2026-06-08days on market $225,000 Active 24 DOM
-
2026-06-07days on market $225,000 Active 23 DOM
-
2026-06-05days on market $225,000 Active 20 DOM
-
2026-06-03days on market $225,000 Active 19 DOM
-
2026-06-02days on market $225,000 Active 18 DOM
-
2026-06-01days on market $225,000 Active 17 DOM
-
2026-05-31days on market $225,000 Active 16 DOM
-
2026-05-30days on market $225,000 Active 15 DOM
-
2026-05-15$225,000 Active 165-char remark
-
2024-12-12$299,900 Active
-
2013-12-18price $189,300
Show marketing remark (156 chars)
Come see this oversized townhome (1400 Sq ft!) Home has nice eat in kitchen and room for the family-plus convenient fenced in yard for your pets. Dont wait!
-
2012-10-31historical
-
2012-10-31historical
-
2012-04-24$83,800
-
2012-04-24
-
2006-08-10soldstatus $197,160
-
2006-06-28soldstatus $197,160
Show marketing remark (156 chars)
Come see this oversized townhome (1400 Sq ft!) Home has nice eat in kitchen and room for the family-plus convenient fenced in yard for your pets. Dont wait!
-
2006-06-02historical
Show marketing remark (156 chars)
Come see this oversized townhome (1400 Sq ft!) Home has nice eat in kitchen and room for the family-plus convenient fenced in yard for your pets. Dont wait!
-
2006-02-02$197,160
Show marketing remark (156 chars)
Come see this oversized townhome (1400 Sq ft!) Home has nice eat in kitchen and room for the family-plus convenient fenced in yard for your pets. Dont wait!
-
2002-11-27soldstatus $114,500
-
2002-11-25soldstatus $114,500
-
2002-10-07historical
-
2002-10-07price $120,000
-
2002-09-11$114,500
-
1989-09-28soldstatus $90,000
ⓘ Source: listings_history table (triggers on properties + properties_extension) + one-shot
backfill from property_details.listing_events for pre-trigger history.
Tax reassessment forecast NY · Partial reset (capped growth)
- Current annual tax
- $5,472 · $456/mo
- Projected year-2 tax
- $5,472 · $456/mo
- Expected delta
- $0/yr ($0/mo · 0.0%)
ⓘ Screening estimate from a state-policy table — verify with the county assessor before closing.
Climate risk First Street
- Flood 1/10 Low FEMA zone X (unshaded) · 0% chance over 30 yrs
- Wildfire 1/10 Low
- Heat 5/10 Major 7 d/yr ≥97°F today · 16 d/yr by 30 yrs out
- Wind 4/10 Moderate 10% chance of damaging wind over 30 yrs
- Air quality 2/10 Low 1 unhealthy d/yr today · 2 by 30 yrs out
Nearby sold comps map
Loading sold comps map…
Walkable amenities ~0.75 mi
Loading nearby amenities…
Taxation est. · year 1
- Rental income
- $29,370
- − Mortgage interest
- −$12,603
- − Property taxes
- −$5,472
- − Insurance
- −$1,125
- − Repairs & maintenance
- −$2,350
- − Management
- −$2,350
- − Depreciation
- −$6,545
- Taxable loss
- −$1,076
- Est. tax savings @ 24.0%
- +$258
- After-tax cash flow
- $2,704/yr
For passive investors: Depreciation is non-cash, so a rental often shows a tax loss while cash-flowing — sheltering income. Rental losses are passive: they offset passive income freely, and up to $25,000/yr can offset ordinary (W-2) income if you actively participate and your MAGI is under $100k (phasing out to $0 by $150k); unused losses carry forward. On sale, claimed depreciation is recaptured at up to 25%, and gains may owe capital-gains tax (a 1031 exchange can defer both). Figures are a year-1 estimate at your 24.0% rate — not tax advice; consult a CPA.
Schools (NCES district)
- District
- Valley Central School District (Montgomery)
- NCES district ID
- 3619680
- Math proficiency
- 54% ▼ -7.00%
- Reading proficiency
- 53% ▲ 1.00%
- Median HH income
- $69,186
- Composite
- 47.53/100
- National rank
- #2271
- State rank
- #299 of 590 in NY
Livability — Maybrook
- Score
- 70/100
- State rank
- #423
- US rank
- #7384
Category grades
Schools grade is shown separately in the Schools card above.
Census & demographics
- Census place
- Maybrook, NY
- Population (ZIP)
- 3,147
Population outlook (Orange County) Hauer SSP2
- Today (2025)
- 379,830 people
- By 2030
- 378,955 · -0.2%
- By 2040
- 375,444 · -1.2%
- By 2050
- 369,311 · -2.8%
- By 2075
- 354,233 · -6.7%
- By 2100
- 318,150 · -16.2%
Race, ethnicity, and origin ACS 2023
- Neighborhood character
- Diverse neighborhood (Simpson 0.59)
- Race & ethnicity
- White 57% Hispanic / Latino 24% Two or more races 18% Black 16% Asian 2%
- Hispanic origin (detail)
- Puerto Rican 13% Dominican 5%
- Common ancestry
- Romanian 5% Iranian 3% Italian 1%
- Foreign-born
- 16% · Canada, Jamaica
- Languages at home
- 78% English-only · Spanish 15% French/Haitian/Cajun 3% Other Indo-European 2%
Political lean MEDSL · Orange
- 2024 margin
- Lean R (+8.4) · D 45.8% · R 54.2%
- 2008→2024 swing
- -12.5pp toward R · 2008: 4.1pp · 2024: -8.4pp
- All cycles
- 2024: R+8.4 2020: R+0.2 2016: R+6.5 2012: D+5.2 2008: D+4.1
Not yet ingested
- Civics
- —
Market trends
- HPI YoY
- ▼ -20.16%
- Current HPI
- 302.6098
- Rent YoY
- —
- Metro
- —
- State GDP YoY
- ▲ 2.60%
- F500 in state
- 92
Industry mix (Fortune 500 HQ in NY)
| Industry | F500 HQs | Revenue |
|---|---|---|
| Financial Services | 10 | $950B |
|
||
| Consumer Goods | 9 | $162B |
|
||
| Insurance | 4 | $225B |
|
||
| Telecommunications | 2 | $144B |
|
||
| Pharmaceuticals | 2 | $112B |
|
||
| Media / Entertainment | 2 | $69B |
|
||
Price history
+150.0% since first listed17 events — show timeline
- 2026-05-15 Listed $225,000 OneKey® MLS as Distributed by MLS Grid
- 2024-12-12 Listed $299,900 OneKey® MLS as Distributed by MLS Grid
- 2013-12-18 Price Changed $189,300 HGMLS
- 2012-10-31 Delisted — HGMLS
- 2012-10-31 Listing Removed — OneKey® MLS as Distributed by MLS Grid
- 2012-04-24 Listed — HGMLS
- 2012-04-24 Listed $83,800 OneKey® MLS as Distributed by MLS Grid
- 2006-08-10 Sold (Public Records) $197,160 Public Records
- 2006-06-28 Sold (MLS) $197,160 HGMLS
- 2006-06-02 Delisted — HGMLS
- 2006-02-02 Listed $197,160 HGMLS
- 2002-11-27 Sold (Public Records) $114,500 Public Records
- 2002-11-25 Sold (MLS) $114,500 HGMLS
- 2002-10-07 Price Changed $120,000 HGMLS
- 2002-10-07 Delisted — HGMLS
- 2002-09-11 Listed $114,500 HGMLS
- 1989-09-28 Sold (Public Records) $90,000 Public Records
Property tax history
+3.7%/yrLatest (2025): $5,472 · +2.5% YoY. Source: county tax records.
Cash-flow waterfall
monthlySold comps — $/sqft
last 12 mo · ≤1 miLoading sold comps…