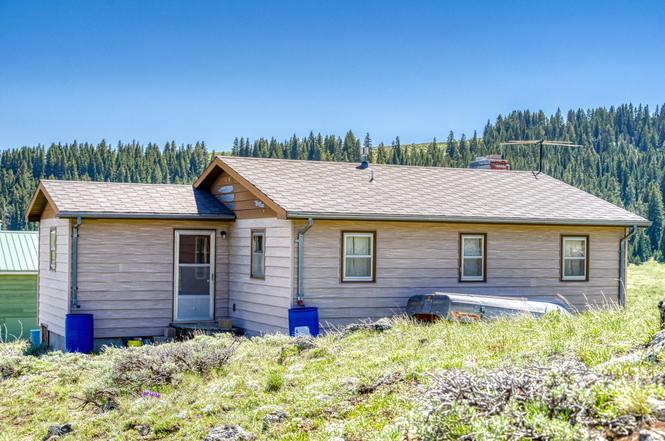
3 Circle Dr · Buffalo, WY
Flood risk 1/10 · Minimal
- FEMA flood zone
- —
- Chance of flooding over 30 yrs
- 0.0%
- Est. flood insurance / yr
- —
Fire risk 6/10 · Moderate
- Est. fire insurance / yr
- $564 – $1,046
Heat risk 1/10 · Minimal
- Hot days now (above 79°F)
- 7 days/yr
- Hot days in 30 yrs
- 19 days/yr
Wind risk 1/10 · Minimal
- Chance of severe wind over 30 yrs
- —
Air-quality risk 2/10 · Minimal
- Unhealthy air days now
- 0 days/yr
- Unhealthy air days in 30 yrs
- 1 days/yr
Risk factors via First Street. Map © Google.
Why this score? — see what drove the C- grade
The composite is a weighted blend of 9 inputs, each scored 0–100. Each bar is that input's sub-score; the figure is the points it added to the 100-point composite (weight × sub-score).
- Cash flow +20.0/30.0
- ARV discount +7.5/15.0
- DSCR +6.4/10.0
- Schools +5.0/10.0
- 1% rule +4.1/10.0
- Livability +3.4/5.0
- Rent growth +2.5/5.0
- Condition / age +2.5/5.0
- Appreciation +0.0/10.0
$100,000
🖨 Deal sheet 📄 Offer letter ✓ Due diligence
Key facts
- Breathtaking views
- Generator capability
- Serene surroundings
Tags
Neighborhood map
What this means for you Summary
Snapshot
- This is a 2-bed/1.0-bath single-family listed at $100k.
Deal economics
- At list price, monthly cash flow is $124 ($1k/yr) — positive.
- The deal already cash-flows at list — no discount required.
- To meet the 1% rule (rent ≥ 1% of price), the offer needs to be $91k (9.2% below list).
- Recommended offer: $91k (9.2% below list) — sets the bar for 1% rule.
- Cap rate 7.8% vs local median 1.8% in Buffalo — top-decile yield for the area; either an underpriced asset or a hidden risk that comps aren't pricing in. Stress-test before assuming the spread holds.
Location & tenants
- Location reads 68/100 on livability (#55 in WY) — a middle-class / working-renter tenant base. Strengths: crime A+, cost of living A+, housing B+; Watch: amenities F, commute F, health & safety F.
- Johnson County School District #1 (rural): math 59% / reading 59% proficiency, ranked #13 of 41 in WY (top 32%) — acceptable for families but not a draw, mixed tenant base, ~2y average lease.
- Market conditions: 194 active listings in the ZIP; 8 units permitted in Johnson County in 2024 (0 in 5+ unit buildings).
Forward outlook
- Local home prices are declining (-3.0%/yr); year-one equity from $691 of loan paydown is wiped out by about $3k of value loss. Plan a longer hold.
- Johnson County population projected to shrink 6% by 2050 — rents likely to lag national; underwrite the cash flow, not the appreciation.
Negotiation context
- It's been on market 58 days — a 3% lower offer ($97k) is reasonable based on typical stale-listing flexibility.
- 2 sale attempts; this cycle's ask has dropped $110k (52%) from the opening price — seller is motivated, your offer sets the floor, not the list.
Risks & watch-outs
- Climate carrying-cost: major wildfire risk — expect insurance premiums to compound above CPI over the hold.
Questions for the listing agent
- It's been on market 58 days. Have you received any prior offers? Is the seller open to a 9% concession, seller financing, or rate buy-down credit?
- Built in 1978 — when were the roof, HVAC, electrical panel, plumbing, and water heater last replaced?
- Is there a deadline driving the sale (1031 exchange, divorce, estate, relocation)? That informs how much negotiation room exists.
- Schools are B-rated — typically a magnet for longer-tenancy family renters. What's the average tenant stay here, and is there a school-zone premium baked into asking?
- What's the average days-on-market for RENTAL listings here right now (not sales)? A rising rental-DOM trend means longer vacancies and softer asking-rent achievability than the comps imply.
- What's the recent tenant-quality profile in this submarket — average credit score on applications, eviction rate, late-payment / NSF rate, and stable-employment percentage? A property-management company in the area should have these aggregated.
- How much new for-sale + rental construction is in the pipeline within 1–3 miles? Heavy new supply typically softens prices + rents 12–24 months out; constrained supply supports both.
Investment metrics
- 1% rule
- 0.91% ✗
- Cap rate
- 7.78%
- Cash-on-cash
- 5.29%
- DSCR
- 1.24
- GRM
- 9.2
CMA / ARV
- ARV (on-the-fly)
- $230,112
- Comps found
- 1
Show comp detail 1 sale within ~0.75 mi
| Address | Dist | Beds/Ba | Sqft | Sold | Price | $/sf | Match |
|---|---|---|---|---|---|---|---|
| 9 Hummingbird Ln | 0.22mi | 2/1.0 | 816 (0%) | 7mo | $230,000 | $282 | 84 |
Match score weights: distance 35% · size 25% · config 20% · recency 20%. Top-matched comps best support the ARV.
Projected returns pro-forma
-3.0% appreciation · 3.0% rent growth · sell at horizon
- IRR
- -8.1%
- Equity multiple
- 0.70×
- Total profit
- $-8,382
- Equity at exit
- $14,910
- IRR
- 1.3%
- Equity multiple
- 1.09×
- Total profit
- $2,646
- Equity at exit
- $8,646
Cash invested: $28,000 (down + closing). Projections, not guarantees.
Landlord ↔ Tenant lean methodology
- Overall (STATE)
- 90 Strongly Landlord-Friendly
- State Wyoming
- 90 Strongly Landlord-Friendly · R+25
- County
- — inherits STATE
- City
- — inherits STATE
ZIP-level market 82834
- Active inventory
- 194
- Price-to-rent
- 9.2×
Monthly cashflow live
- Estimated rent
- $908 medium interval (Pro) →
- Mortgage (P&I)
- −$524
- Tax from tax record
- −$28 /mo · $334/yr
- Insurance
- −$42
- HOA
- −$0
- Vacancy / Maint / Mgmt
- −$191
- Net cashflow
- $124
Break-even live
UW: 25.0% down · 7.5% · 30yr · 1.5% tax · 5.0% vac · 8.0% maint · 8.0% mgmt
Financing live
Cash to close
- Down payment
- $25,000
- Closing costs
- $3,000
- Reserves months
- —
- Total cash needed
- —
Loan-product check · same deal, 3 products live
Conventional
25% down · 7.5% · 30yr
- Down + closing
- —
- Monthly P&I
- —
- Monthly cashflow
- —
- DSCR
- —
- Eligible?
- —
Personal DTI + credit; lowest rate.
DSCR
20% down · 8.5% · 30yr
- Down + closing
- —
- Monthly P&I
- —
- Monthly cashflow
- —
- DSCR
- —
- Eligible?
- —
No personal income docs; deal must DSCR.
Hard money
10% down · 12.0% · 12mo
- Down + closing
- —
- Monthly P&I
- —
- Monthly cashflow
- —
- DSCR
- —
- Eligible?
- —
Short-term bridge; refi at stabilization.
Listing history 11 events
-
2025-08-08status Pending
-
2025-08-02price $100,000
-
2025-08-02price $100,000
-
2025-07-19price $140,000
-
2025-07-19price $140,000
-
2025-07-18price $160,000
-
2025-07-18price $160,000
-
2025-06-30price $180,000
-
2025-06-30price $180,000
-
2025-06-11$210,000 Active
-
2025-05-28$210,000 Active
ⓘ Source: listings_history table (triggers on properties + properties_extension) + one-shot
backfill from property_details.listing_events for pre-trigger history.
Tax reassessment forecast WY · Resets to sale price
- Current annual tax
- $334 · $28/mo
- Projected year-2 tax
- $610 · $51/mo
- Expected delta
- +$276/yr (+$23/mo · 82.5%)
ⓘ Screening estimate from a state-policy table — verify with the county assessor before closing.
Climate risk First Street
- Flood 1/10 Low 0% chance over 30 yrs
- Wildfire 6/10 Major
- Heat 1/10 Low 7 d/yr ≥79°F today · 19 d/yr by 30 yrs out
- Wind 1/10 Low
- Air quality 2/10 Low 0 unhealthy d/yr today · 1 by 30 yrs out
Nearby sold comps map
Loading sold comps map…
Walkable amenities ~0.75 mi
Loading nearby amenities…
Taxation est. · year 1
- Rental income
- $10,898
- − Mortgage interest
- −$5,602
- − Property taxes
- −$334
- − Insurance
- −$500
- − Repairs & maintenance
- −$872
- − Management
- −$872
- − Depreciation
- −$2,909
- Taxable loss
- −$190
- Est. tax savings @ 24.0%
- +$46
- After-tax cash flow
- $1,528/yr
For passive investors: Depreciation is non-cash, so a rental often shows a tax loss while cash-flowing — sheltering income. Rental losses are passive: they offset passive income freely, and up to $25,000/yr can offset ordinary (W-2) income if you actively participate and your MAGI is under $100k (phasing out to $0 by $150k); unused losses carry forward. On sale, claimed depreciation is recaptured at up to 25%, and gains may owe capital-gains tax (a 1031 exchange can defer both). Figures are a year-1 estimate at your 24.0% rate — not tax advice; consult a CPA.
Schools (NCES district)
- District
- Johnson County School District #1
- NCES district ID
- 5603770
- Math proficiency
- 59% ▼ -1.00%
- Reading proficiency
- 59% ▲ 1.00%
- Median HH income
- $52,198
- Composite
- 50.47/100
- National rank
- #1857
- State rank
- #13 of 41 in WY
Livability — Buffalo
- Score
- 68/100
- State rank
- #55
- US rank
- #9876
Category grades
Schools grade is shown separately in the Schools card above.
Census & demographics
- Population (ZIP)
- 7,699
Population outlook (Johnson County) Hauer SSP2
- Today (2025)
- 8,502 people
- By 2030
- 8,345 · -1.8%
- By 2040
- 8,092 · -4.8%
- By 2050
- 8,025 · -5.6%
- By 2075
- 8,463 · -0.5%
- By 2100
- 8,935 · +5.1%
Race, ethnicity, and origin ACS 2023
- Neighborhood character
- Predominantly White (90%)
- Race & ethnicity
- White 90% Two or more races 4% Hispanic / Latino 4% Native American 2%
- Common ancestry
- Portuguese 3% Slovak 2% Lithuanian 2%
- Foreign-born
- 1% · Canada
- Languages at home
- 97% English-only · Spanish 2% German/W. Germanic 1%
Political lean MEDSL · Johnson
- 2024 margin
- Solid R (+63.7) · D 17.5% · R 81.1% · Other 1.4%
- 2008→2024 swing
- -8.0pp toward R · 2008: -55.7pp · 2024: -63.7pp
- All cycles
- 2024: R+63.7 2020: R+60.7 2016: R+65.3 2012: R+62.0 2008: R+55.7
Not yet ingested
- Civics
- —
Market trends
- HPI YoY
- ▼ -169.55%
- Current HPI
- 202.1728
- Rent YoY
- —
- Metro
- —
- State GDP YoY
- —
- F500 in state
- 0
Price history
-52.4% since first listed11 events — show timeline
- 2025-08-08 Pending — SBORWY
- 2025-08-02 Price Changed $100,000 NEWRA
- 2025-08-02 Price Changed $100,000 SBORWY
- 2025-07-19 Price Changed $140,000 NEWRA
- 2025-07-19 Price Changed $140,000 SBORWY
- 2025-07-18 Price Changed $160,000 NEWRA
- 2025-07-18 Price Changed $160,000 SBORWY
- 2025-06-30 Price Changed $180,000 SBORWY
- 2025-06-30 Price Changed $180,000 NEWRA
- 2025-06-11 Listed $210,000 SBORWY
- 2025-05-28 Listed $210,000 NEWRA
Property tax history
+2.5%/yrLatest (2025): $334 · -22.6% YoY. Source: county tax records.
Cash-flow waterfall
monthlySold comps — $/sqft
last 12 mo · ≤1 miLoading sold comps…