 🔨 Auction
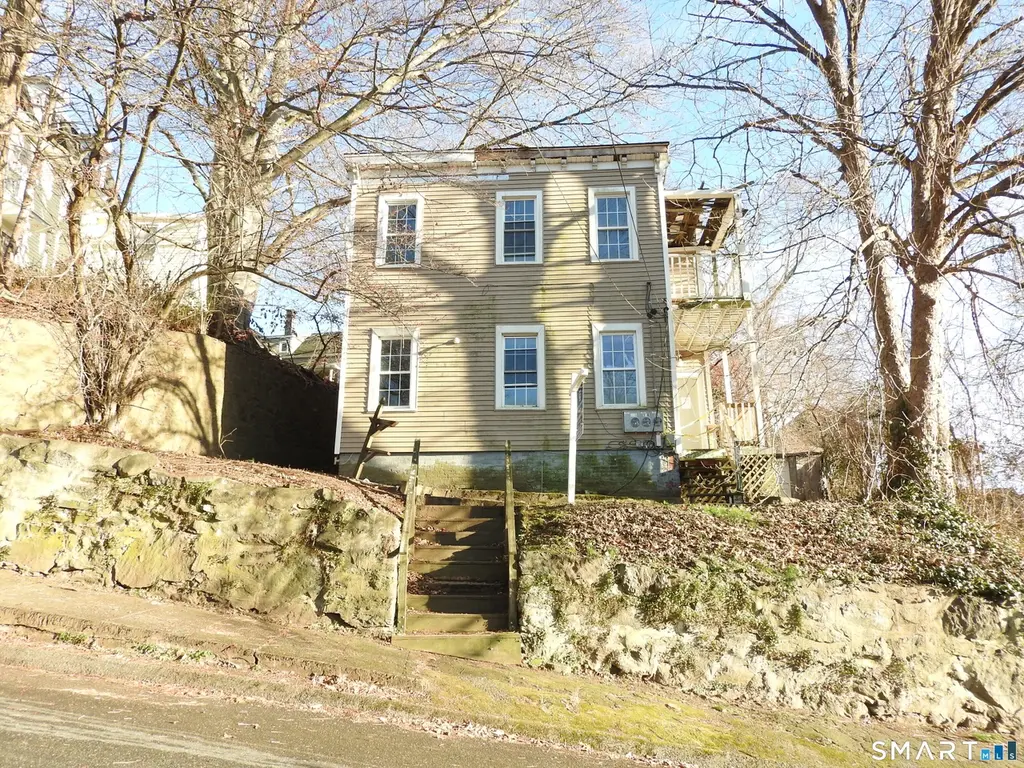
11 Division St · Norwich, CT
Flood risk 1/10 · Minimal
- FEMA flood zone
- X (unshaded)
- Chance of flooding over 30 yrs
- 0.0%
- Est. flood insurance / yr
- $473 – $860
Fire risk 2/10 · Minimal
- Est. fire insurance / yr
- $829 – $1,539
Heat risk 5/10 · Moderate
- Hot days now (above 97°F)
- 7 days/yr
- Hot days in 30 yrs
- 17 days/yr
Wind risk 6/10 · Moderate
- Chance of severe wind over 30 yrs
- 64.0%
Air-quality risk 3/10 · Minor
- Unhealthy air days now
- 2 days/yr
- Unhealthy air days in 30 yrs
- 3 days/yr
Risk factors via First Street. Map © Google.
Why this score? — see what drove the C+ grade
The composite is a weighted blend of 9 inputs, each scored 0–100. Each bar is that input's sub-score; the figure is the points it added to the 100-point composite (weight × sub-score).
- Cash flow +25.5/30.0
- DSCR +8.4/10.0
- ARV discount +7.5/15.0
- 1% rule +6.7/10.0
- Rent growth +4.2/5.0
- Livability +4.0/5.0
- Condition / age +2.5/5.0
- Schools +2.1/10.0
- Appreciation +0.0/10.0
$54,300
🖨 Deal sheet (PDF) 📄 Offer letter ✓ Due diligence
Multi-family units
County records classify this as Multi-Family (2-4 Unit). Listing-text estimate: 2 units. confirmed
Listing remarks MLS
Investor Alert! Property is in Auction Status - Discover the potential at 11 Division Street in Norwich-a classic two-family home offering a total of 2,130 sq ft of living space. Each spacious unit features 4 rooms, including 2 bedrooms and 1 full bath, spread across 1,065 sq ft per floor. This property is a full renovation project, ideal for contractors or buyers looking to customize and create value. With a convenient location close to downtown amenities, schools, and transportation, this is a prime opportunity to transform a diamond in the rough into a profitable investment or multi-generational home. Bring your vision and tools-Condemned by City of Norwich - No entry - Sold As Is. Find the property information on the auction site at: https://www.hubzu.com/bank-owned-home/94517601745-11-DIVISION-STREET-Norwich-CT-06360
Key facts
- Two-family home
- Convenient location
- 7,405 sq ft lot
Tags
Neighborhood map
What this means for you Summary
Snapshot
- This is a 2 × 2-bed/1.0-bath units multifamily listed at $54k.
Deal economics
- At list price, monthly cash flow is $664 ($8k/yr) — positive. Per door: $332/mo.
- The deal already cash-flows at list — no discount required.
- Meets the 1% rule at list price ($3k rent vs $54k).
- Recommended offer: $49k (9.0% below list) — sets the bar for market timing.
- Cap rate 9.1% vs local median 4.1% in Norwich — top-decile yield for the area; either an underpriced asset or a hidden risk that comps aren't pricing in. Stress-test before assuming the spread holds.
Location & tenants
- Location reads 81/100 on livability (#18 in CT, #1,391 nationally) — a professional / high-income tenant draw. Strengths: housing A+, health & safety A+, commute A-.
- Norwich School District (urban): math 19% / reading 29% proficiency, ranked #139 of 153 in CT (top 91%) — low school quality limits family demand, transient renter base, plan for 1-2y turnover; 62% free/reduced lunch — lower-income household profile, screen leases tightly.
- Zoned schools: Moriarty Magnet School (math 26% / reading 31%, grade F, #396 of 553 statewide, top 72%, 368 students, 62% FRL); Kelly Steam Magnet Middle School (math 15% / reading 32%, grade F, #156 of 175 statewide, top 90%, 556 students, 72% FRL).
- Market conditions: Rents rising fast (+6.6%/yr); 243 active listings in the ZIP; 4 comparable units currently listed for rent nearby; rentals lingering (median 45d on market — plan ~5-8 weeks vacancy on turnover, expect pricing pressure); 50% of comp listings sitting > 30 days — soft ceiling on asking rent; 487 units permitted in Southeastern Connecticut Planning Region in 2024 (244 in 5+ unit buildings).
- At $3,337/mo this rent would consume 61% of the median local household income ($66k/yr) (locally 1643% of renters already pay >50% of income on rent) — very limited rent-growth headroom before tenants either downsize or default.
Forward outlook
- Local home prices are declining (-3.0%/yr); year-one equity from $2k of loan paydown is wiped out by about $9k of value loss. Plan a longer hold.
- At projected returns (-3.0% appreciation + 6.6% rent growth), your $80k cash investment doubles in ~8 years — after that, you're playing with house money.
Negotiation context
- It's been on market 102 days — a 9% lower offer ($49k) is reasonable based on typical stale-listing flexibility.
- 4 sale attempts since 20y ago; this cycle's ask has dropped $30k (36%) from the opening price — seller is motivated, your offer sets the floor, not the list.
Risks & watch-outs
- Watch-outs: property tax is 7.9% of price; built in 1870 — expect roof / HVAC / electrical / plumbing capex.
- Climate carrying-cost: major wind risk, 64% chance of damaging wind over 30y; extreme-heat days projected 7→17/yr by 2055 (HVAC capex compounding) — expect insurance premiums to compound above CPI over the hold.
Questions for the listing agent
- It's been on market 102 days. Have you received any prior offers? Is the seller open to a 9% concession, seller financing, or rate buy-down credit?
- Can we see the unit-by-unit rent roll, current vacancy, and any below-market leases? What's the average tenancy length?
- What capital expenditures (roof, boiler, parking lot, exteriors) have been made in the last 5 years, and what's planned in the next 2?
- Built in 1870 — when were the roof, HVAC, electrical panel, plumbing, and water heater last replaced?
- Property tax is high relative to price — has the assessment been appealed recently, and will the sale trigger a re-assessment?
- Why hasn't it sold? Are there any deal-killer items the seller is aware of (foundation, flood, title, zoning, code violations)?
- Is there a deadline driving the sale (1031 exchange, divorce, estate, relocation)? That informs how much negotiation room exists.
- Schools are D-rated, which usually means shorter tenancies and higher turnover. Who's the typical renter profile here, and what's been the actual vacancy rate?
- What's the average days-on-market for RENTAL listings here right now (not sales)? A rising rental-DOM trend means longer vacancies and softer asking-rent achievability than the comps imply.
- What's the recent tenant-quality profile in this submarket — average credit score on applications, eviction rate, late-payment / NSF rate, and stable-employment percentage? A property-management company in the area should have these aggregated.
- How much new apartment / multifamily construction is in the pipeline within 1–3 miles? Heavy new supply (>2% of stock underway) typically softens rents 12–24 months out; light construction supports rent growth.
Investment metrics
- 1% rule
- 1.17% ✓
- Cap rate
- 9.08%
- Cash-on-cash
- 9.97%
- DSCR
- 1.44
- GRM
- 7.1
CMA / ARV
- ARV (median comp)
- $285,391
- List price
- $54,300
- Delta
- -80.97%
- Verdict
- UNDERPRICED
- Comps
- 20 within 1.0 mi
Show comp detail 12 sales within ~0.75 mi
| Address | Dist | Beds/Ba | Sqft | Sold | Price | $/sf | Match |
|---|---|---|---|---|---|---|---|
| 36 Boswell Ave | 0.11mi | 4/2.0 | 2,180 (+2%) | 7mo | $155,000 | $71 | 85 |
| 16 Oak St | 0.04mi | 4/2.0 | 1,980 (-7%) | 7mo | $303,000 | $153 | 80 |
| 57 Division St | 0.10mi | 5/2.0 (+1) | 2,134 (+0%) | 15mo | $280,000 | $131 | 78 |
| 490 E Main St | 0.49mi | 4/2.0 | 2,145 (+1%) | 6mo | $57,000 | $27 | 71 |
| 49 Union St | 0.25mi | 4/2.0 | 1,932 (-9%) | 7mo | $170,000 | $88 | 67 |
| 38 Summer St | 0.45mi | 5/3.0 (+1) | 2,137 (+0%) | 8mo | $105,000 | $49 | 63 |
| 57 Boswell Ave | 0.13mi | 5/2.0 (+1) | 1,841 (-14%) | 8mo | $335,000 | $182 | 60 |
| 43 Union St | 0.25mi | 5/4.0 (+1) | 2,238 (+5%) | 9mo | $365,000 | $163 | 59 |
| 125 McKinley Ave | 0.49mi | 5/3.0 (+1) | 2,224 (+4%) | 11mo | $299,000 | $134 | 52 |
| 17 Winchester St | 0.55mi | 4/2.0 | 2,057 (-3%) | 20mo | $260,000 | $126 | 52 |
| 31 Happy St | 0.44mi | 5/2.0 (+1) | 2,340 (+10%) | 11mo | $275,000 | $118 | 49 |
| 116 Laurel Hill Ave | 0.60mi | 4/4.0 | 2,317 (+9%) | 17mo | $300,000 | $129 | 35 |
Match score weights: distance 35% · size 25% · config 20% · recency 20%. Top-matched comps best support the ARV.
Projected returns pro-forma
-3.0% appreciation · 6.62% rent growth · sell at horizon
- IRR
- 2.7%
- Equity multiple
- 1.11×
- Total profit
- $8,688
- Equity at exit
- $42,553
- IRR
- 15.5%
- Equity multiple
- 2.48×
- Total profit
- $117,910
- Equity at exit
- $24,675
Cash invested: $79,910 (down + closing). Projections, not guarantees.
Landlord ↔ Tenant lean methodology
- Overall (STATE)
- 27 Tenant-Leaning
- State Connecticut
- 27 Tenant-Leaning · D+7
- County
- — inherits STATE
- City
- — inherits STATE
ZIP-level market 06360
- Home prices YoY
- -19.9%
- Rents YoY
- 6.6%
- Active inventory
- 243
- Price-to-rent
- 2.7×
Monthly cashflow live
- Estimated rent
- $3,337 high interval (Pro) →
- Mortgage (P&I)
- −$1,497
- Tax est. 1.5%
- −$357 /mo · $4,281/yr
- Insurance
- −$119
- HOA
- −$0
- Vacancy / Maint / Mgmt
- −$701
- Net cashflow
- $664
Break-even live
Sensitivity live
| Price | -10% $861 | -5% $763 | +0% $664 | +5% $565 | +10% $467 |
|---|---|---|---|---|---|
| Rent | -10% $400 | -5% $532 | +0% $664 | +5% $796 | +10% $928 |
| Rate | -1.0pp $808 | -0.5pp $737 | base $664 | +0.5pp $590 | +1.0pp $515 |
2-unit breakdown (identical units grouped — click to expand)
| Units | Beds | Baths | Est. rent |
|---|---|---|---|
| 2× units | 2 | 1 | $3,336 |
| #1 | 2 | 1 | $1,668 |
| #2 | 2 | 1 | $1,668 |
| Total (2 units) | $3,337 | ||
UW: 25.0% down · 7.5% · 30yr · 1.5% tax · 5.0% vac · 8.0% maint · 8.0% mgmt
Financing live
Cash to close
- Down payment
- $71,348
- Closing costs
- $8,562
- Reserves months
- —
- Total cash needed
- —
Loan-product check · same deal, 3 products live
Conventional
25% down · 7.5% · 30yr
- Down + closing
- —
- Monthly P&I
- —
- Monthly cashflow
- —
- DSCR
- —
- Eligible?
- —
Personal DTI + credit; lowest rate.
DSCR
20% down · 8.5% · 30yr
- Down + closing
- —
- Monthly P&I
- —
- Monthly cashflow
- —
- DSCR
- —
- Eligible?
- —
No personal income docs; deal must DSCR.
Hard money
10% down · 12.0% · 12mo
- Down + closing
- —
- Monthly P&I
- —
- Monthly cashflow
- —
- DSCR
- —
- Eligible?
- —
Short-term bridge; refi at stabilization.
Rent comps 4 comps
| Address | Beds | Baths | Sqft | Rent | $/sqft | DOM | Units | Dist |
|---|---|---|---|---|---|---|---|---|
| 51-53 Cliff St Norwich, CT | 4.0 | 1.0 | 1598 | $2,100 | $1.31 | 22d | 1 | 0.21mi |
| 10 Hillcrest St Unit B Norwich, CT | 3.0 | 3.0 | 1507 | $2,300 | $1.53 | 45d | 1 | 0.36mi |
| 130 Platt Ave Norwich, CT | 3.0 | 1.0 | 2010 | $1,800 | $0.90 | 45d | 1 | 0.52mi |
| 229 Boswell Ave Unit 6 Norwich, CT | 3.0 | 2.5 | 1547 | $2,350 | $1.52 | 14d | 1 | 0.54mi |
Listing history 29 events
-
2026-06-21days on market $54,300 Active 102 DOM
-
2026-06-19days on market $54,300 Active 100 DOM
-
2026-06-18days on market $54,300 Active 99 DOM
-
2026-06-17days on market $54,300 Active 98 DOM
-
2026-06-16days on market $54,300 Active 97 DOM
-
2026-06-15days on market $54,300 Active 96 DOM
-
2026-06-14days on market $54,300 Active 94 DOM
-
2026-06-13days on market $54,300 Active 93 DOM
-
2026-06-10days on market $54,300 Active 91 DOM
-
2026-06-09days on market $54,300 Active 90 DOM
-
2026-06-08days on market $54,300 Active 89 DOM
-
2026-06-07days on market $54,300 Active 88 DOM
-
2026-06-02days on market $54,300 Active 83 DOM
-
2026-06-01days on market $54,300 Active 82 DOM
-
2026-05-31days on market $54,300 Active 81 DOM
-
2026-05-30days on market $54,300 Active 80 DOM
-
2026-05-05price $54,300 833-char remark
Show marketing remark (833 chars)
Investor Alert! Property is in Auction Status - Discover the potential at 11 Division Street in Norwich-a classic two-family home offering a total of 2,130 sq ft of living space. Each spacious unit features 4 rooms, including 2 bedrooms and 1 full bath, spread across 1,065 sq ft per floor. This property is a full renovation project, ideal for contractors or buyers looking to customize and create value. With a convenient location close to downtown amenities, schools, and transportation, this is a prime opportunity to transform a diamond in the rough into a profitable investment or multi-generational home. Bring your vision and tools-Condemned by City of Norwich - No entry - Sold As Is. Find the property information on the auction site at: https://www.hubzu.com/bank-owned-home/94517601745-11-DIVISION-STREET-Norwich-CT-06360
-
2026-03-19price $59,000 833-char remark
Show marketing remark (833 chars)
Investor Alert! Property is in Auction Status - Discover the potential at 11 Division Street in Norwich-a classic two-family home offering a total of 2,130 sq ft of living space. Each spacious unit features 4 rooms, including 2 bedrooms and 1 full bath, spread across 1,065 sq ft per floor. This property is a full renovation project, ideal for contractors or buyers looking to customize and create value. With a convenient location close to downtown amenities, schools, and transportation, this is a prime opportunity to transform a diamond in the rough into a profitable investment or multi-generational home. Bring your vision and tools-Condemned by City of Norwich - No entry - Sold As Is. Find the property information on the auction site at: https://www.hubzu.com/bank-owned-home/94517601745-11-DIVISION-STREET-Norwich-CT-06360
-
2026-03-11$84,500 Active 833-char remark
Show marketing remark (833 chars)
Investor Alert! Property is in Auction Status - Discover the potential at 11 Division Street in Norwich-a classic two-family home offering a total of 2,130 sq ft of living space. Each spacious unit features 4 rooms, including 2 bedrooms and 1 full bath, spread across 1,065 sq ft per floor. This property is a full renovation project, ideal for contractors or buyers looking to customize and create value. With a convenient location close to downtown amenities, schools, and transportation, this is a prime opportunity to transform a diamond in the rough into a profitable investment or multi-generational home. Bring your vision and tools-Condemned by City of Norwich - No entry - Sold As Is. Find the property information on the auction site at: https://www.hubzu.com/bank-owned-home/94517601745-11-DIVISION-STREET-Norwich-CT-06360
-
2026-02-28historical
-
2026-02-03status Active
-
2025-12-16status Under Contract
-
2025-11-19price $84,500
-
2025-10-22price $94,500
-
2025-09-21$105,000 Active
-
2006-12-28soldstatus $242,000
-
2006-10-02$234,900
-
1994-02-07soldstatus $47,500
-
1988-03-11soldstatus $130,000
ⓘ Source: listings_history table (triggers on properties + properties_extension) + one-shot
backfill from property_details.listing_events for pre-trigger history.
Climate risk First Street
- Flood 1/10 Low FEMA zone X (unshaded) · 0% chance over 30 yrs
- Wildfire 2/10 Low
- Heat 5/10 Major 7 d/yr ≥97°F today · 17 d/yr by 30 yrs out
- Wind 6/10 Major 64% chance of damaging wind over 30 yrs
- Air quality 3/10 Moderate 2 unhealthy d/yr today · 3 by 30 yrs out
Nearby sold comps map
Loading sold comps map…
Walkable amenities ~0.75 mi
Loading nearby amenities…
Taxation est. · year 1
- Rental income
- $40,044
- − Mortgage interest
- −$15,986
- − Property taxes
- −$4,281
- − Insurance
- −$1,427
- − Repairs & maintenance
- −$3,204
- − Management
- −$3,204
- − Depreciation
- −$8,302
- Taxable income
- $3,640
- Est. tax owed @ 24.0%
- −$874
- After-tax cash flow
- $7,094/yr
For passive investors: Depreciation is non-cash, so a rental often shows a tax loss while cash-flowing — sheltering income. Rental losses are passive: they offset passive income freely, and up to $25,000/yr can offset ordinary (W-2) income if you actively participate and your MAGI is under $100k (phasing out to $0 by $150k); unused losses carry forward. On sale, claimed depreciation is recaptured at up to 25%, and gains may owe capital-gains tax (a 1031 exchange can defer both). Figures are a year-1 estimate at your 24.0% rate — not tax advice; consult a CPA.
Schools (NCES district)
- District
- Norwich School District
- NCES district ID
- 0903120
- Math proficiency
- 19% ▼ -8.00%
- Reading proficiency
- 29% ▼ -7.00%
- Median HH income
- $50,813
- Composite
- 21.27/100
- National rank
- #8395
- State rank
- #139 of 153 in CT
Livability — Norwich
- Score
- 81/100
- State rank
- #18
- US rank
- #1391
Category grades
Schools grade is shown separately in the Schools card above.
Census & demographics
- Census place
- Norwich, CT
- County
- New London County · 147,197 people
- City population
- 37,216
- Metro
- Norwich-New London, CT
- Population (ZIP)
- 37,216
- Household income
- $65,539
- Rent vs Own
- Severe rent burden
- 1643.0
Population outlook (Southeastern Connecticut County) Hauer SSP2
- By 2040
- 293,442
Race, ethnicity, and origin ACS 2023
- Neighborhood character
- Diverse neighborhood (Simpson 0.63)
- Race & ethnicity
- White 56% Hispanic / Latino 21% Two or more races 12% Black 10% Asian 7%
- Hispanic origin (detail)
- Mexican 3% Puerto Rican 9% Cuban 1% Dominican 3%
- Common ancestry
- Lithuanian 8% Romanian 5% Hispanic 4%
- Foreign-born
- 15% · Canada, China
- Languages at home
- 77% English-only · Spanish 11% French/Haitian/Cajun 4% Chinese 3%
Political lean MEDSL · Southeastern Connecticut
- 2024 margin
- D (+13.0) · D 55.6% · R 42.6% · Other 1.8%
- All cycles
- 2024: D+13.0
Not yet ingested
- Civics
- —
Market trends
- HPI YoY
- ▼ -65.27%
- Current HPI
- 261.8575
- Rent YoY
- ▲ 6.62%
- Metro
- Norwich-New London, CT
- State GDP YoY
- ▲ 1.06%
- F500 in state
- 38
Industry mix (Fortune 500 HQ in CT)
| Industry | F500 HQs | Revenue |
|---|---|---|
| Industrial Machinery | 4 | $38B |
|
||
| Insurance | 3 | $71B |
|
||
| Financial Services | 2 | $25B |
|
||
| Transportation / Logistics | 2 | $18B |
|
||
| Healthcare | 1 | $247B |
|
||
| Telecommunications | 1 | $55B |
|
||
Price history
-58.2% since first listed13 events — show timeline
- 2026-05-05 Price Changed $54,300 Smart MLS
- 2026-03-19 Price Changed $59,000 Smart MLS
- 2026-03-11 Listed $84,500 Smart MLS
- 2026-02-28 Listing Removed — Smart MLS
- 2026-02-03 Relisted — Smart MLS
- 2025-12-16 Pending — Smart MLS
- 2025-11-19 Price Changed $84,500 Smart MLS
- 2025-10-22 Price Changed $94,500 Smart MLS
- 2025-09-21 Listed $105,000 Smart MLS
- 2006-12-28 Sold (MLS) $242,000 Smart MLS
- 2006-10-02 Listed $234,900 Smart MLS
- 1994-02-07 Sold (Public Records) $47,500 Public Records
- 1988-03-11 Sold (Public Records) $130,000 Public Records
Property tax history
-1.4%/yrLatest (2023): $4,120 · +0.3% YoY. Source: county tax records.
Cash-flow waterfall
monthlySold comps — $/sqft
last 12 mo · ≤1 miLoading sold comps…