 Duplex
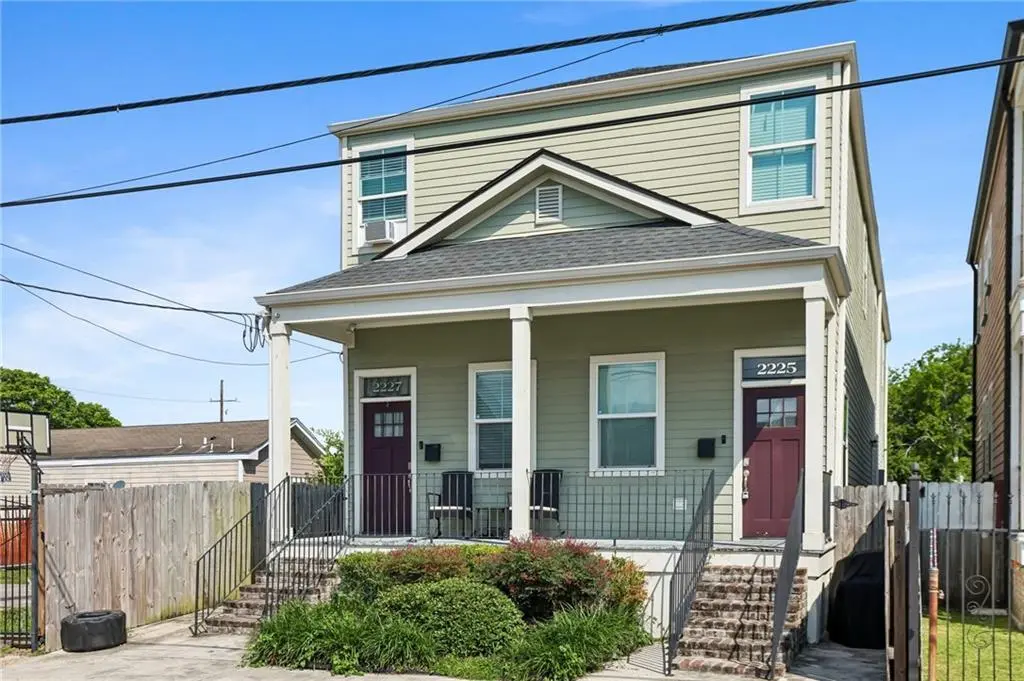
2225-27 Rev John Raphael Jr Way · New Orleans, LA
Flood risk 8/10 · Major
- FEMA flood zone
- X
- Chance of flooding over 30 yrs
- 0.6%
- Est. flood insurance / yr
- $507 – $1,088
Fire risk 1/10 · Minimal
- Est. fire insurance / yr
- $1,269 – $2,357
Heat risk 10/10 · Severe
- Hot days now (above 108°F)
- 7 days/yr
- Hot days in 30 yrs
- 20 days/yr
Wind risk 10/10 · Severe
- Chance of severe wind over 30 yrs
- 99.0%
Air-quality risk 3/10 · Minor
- Unhealthy air days now
- 3 days/yr
- Unhealthy air days in 30 yrs
- 4 days/yr
Risk factors via First Street. Map © Google.
Why this score? — see what drove the D grade
The composite is a weighted blend of 9 inputs, each scored 0–100. Each bar is that input's sub-score; the figure is the points it added to the 100-point composite (weight × sub-score).
- Appreciation +10.0/10.0
- Cash flow +7.5/30.0
- ARV discount +7.5/15.0
- Rent growth +4.0/5.0
- Livability +4.0/5.0
- Condition / age +2.5/5.0
- 1% rule +1.9/10.0
- DSCR +1.7/10.0
- Schools +1.6/10.0
$475,000
🖨 Deal sheet (PDF) 📄 Offer letter ✓ Due diligence
Multi-family units
County records classify this as Multi-Family (2-4 Unit). Listing-text estimate: 2 units. confirmed
Listing remarks MLS
Located in the heart of the vibrant Central City area, this masterfully designed duplex, built in 2019, offers a rare combination of modern luxury and New Orleans charm. Each of the expansive units features a thoughtful layout with three spacious bedrooms, three full bathrooms, and an additional half bath, providing ample privacy and comfort for residents or guests alike. The interiors boast contemporary finishes, walk-in closets, and fully equipped kitchens with stainless steel appliances, while the exterior highlights include a classic front porch and a private backyard perfect for outdoor entertaining. Situated just minutes from the St. Charles Avenue streetcar line, the Garden District, and the bustling corridors of the CBD, this property represents an exceptional opportunity for an owner-occupant or an investor looking for a high-performing asset in a central location. Total rents are currently $4400/mo (with room to increase), tenants pay all utilities and each unit it separately metered.
Key facts
- Walk-in closets
- Thoughtful layout
- Classic front porch
Tags
Property features AI
Finance
- Financial info: Two total units (income property)
Exterior
- Utilities: Public water; Public sewer; Tenant pays electricity, gas, and water
- Home design: Two-story building; Raised foundation; Excellent condition
- Construction: Hardboard exterior; Shingle roof; Built with raised foundation
- Exterior features: Fenced yard; Front porch
Interior
- Kitchen: Standard kitchen features (specific appliances not listed)
- Bedrooms: Total of multiple bedrooms across units (see individual unit listing for room-level details)
- Bathrooms: Six full bathrooms; Two half bathrooms
- Heating & cooling: Central heating; Central air conditioning
- Interior features: Two-unit property (duplex); In-unit laundry; Windows upgraded for energy efficiency
- Laundry & utility: Washer and/or dryer in unit
Neighborhood map
What this means for you Summary
Snapshot
- This is a 2 × 3-bed/3.0-bath units multifamily listed at $475k.
Deal economics
- At list price, monthly cash flow is $-650 ($-8k/yr) — negative. Per door: $-325/mo.
- To cash-flow at today's rent, offer at most $360k (24.2% below list).
- To meet the 1% rule (rent ≥ 1% of price), the offer needs to be $327k (31.2% below list).
- Recommended offer: $327k (31.2% below list) — sets the bar for 1% rule.
Location & tenants
- Location reads 81/100 on livability (#3 in LA, #1,383 nationally) — a professional / high-income tenant draw. Strengths: amenities A+, commute A+, health & safety A+; Watch: crime C-, employment D.
- Orleans Parish (urban): math 11% / reading 27% proficiency, ranked #69 of 98 in LA (top 70%) — low school quality limits family demand, transient renter base, plan for 1-2y turnover; 68% free/reduced lunch — lower-income household profile, screen leases tightly.
- Zoned schools: Benjamin Franklin Elem. Math And Science (math 12% / reading 23%, grade F, #479 of 646 statewide, top 75%, 747 students, 98% FRL, charter) — zoned schools average 98% FRL vs 68% district-wide (30 pts higher); higher-poverty schools than district average — tighter screening recommended.
- Market conditions: Rents rising fast (+6.0%/yr); 134 active listings in the ZIP; 40 comparable units currently listed for rent nearby; rentals at typical pace (median 26d on market — plan ~3-4 weeks tenant-placement turnaround); lower-income renter base — watch delinquency; 710 units permitted in Orleans Parish in 2024 (244 in 5+ unit buildings).
- At $3,270/mo this rent would consume 100% of the median local household income ($39k/yr) (locally 714% of renters already pay >50% of income on rent) — very limited rent-growth headroom before tenants either downsize or default.
Forward outlook
- In year one you build about $51k of equity ($3k loan paydown + $48k appreciation (10.0% local appreciation)).
- Orleans County population projected at +61% by 2050 — long-run rental-demand tailwind backs the buy-and-hold thesis.
- By year 2, paydown + projected appreciation supports a ~$82k cash-out refi (75% LTV) — recoverable capital for the next deal without selling this one.
Negotiation context
- It's been on market 33 days — a 3% lower offer ($461k) is reasonable based on typical stale-listing flexibility.
- 8 sale attempts since 9y ago; this cycle's ask has dropped $25k (5%) from the opening price — seller is motivated, your offer sets the floor, not the list.
- Current owner paid $76k; list at $475k implies a 521% gain — meaningful room to come down on a strong offer.
Risks & watch-outs
- Watch-outs: flood insurance adds $66/mo.
- Climate carrying-cost: severe flood risk; severe wind risk, 99% chance of damaging wind over 30y; extreme-heat days projected 7→20/yr by 2055 (HVAC capex compounding) — expect insurance premiums to compound above CPI over the hold.
Questions for the listing agent
- What do current leases actually rent for vs. the listed asking? Can we see a recent rent roll and the last 12 months of T-12 income?
- It's been on market 33 days. Have you received any prior offers? Is the seller open to a 31% concession, seller financing, or rate buy-down credit?
- Can we see the unit-by-unit rent roll, current vacancy, and any below-market leases? What's the average tenancy length?
- What capital expenditures (roof, boiler, parking lot, exteriors) have been made in the last 5 years, and what's planned in the next 2?
- What's the actual annual flood-insurance premium (NFIP or private), and is the property in a SFHA with mandatory coverage?
- Is there a deadline driving the sale (1031 exchange, divorce, estate, relocation)? That informs how much negotiation room exists.
- The area grade is low — what's the realistic commute time and amenity access for the typical tenant pool here? Any planned neighborhood developments (good or bad) we should know about?
- What's the average days-on-market for RENTAL listings here right now (not sales)? A rising rental-DOM trend means longer vacancies and softer asking-rent achievability than the comps imply.
- What's the recent tenant-quality profile in this submarket — average credit score on applications, eviction rate, late-payment / NSF rate, and stable-employment percentage? A property-management company in the area should have these aggregated.
- How much new apartment / multifamily construction is in the pipeline within 1–3 miles? Heavy new supply (>2% of stock underway) typically softens rents 12–24 months out; light construction supports rent growth.
Investment metrics
- 1% rule
- 0.69% ✗
- Cap rate
- 4.82%
- Cash-on-cash
- -5.27%
- DSCR
- 0.77
- GRM
- 12.1
CMA / ARV
- ARV (on-the-fly)
- $147,744
- Comps found
- 4
Show comp detail 4 sales within ~0.75 mi
| Address | Dist | Beds/Ba | Sqft | Sold | Price | $/sf | Match |
|---|---|---|---|---|---|---|---|
| 2620-22 Philip St | 0.15mi | 4/2.0 | 1,472 (+8%) | 8mo | $159,000 | $108 | 73 |
| 2114 16 Josephine St | 0.21mi | 4/2.0 | 1,407 (+3%) | 16mo | $299,000 | $213 | 72 |
| 2223 25 Felicity St | 0.21mi | 4/2.0 | 1,465 (+7%) | 10mo | $155,000 | $106 | 70 |
| 2809 11 Third St | 0.31mi | 4/2.0 | 1,404 (+3%) | 23mo | $80,000 | $57 | 62 |
Match score weights: distance 35% · size 25% · config 20% · recency 20%. Top-matched comps best support the ARV.
Projected returns pro-forma
10.0% appreciation · 5.98% rent growth · sell at horizon
- IRR
- 20.9%
- Equity multiple
- 2.71×
- Total profit
- $227,396
- Equity at exit
- $427,918
- IRR
- 19.6%
- Equity multiple
- 6.45×
- Total profit
- $725,359
- Equity at exit
- $922,821
Cash invested: $133,000 (down + closing). Projections, not guarantees.
Landlord ↔ Tenant lean methodology
- Overall (STATE)
- 90 Strongly Landlord-Friendly
- State Louisiana
- 90 Strongly Landlord-Friendly · R+12
- County
- — inherits STATE
- City
- — inherits STATE
ZIP-level market 70113
- Rents YoY
- 6.0%
- Active inventory
- 134
- Price-to-rent
- 24.2×
Monthly cashflow live
- Estimated rent
- $3,270 high interval (Pro) →
- Mortgage (P&I)
- −$2,491
- Tax from tax record
- −$478 /mo · $5,739/yr
- Insurance
- −$198
- Flood insurance flood zone
- −$66 /mo · $798/yr
- HOA
- −$0
- Vacancy / Maint / Mgmt
- −$687
- Net cashflow
- $-650
Break-even live
Sensitivity live
| Price | -10% $-381 | -5% $-516 | +0% $-650 | +5% $-785 | +10% $-919 |
|---|---|---|---|---|---|
| Rent | -10% $-909 | -5% $-779 | +0% $-650 | +5% $-521 | +10% $-392 |
| Rate | -1.0pp $-411 | -0.5pp $-529 | base $-650 | +0.5pp $-773 | +1.0pp $-899 |
2-unit breakdown (identical units grouped — click to expand)
| Units | Beds | Baths | Est. rent |
|---|---|---|---|
| 2× units | 3 | 3 | $3,270 |
| #1 | 3 | 3 | $1,635 |
| #2 | 3 | 3 | $1,635 |
| Total (2 units) | $3,270 | ||
UW: 25.0% down · 7.5% · 30yr · 1.5% tax · 5.0% vac · 8.0% maint · 8.0% mgmt
Financing live
Cash to close
- Down payment
- $118,750
- Closing costs
- $14,250
- Reserves months
- —
- Total cash needed
- —
Loan-product check · same deal, 3 products live
Conventional
25% down · 7.5% · 30yr
- Down + closing
- —
- Monthly P&I
- —
- Monthly cashflow
- —
- DSCR
- —
- Eligible?
- —
Personal DTI + credit; lowest rate.
DSCR
20% down · 8.5% · 30yr
- Down + closing
- —
- Monthly P&I
- —
- Monthly cashflow
- —
- DSCR
- —
- Eligible?
- —
No personal income docs; deal must DSCR.
Hard money
10% down · 12.0% · 12mo
- Down + closing
- —
- Monthly P&I
- —
- Monthly cashflow
- —
- DSCR
- —
- Eligible?
- —
Short-term bridge; refi at stabilization.
Rent comps 40 comps
| Address | Beds | Baths | Sqft | Rent | $/sqft | DOM | Units | Dist |
|---|---|---|---|---|---|---|---|---|
| 2231 S Liberty St New Orleans, LA | 3.0 | 3.5 | 1752 | $2,000 | $1.14 | 19d | 1 | 0.04mi |
| 2123 S Liberty St Unit 2125 New Orleans, LA | 3.0 | 2.0 | 1500 | $2,100 | $1.40 | 5d | 1 | 0.10mi |
| 2225 2nd St New Orleans, LA | 3.0 | 2.0 | 1100 | $1,800 | $1.64 | 25d | 1 | 0.15mi |
| 2119 Josephine St New Orleans, LA | 3.0 | 1.0 | 1017 | $950 | $0.93 | 23d | 1 | 0.22mi |
| 2403 S Saratoga St New Orleans, LA | 3.0 | 2.5 | 1600 | $2,500 | $1.56 | 25d | 1 | 0.22mi |
| 2102 Josephine St New Orleans, LA | 4.0 | 2.0 | 1286 | $2,100 | $1.63 | 25d | 1 | 0.22mi |
| 1944 Jackson Ave New Orleans, LA | 3.0 | 2.5 | 1572 | $2,500 | $1.59 | 45d | 1 | 0.24mi |
| 1614 Rev John Raphael Jr Way New Orleans, LA | 3.0 | 2.0 | 1000 | $1,500 | $1.50 | 25d | 1 | 0.24mi |
| 2032 Saint Andrew St New Orleans, LA | 3.0 | 2.0 | 1035 | $1,830 | $1.77 | 19d | 1 | 0.28mi |
| 1915 Philip St New Orleans, LA | 3.0 | 1.5 | 1300 | $2,450 | $1.88 | 25d | 1 | 0.29mi |
| 2717 Loyola Ave New Orleans, LA | 3.0 | 2.0 | 1250 | $2,300 | $1.84 | 3d | 1 | 0.29mi |
| 2717 Loyola Ave New Orleans, LA | 3.0 | 2.0 | 1232 | $2,300 | $1.87 | 25d | 1 | 0.29mi |
| 2107 Fourth St New Orleans, LA | 3.0 | 1.0 | 1292 | $1,775 | $1.37 | 19d | 1 | 0.30mi |
| 2526 Martin Luther King Junior Blvd New Orleans, LA | 3.0 | 2.0 | 1200 | $2,200 | $1.83 | 5d | 1 | 0.31mi |
| 2318 Martin Luther King Junior Blvd New Orleans, LA | 3.0 | 2.0 | 1400 | $1,700 | $1.21 | 25d | 1 | 0.32mi |
| 2722 Martin L King Bl New Orleans, LA | 3.0 | 2.5 | 1350 | $1,800 | $1.33 | 25d | 1 | 0.34mi |
| 2733 Danneel St New Orleans, LA | 4.0 | 2.0 | 1350 | $1,775 | $1.31 | 25d | 1 | 0.39mi |
| 1407 Magnolia St New Orleans, LA | 3.0 | 2.0 | 1824 | $1,500 | $0.82 | 25d | 1 | 0.39mi |
| 2713 Baronne St New Orleans, LA | 3.0 | 2.5 | 1600 | $2,300 | $1.44 | 25d | 1 | 0.47mi |
| 3108 Second St New Orleans, LA | 3.0 | 3.0 | 1216 | $2,100 | $1.73 | 5d | 1 | 0.50mi |
| 2628 S Derbigny St New Orleans, LA | 3.0 | 1.0 | 900 | $1,500 | $1.67 | 5d | 1 | 0.50mi |
| 3120 Second St New Orleans, LA | 3.0 | 3.0 | 1256 | $2,050 | $1.63 | 25d | 1 | 0.52mi |
| 3122 2nd St New Orleans, LA | 3.0 | 3.0 | 1206 | $2,075 | $1.72 | 25d | 1 | 0.52mi |
| 2341 S Roman St Unit U New Orleans, LA | 3.0 | 2.0 | 1000 | $1,850 | $1.85 | 25d | 1 | 0.54mi |
| 2833 S Derbigny St New Orleans, LA | 3.0 | 2.0 | 1500 | $1,795 | $1.20 | 25d | 1 | 0.60mi |
| 2931 Baronne St New Orleans, LA | 3.0 | 1.0 | 1145 | $1,510 | $1.32 | 25d | 1 | 0.60mi |
| 3218 Jackson Ave New Orleans, LA | 3.0 | 2.0 | 1267 | $1,750 | $1.38 | 25d | 1 | 0.63mi |
| 3435 Magnolia St New Orleans, LA | 3.0 | 1.0 | 1050 | $1,500 | $1.43 | 25d | 1 | 0.64mi |
| 3429 Clara St New Orleans, LA | 3.0 | 2.0 | 1620 | $2,350 | $1.45 | 16d | 1 | 0.64mi |
| 2539 Amelia St New Orleans, LA | 3.0 | 2.0 | 1296 | $2,200 | $1.70 | 25d | 1 | 0.66mi |
| 3322 Third St New Orleans, LA | 3.0 | 2.0 | 950 | $1,450 | $1.53 | 25d | 1 | 0.66mi |
| 2614 S Johnson St New Orleans, LA | 3.0 | 2.0 | 1536 | $2,079 | $1.35 | 16d | 1 | 0.67mi |
| 3044 Louisiana Avenue Pkwy New Orleans, LA | 3.0 | 2.0 | 1800 | $1,900 | $1.06 | 25d | 1 | 0.69mi |
| 2620 S Galvez St Apt 2B New Orleans, LA | 3.0 | 1.0 | 1000 | $1,100 | $1.10 | 19d | 1 | 0.72mi |
| 2232 Amelia St New Orleans, LA | 3.0 | 2.0 | 900 | $1,800 | $2.00 | 19d | 1 | 0.73mi |
| 3208 Louisiana Avenue Pkwy New Orleans, LA | 3.0 | 2.0 | 1391 | $1,900 | $1.37 | 19d | 1 | 0.74mi |
| 1525 Melpomene St Unit Na New Orleans, LA | 3.0 | 1.5 | 1700 | $4,000 | $2.35 | 45d | 1 | 0.75mi |
| 3230 Toledano St New Orleans, LA | 3.0 | 2.0 | 950 | $1,750 | $1.84 | 25d | 1 | 0.75mi |
| 2535 Marengo St New Orleans, LA | 3.0 | 1.0 | 1300 | $1,200 | $0.92 | 16d | 1 | 0.78mi |
| 3429 Baronne St New Orleans, LA | 3.0 | 2.5 | 1600 | $2,500 | $1.56 | 45d | 1 | 0.78mi |
Listing history 32 events
-
2026-06-21days on market $475,000 Active 33 DOM
-
2026-06-18days on market $475,000 Active 30 DOM
-
2026-06-17days on market $475,000 Active 29 DOM
-
2026-06-16days on market $475,000 Active 28 DOM
-
2026-06-15days on market $475,000 Active 27 DOM
-
2026-06-13days on market $475,000 Active 25 DOM
-
2026-06-10pricedays on market $475,000 Active 22 DOM
-
2026-06-09days on market $500,000 Active 21 DOM
-
2026-06-08days on market $500,000 Active 20 DOM
-
2026-06-07days on market $500,000 Active 19 DOM
-
2026-06-05days on market $500,000 Active 16 DOM
-
2026-06-03days on market $500,000 Active 15 DOM
-
2026-06-02days on market $500,000 Active 14 DOM
-
2026-06-01days on market $500,000 Active 13 DOM
-
2026-05-31days on market $500,000 Active 12 DOM
-
2026-05-19$500,000 Active 1009-char remark
Show marketing remark (1009 chars)
Located in the heart of the vibrant Central City area, this masterfully designed duplex, built in 2019, offers a rare combination of modern luxury and New Orleans charm. Each of the expansive units features a thoughtful layout with three spacious bedrooms, three full bathrooms, and an additional half bath, providing ample privacy and comfort for residents or guests alike. The interiors boast contemporary finishes, walk-in closets, and fully equipped kitchens with stainless steel appliances, while the exterior highlights include a classic front porch and a private backyard perfect for outdoor entertaining. Situated just minutes from the St. Charles Avenue streetcar line, the Garden District, and the bustling corridors of the CBD, this property represents an exceptional opportunity for an owner-occupant or an investor looking for a high-performing asset in a central location. Total rents are currently $4400/mo (with room to increase), tenants pay all utilities and each unit it separately metered.
-
2026-05-19$500,000 Active
Show marketing remark (1009 chars)
Located in the heart of the vibrant Central City area, this masterfully designed duplex, built in 2019, offers a rare combination of modern luxury and New Orleans charm. Each of the expansive units features a thoughtful layout with three spacious bedrooms, three full bathrooms, and an additional half bath, providing ample privacy and comfort for residents or guests alike. The interiors boast contemporary finishes, walk-in closets, and fully equipped kitchens with stainless steel appliances, while the exterior highlights include a classic front porch and a private backyard perfect for outdoor entertaining. Situated just minutes from the St. Charles Avenue streetcar line, the Garden District, and the bustling corridors of the CBD, this property represents an exceptional opportunity for an owner-occupant or an investor looking for a high-performing asset in a central location. Total rents are currently $4400/mo (with room to increase), tenants pay all utilities and each unit it separately metered.
-
2026-03-13historical $1,800
-
2026-02-21price $1,800
-
2026-01-09$1,900
-
2026-01-09historical $1,900
-
2026-01-08$1,900
-
2021-11-03soldstatus $76,500
-
2019-03-08price $599,000
-
2018-12-29price $699,000
-
2018-12-27$599,000
-
2018-02-13historical
-
2017-04-24$149,000 Active
-
2017-04-18$149,000
-
2017-03-13soldstatus $65,000
-
2017-01-30$60,000
-
1978-06-19soldstatus $19,950
ⓘ Source: listings_history table (triggers on properties + properties_extension) + one-shot
backfill from property_details.listing_events for pre-trigger history.
Tax reassessment forecast LA · Resets to sale price
- Current annual tax
- $5,739 · $478/mo
- Projected year-2 tax
- $5,739 · $478/mo
- Expected delta
- $0/yr ($0/mo · 0.0%)
ⓘ Screening estimate from a state-policy table — verify with the county assessor before closing.
Climate risk First Street
- Flood 8/10 Severe FEMA zone X · 60% chance over 30 yrs
- Wildfire 1/10 Low
- Heat 10/10 Extreme 7 d/yr ≥108°F today · 20 d/yr by 30 yrs out
- Wind 10/10 Extreme 99% chance of damaging wind over 30 yrs
- Air quality 3/10 Moderate 3 unhealthy d/yr today · 4 by 30 yrs out
Nearby sold comps map
Loading sold comps map…
Walkable amenities ~0.75 mi
Loading nearby amenities…
Taxation est. · year 1
- Rental income
- $39,240
- − Mortgage interest
- −$26,607
- − Property taxes
- −$5,739
- − Insurance
- −$3,172
- − Repairs & maintenance
- −$3,139
- − Management
- −$3,139
- − Depreciation
- −$13,818
- Taxable loss
- −$16,376
- Est. tax savings @ 24.0%
- +$3,930
- After-tax cash flow
- $-3,873/yr
For passive investors: Depreciation is non-cash, so a rental often shows a tax loss while cash-flowing — sheltering income. Rental losses are passive: they offset passive income freely, and up to $25,000/yr can offset ordinary (W-2) income if you actively participate and your MAGI is under $100k (phasing out to $0 by $150k); unused losses carry forward. On sale, claimed depreciation is recaptured at up to 25%, and gains may owe capital-gains tax (a 1031 exchange can defer both). Figures are a year-1 estimate at your 24.0% rate — not tax advice; consult a CPA.
Schools (NCES district)
- District
- Orleans Parish
- NCES district ID
- 2201170
- Math proficiency
- 11% ▼ -52.00%
- Reading proficiency
- 27% ▼ -46.00%
- Median HH income
- $37,011
- Composite
- 15.78/100
- National rank
- #9271
- State rank
- #69 of 98 in LA
Livability — New Orleans
- Score
- 81/100
- State rank
- #3
- US rank
- #1383
Category grades
Schools grade is shown separately in the Schools card above.
Census & demographics
- Census place
- New Orleans, LA
- County
- Orleans Parish · 338,817 people
- City population
- 338,817
- Metro
- New Orleans-Metairie, LA
- Population (ZIP)
- 9,387
- Household income
- $39,333
- Rent vs Own
- Severe rent burden
- 714.0
Population outlook (Orleans County) Hauer SSP2
- Today (2025)
- 513,025 people
- By 2030
- 575,781 · +12.2%
- By 2040
- 700,174 · +36.5%
- By 2050
- 826,541 · +61.1%
- By 2075
- 1,123,374 · +119.0%
- By 2100
- 1,355,609 · +164.2%
Race, ethnicity, and origin ACS 2023
- Neighborhood character
- Diverse neighborhood (Simpson 0.57)
- Race & ethnicity
- Black 61% White 20% Hispanic / Latino 13% Two or more races 11% Asian 2%
- Hispanic origin (detail)
- Mexican 2%
- Common ancestry
- Lithuanian 2% Portuguese 1% Slovak 1%
- Foreign-born
- 13% · Canada, Vietnam, China
- Languages at home
- 86% English-only · Spanish 11% Other Indo-European 1% Vietnamese 1%
Political lean MEDSL · Orleans
- 2024 margin
- Solid D (+67.0) · D 82.2% · R 15.2% · Other 2.7%
- 2008→2024 swing
- +6.7pp toward D · 2008: 60.3pp · 2024: 67.0pp
- All cycles
- 2024: D+67.0 2020: D+68.2 2016: D+66.2 2012: D+62.5 2008: D+60.3
Not yet ingested
- Civics
- —
Market trends
- HPI YoY
- ▲ 65.92%
- Current HPI
- 229.3968
- Rent YoY
- ▲ 5.98%
- Metro
- New Orleans-Metairie, LA
- State GDP YoY
- ▲ 3.29%
- F500 in state
- 10
Industry mix (Fortune 500 HQ in LA)
| Industry | F500 HQs | Revenue |
|---|---|---|
| Telecommunications | 2 | $23B |
|
||
| Utilities | 1 | $12B |
|
||
| Wholesale / Distribution | 1 | $5B |
|
||
| Advertising | 1 | $2B |
|
||
Price history
+2406.3% since first listed17 events — show timeline
- 2026-05-19 Listed $500,000 GSREIN
- 2026-05-19 Listed $500,000 AcadianaMLS
- 2026-03-13 Rental Removed $1,800 TENANTTURNER2
- 2026-02-21 Price Changed $1,800 TENANTTURNER2
- 2026-01-09 Listed for Rent $1,900 TENANTTURNER2
- 2026-01-09 Rental Removed $1,900 APPFOLIO
- 2026-01-08 Listed for Rent $1,900 APPFOLIO
- 2021-11-03 Sold (Public Records) $76,500 Public Records
- 2019-03-08 Price Changed $599,000 GSREIN
- 2018-12-29 Price Changed $699,000 GSREIN
- 2018-12-27 Listed $599,000 AcadianaMLS
- 2018-02-13 Listing Removed — GSREIN
- 2017-04-24 Listed $149,000 GSREIN
- 2017-04-18 Listed $149,000 AcadianaMLS
- 2017-03-13 Sold (Public Records) $65,000 Public Records
- 2017-01-30 Listed $60,000 AcadianaMLS
- 1978-06-19 Sold (Public Records) $19,950 Public Records
Property tax history
+45.4%/yrLatest (2026): $5,739 · +1.1% YoY. Source: county tax records.
Cash-flow waterfall
monthlySold comps — $/sqft
last 12 mo · ≤1 miLoading sold comps…