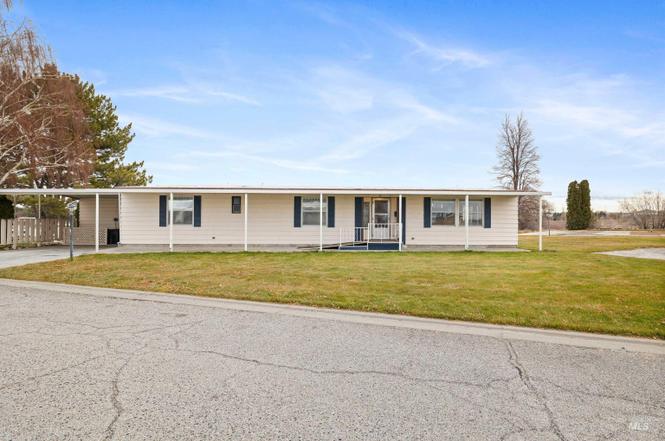
450 Pole Line #84 · Twin Falls, ID
Flood risk 1/10 · Minimal
- FEMA flood zone
- X (unshaded)
- Chance of flooding over 30 yrs
- 0.0%
- Est. flood insurance / yr
- $507 – $1,088
Fire risk 8/10 · Major
- Est. fire insurance / yr
- $584 – $1,086
Heat risk 4/10 · Minor
- Hot days now (above 94°F)
- 7 days/yr
- Hot days in 30 yrs
- 17 days/yr
Wind risk 1/10 · Minimal
- Chance of severe wind over 30 yrs
- —
Air-quality risk 7/10 · Major
- Unhealthy air days now
- 12 days/yr
- Unhealthy air days in 30 yrs
- 15 days/yr
Risk factors via First Street. Map © Google.
Why this score? — see what drove the B grade
The composite is a weighted blend of 9 inputs, each scored 0–100. Each bar is that input's sub-score; the figure is the points it added to the 100-point composite (weight × sub-score).
- Cash flow +27.3/30.0
- ARV discount +15.0/15.0
- 1% rule +10.0/10.0
- DSCR +9.5/10.0
- Livability +3.7/5.0
- Schools +3.5/10.0
- Rent growth +3.2/5.0
- Condition / age +2.5/5.0
- Appreciation +0.0/10.0
$65,000
🖨 Deal sheet 📄 Offer letter ✓ Due diligence
Listing remarks
Welcome home to this charming 2 bedroom home with a versatile flex room ideal for a home office or hobby room. Located in a desirable 55+ mobile home community. Seller is offering a $5,000 flooring allowance with a reasonable offer allowing Buyers to personalize flooring to their taste. Conveniently situated near shopping, restaurants, schools, hotels, and everyday services. Rental space includes lawn maintenance and trash pick up. An excellent opportunity for comfortable low maintenance living in a prime location.
Key facts
- Flooring allowance
- Flex room
- Prime location
Tags
Neighborhood map
What this means for you Summary
Snapshot
- This is a 2-bed/2.0-bath manufactured listed at $65k.
Deal economics
- At list price, monthly cash flow is $189 ($2k/yr) — positive.
- The deal already cash-flows at list — no discount required.
- Meets the 1% rule at list price ($2k rent vs $65k).
- Recommended offer: $61k (6.0% below list) — sets the bar for market timing.
- Cap rate 9.8% vs local median 2.4% in Twin Falls — top-decile yield for the area; either an underpriced asset or a hidden risk that comps aren't pricing in. Stress-test before assuming the spread holds.
Location & tenants
- Location reads 74/100 on livability (#33 in ID, #4,779 nationally) — a middle-class / working-renter tenant base. Strengths: cost of living A+, housing A+, health & safety A+; Watch: crime C-, commute F.
- Twin Falls District (town): math 34% / reading 49% proficiency, ranked #62 of 92 in ID (top 67%) — families likely to look elsewhere, expect single-tenant / working-renter base with shorter leases.
- Zoned schools: Harrison Elementary School (math 32% / reading 37%, grade F, #272 of 357 statewide, top 80%, 389 students, 65% FRL); Canyon Ridge High School (math 26% / reading 59%, grade F, #71 of 169 statewide, top 42%, 1,409 students, 18% FRL) — zoned schools at 42% FRL track the district average.
- Market conditions: Rents rising (+2.9%/yr); 620 active listings in the ZIP; 636 units permitted in Twin Falls County in 2024 (12 in 5+ unit buildings).
- This rent runs 31% of the median local income ($63k/yr) — at the standard rent-burdened threshold; future hikes will face affordability resistance.
Forward outlook
- Local home prices are declining (-3.0%/yr); year-one equity from $449 of loan paydown is wiped out by about $2k of value loss. Plan a longer hold.
- Twin Falls County population projected at +29% by 2050 — long-run rental-demand tailwind backs the buy-and-hold thesis.
- At projected returns (-3.0% appreciation + 2.9% rent growth), your $18k cash investment doubles in ~9 years — after that, you're playing with house money.
Negotiation context
- It's been on market 65 days — a 6% lower offer ($61k) is reasonable based on typical stale-listing flexibility.
- 6 sale attempts since 17y ago; this cycle's ask has dropped $20k (24%) from the opening price — seller is motivated, your offer sets the floor, not the list.
Risks & watch-outs
- Watch-outs: HOA is 40% of rent.
- Climate carrying-cost: severe wildfire risk — expect insurance premiums to compound above CPI over the hold.
Questions for the listing agent
- It's been on market 65 days. Have you received any prior offers? Is the seller open to a 6% concession, seller financing, or rate buy-down credit?
- Built in 1974 — when were the roof, HVAC, electrical panel, plumbing, and water heater last replaced?
- What does the HOA fee cover, when was the last increase, and are there any pending special assessments or reserve-fund shortfalls?
- Why hasn't it sold? Are there any deal-killer items the seller is aware of (foundation, flood, title, zoning, code violations)?
- Is there a deadline driving the sale (1031 exchange, divorce, estate, relocation)? That informs how much negotiation room exists.
- What's the average days-on-market for RENTAL listings here right now (not sales)? A rising rental-DOM trend means longer vacancies and softer asking-rent achievability than the comps imply.
- What's the recent tenant-quality profile in this submarket — average credit score on applications, eviction rate, late-payment / NSF rate, and stable-employment percentage? A property-management company in the area should have these aggregated.
- How much new for-sale + rental construction is in the pipeline within 1–3 miles? Heavy new supply typically softens prices + rents 12–24 months out; constrained supply supports both.
Investment metrics
- 1% rule
- 2.51% ✓
- Cap rate
- 9.78%
- Cash-on-cash
- 12.46%
- DSCR
- 1.55
- GRM
- 3.3
CMA / ARV
- ARV (on-the-fly)
- $103,540
- Comps found
- 3
Show comp detail 3 sales within ~0.75 mi
| Address | Dist | Beds/Ba | Sqft | Sold | Price | $/sf | Match |
|---|---|---|---|---|---|---|---|
| 450 Pole Line Rd #138 | 0.01mi | 3/2.0 (+1) | 1,680 (+1%) | 10mo | $69,900 | $42 | 85 |
| 450 Pole Line Rd #157 | 0.01mi | 2/2.0 | 1,650 (-1%) | 24mo | $116,500 | $71 | 78 |
| 450 Pole Line Rd #145 | 0.01mi | 3/2.0 (+1) | 1,868 (+12%) | 19mo | $115,000 | $62 | 59 |
Match score weights: distance 35% · size 25% · config 20% · recency 20%. Top-matched comps best support the ARV.
Projected returns pro-forma
-3.0% appreciation · 2.91% rent growth · sell at horizon
- IRR
- 2.5%
- Equity multiple
- 1.10×
- Total profit
- $1,777
- Equity at exit
- $9,692
- IRR
- 12.4%
- Equity multiple
- 2.00×
- Total profit
- $18,161
- Equity at exit
- $5,620
Cash invested: $18,200 (down + closing). Projections, not guarantees.
Landlord ↔ Tenant lean methodology
- Overall (STATE)
- 91 Strongly Landlord-Friendly
- State Idaho
- 91 Strongly Landlord-Friendly · R+18
- County
- — inherits STATE
- City
- — inherits STATE
ZIP-level market 83301
- Rents YoY
- 2.9%
- Active inventory
- 620
- Price-to-rent
- 3.3×
Monthly cashflow live
- Estimated rent
- $1,631 medium interval (Pro) →
- Mortgage (P&I)
- −$341
- Tax est. 1.5%
- −$81 /mo · $975/yr
- Insurance
- −$27
- HOA
- −$650
- Vacancy / Maint / Mgmt
- −$342
- Net cashflow
- $189
Break-even live
UW: 25.0% down · 7.5% · 30yr · 1.5% tax · 5.0% vac · 8.0% maint · 8.0% mgmt
Financing live
Cash to close
- Down payment
- $16,250
- Closing costs
- $1,950
- Reserves months
- —
- Total cash needed
- —
Loan-product check · same deal, 3 products live
Conventional
25% down · 7.5% · 30yr
- Down + closing
- —
- Monthly P&I
- —
- Monthly cashflow
- —
- DSCR
- —
- Eligible?
- —
Personal DTI + credit; lowest rate.
DSCR
20% down · 8.5% · 30yr
- Down + closing
- —
- Monthly P&I
- —
- Monthly cashflow
- —
- DSCR
- —
- Eligible?
- —
No personal income docs; deal must DSCR.
Hard money
10% down · 12.0% · 12mo
- Down + closing
- —
- Monthly P&I
- —
- Monthly cashflow
- —
- DSCR
- —
- Eligible?
- —
Short-term bridge; refi at stabilization.
HOA detail
- Monthly dues
- $650 · $7,800/yr
- Likely covers
- trash
Listing history 20 events
-
2026-03-21status Pending
-
2026-02-28price $65,000
-
2026-02-17price $75,000
-
2026-01-30price $80,000
-
2026-01-15$85,000 Active
-
2022-06-29historical
-
2022-06-02$73,000 Active
-
2022-05-23historical
-
2022-05-07status Active
-
2022-05-07price $79,999
-
2022-04-27status Pending
-
2022-04-20status Active
-
2022-04-12status Pending
-
2022-04-05price $87,900
-
2022-03-09price $89,900
-
2022-03-01price $99,900
-
2022-03-01price $99,000
-
2022-02-18$109,000 Active
-
2009-04-15soldstatus
-
2009-03-10$30,000
ⓘ Source: listings_history table (triggers on properties + properties_extension) + one-shot
backfill from property_details.listing_events for pre-trigger history.
Climate risk First Street
- Flood 1/10 Low FEMA zone X (unshaded) · 0% chance over 30 yrs
- Wildfire 8/10 Severe
- Heat 4/10 Moderate 7 d/yr ≥94°F today · 17 d/yr by 30 yrs out
- Wind 1/10 Low
- Air quality 7/10 Severe 12 unhealthy d/yr today · 15 by 30 yrs out
Nearby sold comps map
Loading sold comps map…
Walkable amenities ~0.75 mi
Loading nearby amenities…
Taxation est. · year 1
- Rental income
- $19,567
- − Mortgage interest
- −$3,641
- − Property taxes
- −$975
- − Insurance
- −$325
- − Repairs & maintenance
- −$1,565
- − Management
- −$1,565
- − HOA
- −$7,800
- − Depreciation
- −$1,891
- Taxable income
- $1,804
- Est. tax owed @ 24.0%
- −$433
- After-tax cash flow
- $1,834/yr
For passive investors: Depreciation is non-cash, so a rental often shows a tax loss while cash-flowing — sheltering income. Rental losses are passive: they offset passive income freely, and up to $25,000/yr can offset ordinary (W-2) income if you actively participate and your MAGI is under $100k (phasing out to $0 by $150k); unused losses carry forward. On sale, claimed depreciation is recaptured at up to 25%, and gains may owe capital-gains tax (a 1031 exchange can defer both). Figures are a year-1 estimate at your 24.0% rate — not tax advice; consult a CPA.
Schools (NCES district)
- District
- Twin Falls District
- NCES district ID
- 1603240
- Math proficiency
- 34% ▼ -8.00%
- Reading proficiency
- 49% ▼ -2.00%
- Median HH income
- $44,465
- Composite
- 35.15/100
- National rank
- #5006
- State rank
- #62 of 92 in ID
Livability — Twin Falls
- Score
- 74/100
- State rank
- #33
- US rank
- #4779
Category grades
Schools grade is shown separately in the Schools card above.
Census & demographics
- Census place
- Twin Falls, ID
- County
- Twin Falls County · 63,592 people
- City population
- 63,592
- Metro
- Twin Falls, ID
- Population (ZIP)
- 63,592
- Household income
- $62,647
- Rent vs Own
- Severe rent burden
- 1784.0
Population outlook (Twin Falls County) Hauer SSP2
- Today (2025)
- 92,642 people
- By 2030
- 97,900 · +5.7%
- By 2040
- 108,553 · +17.2%
- By 2050
- 119,443 · +28.9%
- By 2075
- 146,906 · +58.6%
- By 2100
- 168,212 · +81.6%
Race, ethnicity, and origin ACS 2023
- Neighborhood character
- Predominantly White (76%)
- Race & ethnicity
- White 76% Hispanic / Latino 16% Two or more races 10% Asian 2%
- Hispanic origin (detail)
- Mexican 14%
- Common ancestry
- Slovak 3% Italian 2% Portuguese 2%
- Foreign-born
- 8% · Canada, India
- Languages at home
- 86% English-only · Spanish 10% Other Indo-European 2% Arabic 1%
Political lean MEDSL · Twin Falls
- 2024 margin
- Solid R (+48.8) · D 24.2% · R 73.1% · Other 2.7%
- 2008→2024 swing
- -12.1pp toward R · 2008: -36.7pp · 2024: -48.8pp
- All cycles
- 2024: R+48.8 2020: R+45.0 2016: R+44.6 2012: R+43.5 2008: R+36.7
Not yet ingested
- Civics
- —
Market trends
- HPI YoY
- ▼ -247.58%
- Current HPI
- 271.0297
- Rent YoY
- ▲ 2.91%
- Metro
- Twin Falls, ID
- State GDP YoY
- ▲ 4.51%
- F500 in state
- 6
Industry mix (Fortune 500 HQ in ID)
| Industry | F500 HQs | Revenue |
|---|---|---|
| Retail | 1 | $79B |
|
||
| Technology | 1 | $25B |
|
||
| Food / Agriculture | 1 | $6B |
|
||
Price history
+116.7% since first listed20 events — show timeline
- 2026-03-21 Pending — IMLS
- 2026-02-28 Price Changed $65,000 IMLS
- 2026-02-17 Price Changed $75,000 IMLS
- 2026-01-30 Price Changed $80,000 IMLS
- 2026-01-15 Listed $85,000 IMLS
- 2022-06-29 Listing Removed — IMLS
- 2022-06-02 Listed $73,000 IMLS
- 2022-05-23 Listing Removed — IMLS
- 2022-05-07 Relisted — IMLS
- 2022-05-07 Price Changed $79,999 IMLS
- 2022-04-27 Pending — IMLS
- 2022-04-20 Relisted — IMLS
- 2022-04-12 Pending — IMLS
- 2022-04-05 Price Changed $87,900 IMLS
- 2022-03-09 Price Changed $89,900 IMLS
- 2022-03-01 Price Changed $99,900 IMLS
- 2022-03-01 Price Changed $99,000 IMLS
- 2022-02-18 Listed $109,000 IMLS
- 2009-04-15 Sold (MLS) — IMLS
- 2009-03-10 Listed $30,000 IMLS
Cash-flow waterfall
monthlySold comps — $/sqft
last 12 mo · ≤1 miLoading sold comps…