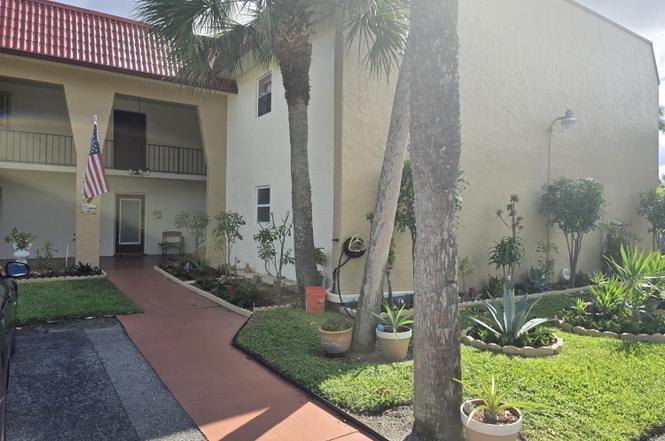
112 Lake Dora Dr · West Palm Beach, FL
Flood risk 1/10 · Minimal
- FEMA flood zone
- X (unshaded)
- Chance of flooding over 30 yrs
- 0.0%
- Est. flood insurance / yr
- $507 – $1,088
Fire risk 5/10 · Moderate
- Est. fire insurance / yr
- $947 – $1,759
Heat risk 10/10 · Severe
- Hot days now (above 106°F)
- 7 days/yr
- Hot days in 30 yrs
- 26 days/yr
Wind risk 10/10 · Severe
- Chance of severe wind over 30 yrs
- 99.0%
Air-quality risk 2/10 · Minimal
- Unhealthy air days now
- 0 days/yr
- Unhealthy air days in 30 yrs
- 1 days/yr
Risk factors via First Street. Map © Google.
Why this score? — see what drove the C- grade
The composite is a weighted blend of 9 inputs, each scored 0–100. Each bar is that input's sub-score; the figure is the points it added to the 100-point composite (weight × sub-score).
- Cash flow +11.1/30.0
- Appreciation +10.0/10.0
- ARV discount +7.5/15.0
- 1% rule +6.7/10.0
- Schools +4.3/10.0
- Livability +4.1/5.0
- DSCR +3.2/10.0
- Rent growth +2.7/5.0
- Condition / age +2.5/5.0
$156,900
🖨 Deal sheet 📄 Offer letter ✓ Due diligence
Listing remarks
PARADISE FOUND ! 2ND FLOOR BEAUTY, FULL 2/2 SPLIT FLOOR PLAN. FANTASTIC WATER VIEW !! NEXT DOOR TO CLUBHOUSE ''A'' & ALL THE AMENITIES! HAS A STACK WASHER & DRYER INSIDE UTILITY CLOSET. COMES TASTEFULLY FURNISHED OR FURNITURE NEGOTIABLE. UNIT HAS EXTRA OUTSIDE STORAGE !! THIS IS A 24/7 GUARD GATED COMMUNITY ! MANY ACTIVITIES WITH SOCIAL DIRECTOR TO KEEP YOU BUSY & HAVING FUN ! MANY CLUBS, CARDS, DINNER DANCES, BINGO, ETC. THERE'S A GYM, HEATED POOL & HOT TUB, BILLIARDS & GAME ROOM. LOCATED CLOSE TO SHOPPING , RESTAURANTS & TURNPIKE ! AIRPORT & OCEAN A SHORT DRIVE AWAY ! COME SEE & WALK AWAY LOVING IT !
Key facts
- Stack washer
- Gym
- Water view
Tags
Property features AI
Finance
- Other: Pets allowed; Community contains a large number of units (community-sized complex)
- Financial info: Monthly HOA fee reported
- HOA & community: Community association with monthly fee; HOA amenities include: pool, spa/hot tub, fitness center, clubhouse, billiard room, game room, community room, cabana, library, storage, courtesy bus, tennis courts, pickleball courts, shuffleboard court, sidewalks, street lights
Exterior
- Parking: Assigned parking (total of 1 space); No carport
- Security: Gated community with guard; Gated community without guard; Security patrol
- Utilities: Public water; Public sewer; Three-phase electric; Cable available
- Home design: Condominium; One level (living area noted as upstairs living area inside); Faces west; Resale property
- Construction: CBS construction; Mixed roof; 2 total stories (building); Built prior to listing (resale)
- Exterior features: Covered patio; Patio; Porch; Glass-enclosed porch; Sidewalks; Waterfront
Interior
- Kitchen: Dishwasher; Electric range; Microwave; Refrigerator; Electric water heater
- Bedrooms: 2 bedrooms on the main level
- Flooring: Carpet; Ceramic tile; Vinyl
- Bathrooms: 2 full bathrooms on the main level
- Heating & cooling: Central electric heating; Central electric cooling
- Interior features: Walk-in closets; Split bedroom layout; Custom mirrors; Upstairs living area; Furnished
- Laundry & utility: Laundry closet with washer hookup inside
Neighborhood map
What this means for you Summary
Snapshot
- This is a 2-bed/2.0-bath condo listed at $157k.
Deal economics
- At list price, monthly cash flow is $-63 ($-759/yr) — negative.
- To cash-flow at today's rent, offer at most $146k (7.1% below list).
- Meets the 1% rule at list price ($2k rent vs $157k).
- Recommended offer: $138k (12.0% below list) — sets the bar for market timing.
- Cap rate 5.8% vs local median 3.8% in West Palm Beach — top-decile yield for the area; either an underpriced asset or a hidden risk that comps aren't pricing in. Stress-test before assuming the spread holds.
Location & tenants
- Location reads 82/100 on livability (#75 in FL, #1,255 nationally) — a professional / high-income tenant draw. Strengths: commute A+, housing A+, health & safety A+; Watch: employment C-, crime F.
- Palm Beach (suburban): math 46% / reading 53% proficiency, ranked #34 of 73 in FL (top 47%) — families likely to look elsewhere, expect single-tenant / working-renter base with shorter leases.
- Market conditions: Rents flat; 574 active listings in the ZIP; 40 comparable units currently listed for rent nearby; rentals at typical pace (median 21d on market — plan ~3-4 weeks tenant-placement turnaround); solid renter incomes; 3,974 units permitted in Palm Beach County in 2024 (1,012 in 5+ unit buildings).
Forward outlook
- In year one you build about $17k of equity ($1k loan paydown + $16k appreciation (10.0% local appreciation)).
- Palm Beach County population projected at +30% by 2050 — long-run rental-demand tailwind backs the buy-and-hold thesis.
- At projected returns (10.0% appreciation + 0.8% rent growth), your $44k cash investment doubles in ~3 years — after that, you're playing with house money.
- By year 3, paydown + projected appreciation supports a ~$42k cash-out refi (75% LTV) — recoverable capital for the next deal without selling this one.
Negotiation context
- It's been on market 200 days — a 12% lower offer ($138k) is reasonable based on typical stale-listing flexibility.
- 9 sale attempts since 2y ago; this cycle's ask is 8617% above the opening price — seller raised mid-cycle; expect resistance to lowballs.
- Current owner paid $52k; list at $157k implies a 199% gain — meaningful room to come down on a strong offer.
Risks & watch-outs
- Watch-outs: HOA is 26% of rent.
- Climate carrying-cost: severe wind risk, 99% chance of damaging wind over 30y; moderate wildfire risk; extreme-heat days projected 7→26/yr by 2055 (HVAC capex compounding) — expect insurance premiums to compound above CPI over the hold.
Questions for the listing agent
- What do current leases actually rent for vs. the listed asking? Can we see a recent rent roll and the last 12 months of T-12 income?
- It's been on market 200 days. Have you received any prior offers? Is the seller open to a 12% concession, seller financing, or rate buy-down credit?
- Built in 1979 — when were the roof, HVAC, electrical panel, plumbing, and water heater last replaced?
- What does the HOA fee cover, when was the last increase, and are there any pending special assessments or reserve-fund shortfalls?
- Any open or pending special assessments — roof, HVAC, plumbing, elevator, façade? What's the per-unit balance and payoff schedule, and is the seller paying it off at close or rolling it to the buyer?
- Why hasn't it sold? Are there any deal-killer items the seller is aware of (foundation, flood, title, zoning, code violations)?
- Is there a deadline driving the sale (1031 exchange, divorce, estate, relocation)? That informs how much negotiation room exists.
- Crime grade is F in this area — have there been break-ins, vandalism, or insurance claims at this property in the last 3 years? What carrier currently insures it and at what premium?
- What's the average days-on-market for RENTAL listings here right now (not sales)? A rising rental-DOM trend means longer vacancies and softer asking-rent achievability than the comps imply.
- What's the recent tenant-quality profile in this submarket — average credit score on applications, eviction rate, late-payment / NSF rate, and stable-employment percentage? A property-management company in the area should have these aggregated.
- How much new apartment / multifamily construction is in the pipeline within 1–3 miles? Heavy new supply (>2% of stock underway) typically softens rents 12–24 months out; light construction supports rent growth.
Investment metrics
- 1% rule
- 1.17% ✓
- Cap rate
- 5.81%
- Cash-on-cash
- -1.73%
- DSCR
- 0.92
- GRM
- 7.1
CMA / ARV
No comps found within radius.
Projected returns pro-forma
10.0% appreciation · 0.85% rent growth · sell at horizon
- IRR
- 22.2%
- Equity multiple
- 2.77×
- Total profit
- $77,815
- Equity at exit
- $141,348
- IRR
- 19.3%
- Equity multiple
- 6.14×
- Total profit
- $225,663
- Equity at exit
- $304,822
Cash invested: $43,932 (down + closing). Projections, not guarantees.
Landlord ↔ Tenant lean methodology
- Overall (STATE)
- 87 Strongly Landlord-Friendly
- State Florida
- 87 Strongly Landlord-Friendly · R+3
- County
- — inherits STATE
- City
- — inherits STATE
ZIP-level market 33411
- Home prices YoY
- 1.9%
- Rents YoY
- 0.8%
- Active inventory
- 574
- Price-to-rent
- 7.1×
Monthly cashflow live
- Estimated rent
- $1,843 high interval (Pro) →
- Mortgage (P&I)
- −$823
- Tax from tax record
- −$154 /mo · $1,848/yr
- Insurance
- −$65
- HOA
- −$477
- Vacancy / Maint / Mgmt
- −$387
- Net cashflow
- $-63
Break-even live
UW: 25.0% down · 7.5% · 30yr · 1.5% tax · 5.0% vac · 8.0% maint · 8.0% mgmt
Financing live
Cash to close
- Down payment
- $39,225
- Closing costs
- $4,707
- Reserves months
- —
- Total cash needed
- —
Loan-product check · same deal, 3 products live
Conventional
25% down · 7.5% · 30yr
- Down + closing
- —
- Monthly P&I
- —
- Monthly cashflow
- —
- DSCR
- —
- Eligible?
- —
Personal DTI + credit; lowest rate.
DSCR
20% down · 8.5% · 30yr
- Down + closing
- —
- Monthly P&I
- —
- Monthly cashflow
- —
- DSCR
- —
- Eligible?
- —
No personal income docs; deal must DSCR.
Hard money
10% down · 12.0% · 12mo
- Down + closing
- —
- Monthly P&I
- —
- Monthly cashflow
- —
- DSCR
- —
- Eligible?
- —
Short-term bridge; refi at stabilization.
Rent comps 40 comps
| Address | Beds | Baths | Sqft | Rent | $/sqft | DOM | Units | Dist |
|---|---|---|---|---|---|---|---|---|
| 230 Lake Dora Dr #230 West Palm Beach, FL | 2.0 | 2.0 | 888 | $1,700 | $1.91 | 7d | 1 | 0.10mi |
| 155 Lake Carol Dr Unit 155 West Palm Beach, FL | 2.0 | 2.0 | 812 | $1,950 | $2.40 | 24d | 1 | 0.14mi |
| 161 Lake Frances Dr Unit 161 West Palm Beach, FL | 1.0 | 1.5 | 704 | $1,430 | $2.03 | 7d | 1 | 0.14mi |
| 138 Lake Frances Dr West Palm Beach, FL | 2.0 | 2.0 | 812 | $1,845 | $2.27 | 24d | 1 | 0.17mi |
| 173 Lake Dora Dr #173 West Palm Beach, FL | 1.0 | 1.5 | 704 | $1,400 | $1.99 | 24d | 1 | 0.20mi |
| 228 Lake Dora Dr West Palm Beach, FL | 1.0 | 1.5 | 704 | $1,500 | $2.13 | 24d | 1 | 0.20mi |
| 129 Lake Carol Dr #129 West Palm Beach, FL | 1.0 | 1.0 | 600 | $1,500 | $2.50 | 24d | 1 | 0.20mi |
| 321 Lake Evelyn Dr West Palm Beach, FL | 2.0 | 2.0 | 888 | $1,600 | $1.80 | 24d | 1 | 0.20mi |
| 314 Lake Dora Dr West Palm Beach, FL | 2.0 | 2.0 | 888 | $1,650 | $1.86 | 20d | 1 | 0.20mi |
| 228 Lake Dora Dr West Palm Beach, FL | 1.0 | 1.5 | 704 | $1,500 | $2.13 | 22d | 1 | 0.20mi |
| 175 Lake Carol Dr #175 West Palm Beach, FL | 1.0 | 1.0 | 600 | $1,300 | $2.17 | 24d | 1 | 0.20mi |
| 106 Lake Dora Dr West Palm Beach, FL | 2.0 | 2.0 | 812 | $1,600 | $1.97 | 24d | 1 | 0.20mi |
| 200 Lake Carol Dr West Palm Beach, FL | 2.0 | 2.0 | 888 | $1,750 | $1.97 | 24d | 1 | 0.20mi |
| 235 Lake Dora Dr West Palm Beach, FL | 2.0 | 2.0 | 812 | $1,860 | $2.29 | 24d | 1 | 0.20mi |
| 203 Lake Carol Dr West Palm Beach, FL | 1.0 | 1.0 | 600 | $1,500 | $2.50 | 24d | 1 | 0.21mi |
| 1564 Lake Crystal Dr Unit F West Palm Beach, FL | 2.0 | 2.0 | 904 | $1,850 | $2.05 | 17d | 1 | 0.25mi |
| 1542 Lake Crystal Dr Unit H West Palm Beach, FL | 2.0 | 2.0 | 900 | $1,900 | $2.11 | 24d | 1 | 0.26mi |
| 1542 Lake Crystal Dr Unit H West Palm Beach, FL | 2.0 | 2.0 | 900 | $1,900 | $2.11 | 22d | 1 | 0.26mi |
| 1547 Lake Crystal Dr Unit A West Palm Beach, FL | 2.0 | 2.0 | 900 | $1,900 | $2.11 | 14d | 1 | 0.29mi |
| 1547 Lake Crystal Dr Unit A West Palm Beach, FL | 2.0 | 2.0 | 900 | $1,950 | $2.17 | 24d | 1 | 0.29mi |
| 1545 Lake Crystal Dr Unit D West Palm Beach, FL | 1.0 | 1.0 | 700 | $1,675 | $2.39 | 14d | 1 | 0.29mi |
| 1525 Lake Crystal Dr Unit C West Palm Beach, FL | 2.0 | 2.0 | 904 | $1,800 | $1.99 | 7d | 1 | 0.35mi |
| 1760 Windorah Way Unit H West Palm Beach, FL | 2.0 | 1.0 | 904 | $1,850 | $2.05 | 24d | 1 | 0.36mi |
| 108 Lake Nancy Dr West Palm Beach, FL | 2.0 | 2.0 | 967 | $1,800 | $1.86 | 24d | 1 | 0.37mi |
| 1477 Lake Crystal Dr Unit D West Palm Beach, FL | 2.0 | 2.0 | 928 | $1,975 | $2.13 | 17d | 1 | 0.39mi |
| 1700 Windorah Way Unit A West Palm Beach, FL | 2.0 | 2.0 | 904 | $1,900 | $2.10 | 14d | 1 | 0.41mi |
| 1455 Lake Crystal Dr Unit H West Palm Beach, FL | 2.0 | 2.0 | 904 | $1,850 | $2.05 | 15d | 1 | 0.41mi |
| 1455 Lake Crystal Dr Unit H West Palm Beach, FL | 2.0 | 2.0 | 904 | $1,850 | $2.05 | 14d | 1 | 0.41mi |
| 1465 Lake Crystal Dr Unit A West Palm Beach, FL | 2.0 | 2.0 | 904 | $1,900 | $2.10 | 2d | 1 | 0.42mi |
| 1660 Windorah Way Unit H West Palm Beach, FL | 2.0 | 2.0 | 904 | $1,900 | $2.10 | 5d | 1 | 0.42mi |
| 221 Lake Meryl Dr West Palm Beach, FL | 2.0 | 2.0 | 1000 | $1,550 | $1.55 | 24d | 1 | 0.42mi |
| 1453 Lake Crystal Dr Unit D West Palm Beach, FL | 2.0 | 2.0 | 904 | $1,900 | $2.10 | 14d | 1 | 0.42mi |
| 1500 Windorah Way Unit D West Palm Beach, FL | 2.0 | 2.0 | 904 | $1,850 | $2.05 | 7d | 1 | 0.45mi |
| 1500 Windorah Way Unit D West Palm Beach, FL | 2.0 | 2.0 | 904 | $1,850 | $2.05 | 24d | 1 | 0.45mi |
| 7130 Okeechobee Blvd West Palm Beach, FL | 1.0–3.0 | 1.0–2.0 | 1086 | $2,488 | $2.29 | 3d | 9 | 0.46mi |
| 1540 Windorah Way Unit D West Palm Beach, FL | 2.0 | 2.0 | 904 | $1,850 | $2.05 | 18d | 1 | 0.46mi |
| 1701 Balfour Point Dr Unit G West Palm Beach, FL | 2.0 | 2.0 | 916 | $1,900 | $2.07 | 14d | 1 | 0.47mi |
| 1641 Balfour Point Dr Unit A West Palm Beach, FL | 2.0 | 2.0 | 950 | $1,899 | $2.00 | 7d | 1 | 0.48mi |
| 1661 Balfour Point Dr Unit H West Palm Beach, FL | 2.0 | 1.0 | 904 | $1,850 | $2.05 | 2d | 1 | 0.49mi |
| 1661 Balfour Point Dr Unit E West Palm Beach, FL | 2.0 | 2.0 | 904 | $2,000 | $2.21 | 17d | 1 | 0.49mi |
HOA detail condo
- Monthly dues
- $477 · $5,724/yr
- Likely covers
- waterpoolgymsecurity
- Assessments
- None detected in remarks — confirm with the listing agent.
Listing history 32 events
-
2026-06-18days on market $156,900 Active 200 DOM
-
2026-06-17days on market $156,900 Active 199 DOM
-
2026-06-16days on market $156,900 Active 198 DOM
-
2026-06-15days on market $156,900 Active 197 DOM
-
2026-06-13days on market $156,900 Active 195 DOM
-
2026-06-09days on market $156,900 Active 191 DOM
-
2026-06-07days on market $156,900 Active 189 DOM
-
2026-06-04days on market $156,900 Active 186 DOM
-
2026-06-03days on market $156,900 Active 185 DOM
-
2026-06-01days on market $156,900 Active 183 DOM
-
2026-05-31days on market $156,900 Active 182 DOM
-
2026-05-21price $1,600
-
2026-05-20price $156,900
-
2026-05-10status Active
-
2026-05-01historical
-
2026-04-09$1,800
-
2026-04-09historical $1,800
-
2026-03-25$1,800
-
2026-03-14historical $1,800
-
2026-01-01$1,800
-
2025-12-21historical $1,800
-
2025-12-18$1,800
-
2025-11-22historical $1,800
-
2025-11-20historical
-
2025-11-20$164,900 Active
-
2025-09-17$1,800
-
2025-07-29historical $1,700
-
2025-07-09$1,700
-
2024-11-18$164,900 Active
-
2004-07-20soldstatus $52,500
-
2001-08-30soldstatus $30,000
-
1974-01-01soldstatus $22,500
ⓘ Source: listings_history table (triggers on properties + properties_extension) + one-shot
backfill from property_details.listing_events for pre-trigger history.
Tax reassessment forecast FL · Resets to sale price
- Current annual tax
- $1,848 · $154/mo
- Projected year-2 tax
- $1,848 · $154/mo
- Expected delta
- $0/yr ($0/mo · -0.0%)
ⓘ Screening estimate from a state-policy table — verify with the county assessor before closing.
Climate risk First Street
- Flood 1/10 Low FEMA zone X (unshaded) · 0% chance over 30 yrs
- Wildfire 5/10 Major
- Heat 10/10 Extreme 7 d/yr ≥106°F today · 26 d/yr by 30 yrs out
- Wind 10/10 Extreme 99% chance of damaging wind over 30 yrs
- Air quality 2/10 Low 0 unhealthy d/yr today · 1 by 30 yrs out
Nearby sold comps map
Loading sold comps map…
Walkable amenities ~0.75 mi
Loading nearby amenities…
Taxation est. · year 1
- Rental income
- $22,115
- − Mortgage interest
- −$8,789
- − Property taxes
- −$1,848
- − Insurance
- −$784
- − Repairs & maintenance
- −$1,769
- − Management
- −$1,769
- − HOA
- −$5,724
- − Depreciation
- −$4,564
- Taxable loss
- −$3,133
- Est. tax savings @ 24.0%
- +$752
- After-tax cash flow
- $-7/yr
For passive investors: Depreciation is non-cash, so a rental often shows a tax loss while cash-flowing — sheltering income. Rental losses are passive: they offset passive income freely, and up to $25,000/yr can offset ordinary (W-2) income if you actively participate and your MAGI is under $100k (phasing out to $0 by $150k); unused losses carry forward. On sale, claimed depreciation is recaptured at up to 25%, and gains may owe capital-gains tax (a 1031 exchange can defer both). Figures are a year-1 estimate at your 24.0% rate — not tax advice; consult a CPA.
Schools (NCES district)
- District
- Palm Beach
- NCES district ID
- 1201500
- Math proficiency
- 46% ▼ -16.00%
- Reading proficiency
- 53% ▼ -4.00%
- Median HH income
- $53,943
- Composite
- 42.72/100
- National rank
- #3160
- State rank
- #34 of 73 in FL
Livability — West Palm Beach
- Score
- 82/100
- State rank
- #75
- US rank
- #1255
Category grades
Schools grade is shown separately in the Schools card above.
Census & demographics
- County
- Palm Beach County · 1,438,312 people
- City population
- 222,012
- Metro
- Miami-Fort Lauderdale-Pompano Beach, FL
- Population (ZIP)
- 76,863
- Household income
- $92,591
- Rent vs Own
- Severe rent burden
- 1870.0
Population outlook (Palm Beach County) Hauer SSP2
- Today (2025)
- 1,637,487 people
- By 2030
- 1,743,255 · +6.5%
- By 2040
- 1,948,712 · +19.0%
- By 2050
- 2,132,979 · +30.3%
- By 2075
- 2,530,027 · +54.5%
- By 2100
- 2,706,979 · +65.3%
Race, ethnicity, and origin ACS 2023
- Neighborhood character
- Diverse neighborhood (Simpson 0.70)
- Race & ethnicity
- White 44% Hispanic / Latino 24% Black 23% Two or more races 16% Asian 5%
- Hispanic origin (detail)
- Mexican 2% Puerto Rican 5% Cuban 4% Dominican 2%
- Common ancestry
- Hispanic 6% Romanian 2% Italian 1%
- Foreign-born
- 26% · Canada, Jamaica, China
- Languages at home
- 73% English-only · Spanish 17% French/Haitian/Cajun 4% Other Indo-European 2%
Political lean MEDSL · Palm Beach
- 2024 margin
- Toss-up / Even · D 50.0% · R 49.2%
- 2008→2024 swing
- -22.1pp toward R · 2008: 22.9pp · 2024: 0.8pp
- All cycles
- 2024: D+0.8 2020: D+12.8 2016: D+15.3 2012: D+17.0 2008: D+22.9
Not yet ingested
- Civics
- —
Market trends
- HPI YoY
- ▲ 17.04%
- Current HPI
- 903.78
- Rent YoY
- ▲ 0.85%
- Metro
- Miami-Fort Lauderdale-Pompano Beach, FL
- State GDP YoY
- ▲ 3.28%
- F500 in state
- 36
Industry mix (Fortune 500 HQ in FL)
| Industry | F500 HQs | Revenue |
|---|---|---|
| Industrial Technology | 2 | $29B |
|
||
| Insurance | 2 | $17B |
|
||
| Retail | 1 | $60B |
|
||
| Technology Distribution | 1 | $58B |
|
||
| Homebuilding | 1 | $35B |
|
||
| Technology Manufacturing | 1 | $35B |
|
||
Price history
-92.9% since first listed21 events — show timeline
- 2026-05-21 Price Changed $1,600 RMLSFL
- 2026-05-20 Price Changed $156,900 Beaches MLS
- 2026-05-10 Relisted — Beaches MLS
- 2026-05-01 Listing Removed — Beaches MLS
- 2026-04-09 Listed for Rent $1,800 RMLSFL
- 2026-04-09 Rental Removed $1,800 GFLMLS
- 2026-03-25 Listed for Rent $1,800 GFLMLS
- 2026-03-14 Rental Removed $1,800 GFLMLS
- 2026-01-01 Listed for Rent $1,800 GFLMLS
- 2025-12-21 Rental Removed $1,800 GFLMLS
- 2025-12-18 Listed for Rent $1,800 GFLMLS
- 2025-11-22 Rental Removed $1,800 GFLMLS
- 2025-11-20 Listing Removed — Beaches MLS
- 2025-11-20 Listed $164,900 Beaches MLS
- 2025-09-17 Listed for Rent $1,800 GFLMLS
- 2025-07-29 Rental Removed $1,700 RMLSFL
- 2025-07-09 Listed for Rent $1,700 RMLSFL
- 2024-11-18 Listed $164,900 Beaches MLS
- 2004-07-20 Sold (Public Records) $52,500 Public Records
- 2001-08-30 Sold (Public Records) $30,000 Public Records
- 1974-01-01 Sold (Public Records) $22,500 Public Records
Property tax history
+6.8%/yrLatest (2025): $1,848 · -0.8% YoY. Source: county tax records.
Cash-flow waterfall
monthlySold comps — $/sqft
last 12 mo · ≤1 miLoading sold comps…