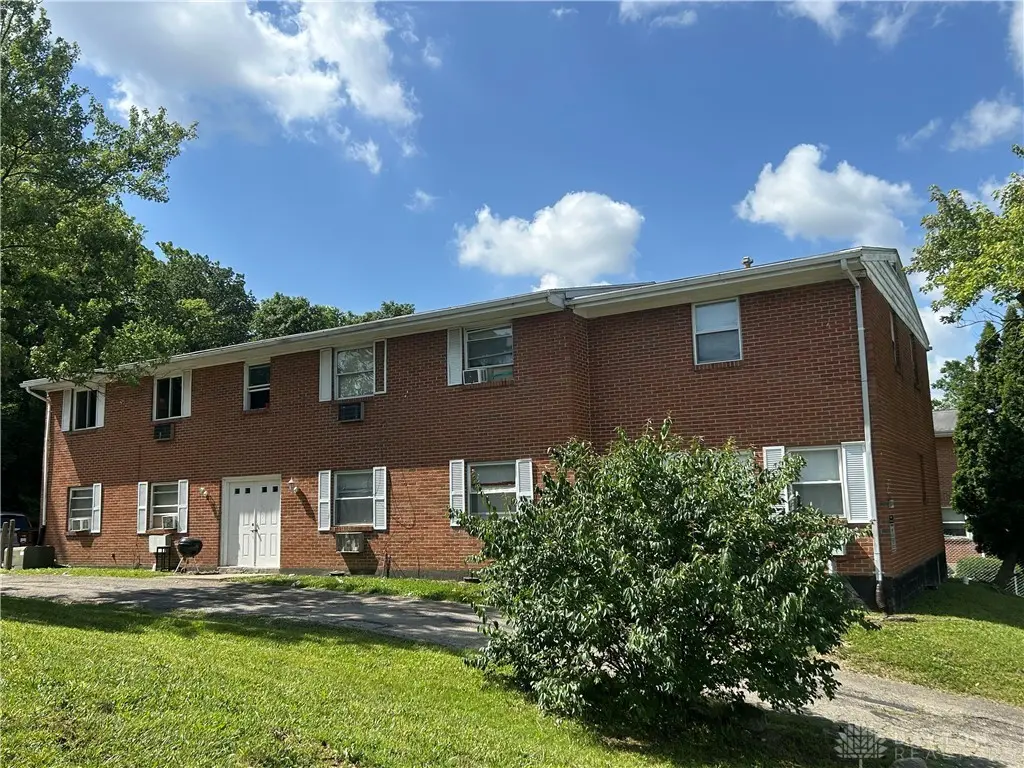
 5-Plex
4908 Northcutt Pl · Dayton, OH
Flood risk 1/10 · Minimal
- FEMA flood zone
- X (unshaded)
- Chance of flooding over 30 yrs
- 0.0%
- Est. flood insurance / yr
- $507 – $1,088
Fire risk 1/10 · Minimal
- Est. fire insurance / yr
- $713 – $1,323
Heat risk 3/10 · Minor
- Hot days now (above 104°F)
- 7 days/yr
- Hot days in 30 yrs
- 18 days/yr
Wind risk 2/10 · Minimal
- Chance of severe wind over 30 yrs
- 0.0%
Air-quality risk 3/10 · Minor
- Unhealthy air days now
- 2 days/yr
- Unhealthy air days in 30 yrs
- 4 days/yr
Risk factors via First Street. Map © Google.
Why this score? — see what drove the B grade
The composite is a weighted blend of 9 inputs, each scored 0–100. Each bar is that input's sub-score; the figure is the points it added to the 100-point composite (weight × sub-score).
- Cash flow +30.0/30.0
- 1% rule +10.0/10.0
- DSCR +10.0/10.0
- ARV discount +7.5/15.0
- Schools +5.0/10.0
- Rent growth +4.4/5.0
- Livability +3.2/5.0
- Condition / age +2.5/5.0
- Appreciation +0.0/10.0
$329,900
🖨 Deal sheet 📄 Offer letter ✓ Due diligence
Multi-family units
County records classify this as Multi-Family (5+ Unit). Listing-text estimate: 5 units. confirmed
5+ unit building — per-unit beds/baths from public records are typically unavailable; the breakdown below (if shown) is an estimate from the listing text.
Listing remarks
Great opportunity to own a well kept, fully residential 5 unit with all units offering two bedrooms each. Including one spacious townhouse unit. Tenants cover their own electric while the Owner is responsible for water and sewage, trash. Washer/Dryer Hookups in the hall. .
Key facts
- Washer dryer hookups
- 0.31 acre lot
- Built 1969
Tags
Property features AI
Finance
- Financial info: Offered for sale
Exterior
- Parking: No garage
- Utilities: Natural gas heating; Window unit cooling
- Home design: Brick construction; Two-story building; Single building on property
- Construction: Brick construction
- Exterior features: Commercially zoned lot
Interior
- Bedrooms: Two-bedroom unit type (multi-unit property with 5 units)
- Bathrooms: Five full bathrooms (total)
- Heating & cooling: Forced air heating (natural gas); Window unit cooling
- Interior features: Basement: Other
Neighborhood map
What this means for you Summary
Snapshot
- This is a 5 × 2-bed/1.0-bath units multifamily listed at $330k.
Deal economics
- At list price, monthly cash flow is $2k ($22k/yr) — positive. Per door: $362/mo.
- The deal already cash-flows at list — no discount required.
- Meets the 1% rule at list price ($5k rent vs $330k).
- Recommended offer: $290k (12.0% below list) — sets the bar for market timing.
- Cap rate 12.9% vs local median 7.4% in Dayton — top-decile yield for the area; either an underpriced asset or a hidden risk that comps aren't pricing in. Stress-test before assuming the spread holds.
Location & tenants
- Location reads 65/100 on livability (#716 in OH) — a middle-class / working-renter tenant base. Strengths: cost of living A+, housing A+, health & safety A; Watch: schools C-, amenities C-, crime F.
- Market conditions: Rents rising fast (+7.4%/yr); 51 active listings in the ZIP; 907 units permitted in Montgomery County in 2024 (416 in 5+ unit buildings).
- At $5,053/mo this rent would consume 111% of the median local household income ($54k/yr) (locally 801% of renters already pay >50% of income on rent) — very limited rent-growth headroom before tenants either downsize or default.
Forward outlook
- Local home prices are declining (-3.0%/yr); year-one equity from $2k of loan paydown is wiped out by about $10k of value loss. Plan a longer hold.
- Montgomery County population projected at -10% by 2050 — secular population decline; favor cash flow + early exit over multi-decade hold.
- At projected returns (-3.0% appreciation + 7.4% rent growth), your $92k cash investment doubles in ~5 years — after that, you're playing with house money.
Negotiation context
- It's been on market 230 days — a 12% lower offer ($290k) is reasonable based on typical stale-listing flexibility.
- 11 sale attempts since 18y ago; this cycle's ask is 37603% above the opening price — seller raised mid-cycle; expect resistance to lowballs.
- Current owner paid $85k; list at $330k implies a 288% gain — meaningful room to come down on a strong offer.
Questions for the listing agent
- It's been on market 230 days. Have you received any prior offers? Is the seller open to a 12% concession, seller financing, or rate buy-down credit?
- Can we see the unit-by-unit rent roll, current vacancy, and any below-market leases? What's the average tenancy length?
- What capital expenditures (roof, boiler, parking lot, exteriors) have been made in the last 5 years, and what's planned in the next 2?
- Built in 1969 — when were the roof, HVAC, electrical panel, plumbing, and water heater last replaced?
- Why hasn't it sold? Are there any deal-killer items the seller is aware of (foundation, flood, title, zoning, code violations)?
- Is there a deadline driving the sale (1031 exchange, divorce, estate, relocation)? That informs how much negotiation room exists.
- Crime grade is F in this area — have there been break-ins, vandalism, or insurance claims at this property in the last 3 years? What carrier currently insures it and at what premium?
- What's the average days-on-market for RENTAL listings here right now (not sales)? A rising rental-DOM trend means longer vacancies and softer asking-rent achievability than the comps imply.
- What's the recent tenant-quality profile in this submarket — average credit score on applications, eviction rate, late-payment / NSF rate, and stable-employment percentage? A property-management company in the area should have these aggregated.
- How much new apartment / multifamily construction is in the pipeline within 1–3 miles? Heavy new supply (>2% of stock underway) typically softens rents 12–24 months out; light construction supports rent growth.
Investment metrics
- 1% rule
- 1.53% ✓
- Cap rate
- 12.88%
- Cash-on-cash
- 23.51%
- DSCR
- 2.05
- GRM
- 5.4
CMA / ARV
No comps found within radius.
Projected returns pro-forma
-3.0% appreciation · 7.41% rent growth · sell at horizon
- IRR
- 21.4%
- Equity multiple
- 1.92×
- Total profit
- $85,234
- Equity at exit
- $49,189
- IRR
- 32.2%
- Equity multiple
- 4.55×
- Total profit
- $327,961
- Equity at exit
- $28,524
Cash invested: $92,372 (down + closing). Projections, not guarantees.
Landlord ↔ Tenant lean methodology
- Overall (STATE)
- 73 Landlord-Friendly
- State Ohio
- 73 Landlord-Friendly · R+6
- County
- — inherits STATE
- City
- — inherits STATE
ZIP-level market 45414
- Rents YoY
- 7.4%
- Active inventory
- 51
- Price-to-rent
- 27.2×
Monthly cashflow live
- Estimated rent
- $5,053 high interval (Pro) →
- Mortgage (P&I)
- −$1,730
- Tax from tax record
- −$315 /mo · $3,776/yr
- Insurance
- −$137
- HOA
- −$0
- Vacancy / Maint / Mgmt
- −$1,061
- Net cashflow
- $1,810
Break-even live
5-unit breakdown (identical units grouped — click to expand)
| Units | Beds | Baths | Est. rent |
|---|---|---|---|
| 5× units | 2 | 1 | $5,055 |
| #1 | 2 | 1 | $1,011 |
| #2 | 2 | 1 | $1,011 |
| #3 | 2 | 1 | $1,011 |
| #4 | 2 | 1 | $1,011 |
| #5 | 2 | 1 | $1,011 |
| Total (5 units) | $5,053 | ||
UW: 25.0% down · 7.5% · 30yr · 1.5% tax · 5.0% vac · 8.0% maint · 8.0% mgmt
Financing live
Cash to close
- Down payment
- $82,475
- Closing costs
- $9,897
- Reserves months
- —
- Total cash needed
- —
Loan-product check · same deal, 3 products live
Conventional
25% down · 7.5% · 30yr
- Down + closing
- —
- Monthly P&I
- —
- Monthly cashflow
- —
- DSCR
- —
- Eligible?
- —
Personal DTI + credit; lowest rate.
DSCR
20% down · 8.5% · 30yr
- Down + closing
- —
- Monthly P&I
- —
- Monthly cashflow
- —
- DSCR
- —
- Eligible?
- —
No personal income docs; deal must DSCR.
Hard money
10% down · 12.0% · 12mo
- Down + closing
- —
- Monthly P&I
- —
- Monthly cashflow
- —
- DSCR
- —
- Eligible?
- —
Short-term bridge; refi at stabilization.
Listing history 39 events
-
2026-06-18days on market $329,900 Active 230 DOM
-
2026-06-17days on market $329,900 Active 229 DOM
-
2026-06-16days on market $329,900 Active 228 DOM
-
2026-06-15days on market $329,900 Active 227 DOM
-
2026-06-14days on market $329,900 Active 225 DOM
-
2026-06-13days on market $329,900 Active 224 DOM
-
2026-06-10days on market $329,900 Active 222 DOM
-
2026-06-09days on market $329,900 Active 221 DOM
-
2026-06-08days on market $329,900 Active 220 DOM
-
2026-06-07days on market $329,900 Active 219 DOM
-
2026-06-03days on market $329,900 Active 215 DOM
-
2026-06-02days on market $329,900 Active 214 DOM
-
2026-06-01days on market $329,900 Active 213 DOM
-
2026-05-31days on market $329,900 Active 212 DOM
-
2026-04-09$875
-
2026-03-11status Active
-
2026-01-06historical ActiveUnderContract
-
2026-01-05status Active
-
2025-11-24historical ActiveUnderContract
-
2025-10-31$329,900 Active
-
2025-09-30historical
-
2025-07-09$329,900 Active
-
2019-11-25soldstatus $85,000
-
2016-11-04historical
-
2013-10-18historical
-
2013-04-13$119,900
-
2012-08-23historical
-
2012-05-02historical
-
2012-04-23$99,900
-
2011-12-03$99,900
-
2011-12-03$99,900
-
2010-12-31historical
-
2010-01-01$129,900
-
2010-01-01historical
-
2008-11-20$139,000
-
2001-06-22soldstatus $110,000
-
1997-07-18soldstatus $123,000
-
1989-10-23soldstatus $92,000
-
1989-10-23soldstatus $78,000
ⓘ Source: listings_history table (triggers on properties + properties_extension) + one-shot
backfill from property_details.listing_events for pre-trigger history.
Tax reassessment forecast OH · Partial reset (capped growth)
- Current annual tax
- $3,776 · $315/mo
- Projected year-2 tax
- $4,461 · $372/mo
- Expected delta
- +$685/yr (+$57/mo · 18.1%)
ⓘ Screening estimate from a state-policy table — verify with the county assessor before closing.
Climate risk First Street
- Flood 1/10 Low FEMA zone X (unshaded) · 0% chance over 30 yrs
- Wildfire 1/10 Low
- Heat 3/10 Moderate 7 d/yr ≥104°F today · 18 d/yr by 30 yrs out
- Wind 2/10 Low 0% chance of damaging wind over 30 yrs
- Air quality 3/10 Moderate 2 unhealthy d/yr today · 4 by 30 yrs out
Nearby sold comps map
Loading sold comps map…
Walkable amenities ~0.75 mi
Loading nearby amenities…
Taxation est. · year 1
- Rental income
- $60,636
- − Mortgage interest
- −$18,480
- − Property taxes
- −$3,776
- − Insurance
- −$1,650
- − Repairs & maintenance
- −$4,851
- − Management
- −$4,851
- − Depreciation
- −$9,597
- Taxable income
- $17,432
- Est. tax owed @ 24.0%
- −$4,184
- After-tax cash flow
- $17,533/yr
For passive investors: Depreciation is non-cash, so a rental often shows a tax loss while cash-flowing — sheltering income. Rental losses are passive: they offset passive income freely, and up to $25,000/yr can offset ordinary (W-2) income if you actively participate and your MAGI is under $100k (phasing out to $0 by $150k); unused losses carry forward. On sale, claimed depreciation is recaptured at up to 25%, and gains may owe capital-gains tax (a 1031 exchange can defer both). Figures are a year-1 estimate at your 24.0% rate — not tax advice; consult a CPA.
Schools (NCES district)
No district data.
Livability — Dayton
- Score
- 65/100
- State rank
- #716
- US rank
- #12895
Category grades
Schools grade is shown separately in the Schools card above.
Census & demographics
- Census place
- Dayton, OH
- County
- Montgomery County · 459,541 people
- City population
- 164,387
- Metro
- Dayton-Kettering, OH
- Population (ZIP)
- 21,167
- Household income
- $54,485
- Rent vs Own
- Severe rent burden
- 801.0
Population outlook (Montgomery County) Hauer SSP2
- Today (2025)
- 523,241 people
- By 2030
- 514,948 · -1.6%
- By 2040
- 493,378 · -5.7%
- By 2050
- 469,639 · -10.2%
- By 2075
- 418,360 · -20.0%
- By 2100
- 353,315 · -32.5%
Race, ethnicity, and origin ACS 2023
- Neighborhood character
- Predominantly White (75%)
- Race & ethnicity
- White 75% Black 15% Two or more races 6% Hispanic / Latino 4% Asian 1%
- Common ancestry
- Slovak 2% Romanian 2% Italian 2%
- Foreign-born
- 4% · Canada
- Languages at home
- 94% English-only · Spanish 2% Arabic 1% Tagalog/Filipino 1%
Political lean MEDSL · Montgomery
- 2024 margin
- Toss-up / Even · D 49.8% · R 49.3%
- 2008→2024 swing
- -5.8pp toward R · 2008: 6.2pp · 2024: 0.5pp
- All cycles
- 2024: D+0.5 2020: D+2.2 2016: R+1.2 2012: D+3.1 2008: D+6.2
Not yet ingested
- Civics
- —
Market trends
- HPI YoY
- ▼ -142.46%
- Current HPI
- 183.1124
- Rent YoY
- ▲ 7.41%
- Metro
- Dayton-Kettering, OH
- State GDP YoY
- ▲ 1.98%
- F500 in state
- 48
Industry mix (Fortune 500 HQ in OH)
| Industry | F500 HQs | Revenue |
|---|---|---|
| Insurance | 3 | $145B |
|
||
| Industrial Machinery | 3 | $49B |
|
||
| Financial Services | 3 | $24B |
|
||
| Consumer Goods | 2 | $93B |
|
||
| Aerospace / Defense | 2 | $47B |
|
||
| Utilities | 2 | $33B |
|
||
Price history
+258.6% since first listed25 events — show timeline
- 2026-04-09 Listed for Rent $875 SHOWMOJO
- 2026-03-11 Relisted — Dayton MLS
- 2026-01-06 Contingent — Dayton MLS
- 2026-01-05 Relisted — Dayton MLS
- 2025-11-24 Contingent — Dayton MLS
- 2025-10-31 Listed $329,900 Dayton MLS
- 2025-09-30 Listing Removed — Dayton MLS
- 2025-07-09 Listed $329,900 Dayton MLS
- 2019-11-25 Sold (Public Records) $85,000 Public Records
- 2016-11-04 Listing Removed — WRIST
- 2013-10-18 Listing Removed — Dayton MLS
- 2013-04-13 Listed $119,900 Dayton MLS
- 2012-08-23 Listing Removed — Dayton MLS
- 2012-05-02 Listing Removed — Dayton MLS
- 2012-04-23 Listed $99,900 Dayton MLS
- 2011-12-03 Listed $99,900 Dayton MLS
- 2011-12-03 Listed $99,900 WRIST
- 2010-12-31 Listing Removed — Dayton MLS
- 2010-01-01 Listing Removed — Dayton MLS
- 2010-01-01 Listed $129,900 Dayton MLS
- 2008-11-20 Listed $139,000 Dayton MLS
- 2001-06-22 Sold (Public Records) $110,000 Public Records
- 1997-07-18 Sold (Public Records) $123,000 Public Records
- 1989-10-23 Sold (Public Records) $78,000 Public Records
- 1989-10-23 Sold (Public Records) $92,000 Public Records
Property tax history
-1.0%/yrLatest (2025): $3,776 · -2.7% YoY. Source: county tax records.
Cash-flow waterfall
monthlySold comps — $/sqft
last 12 mo · ≤1 miLoading sold comps…