31600 Troy Rd · Newberry Springs, CA
Flood risk 1/10 · Minimal
- FEMA flood zone
- D
- Chance of flooding over 30 yrs
- 0.0%
- Est. flood insurance / yr
- $544 – $1,084
Fire risk 4/10 · Minor
- Est. fire insurance / yr
- $659 – $1,223
Heat risk 8/10 · Major
- Hot days now (above 107°F)
- 7 days/yr
- Hot days in 30 yrs
- 20 days/yr
Wind risk 1/10 · Minimal
- Chance of severe wind over 30 yrs
- —
Air-quality risk 6/10 · Moderate
- Unhealthy air days now
- 10 days/yr
- Unhealthy air days in 30 yrs
- 14 days/yr
Risk factors via First Street. Map © Google.
Why this score? — see what drove the A- grade
The composite is a weighted blend of 9 inputs, each scored 0–100. Each bar is that input's sub-score; the figure is the points it added to the 100-point composite (weight × sub-score).
- Cash flow +30.0/30.0
- ARV discount +15.0/15.0
- 1% rule +10.0/10.0
- DSCR +10.0/10.0
- Appreciation +5.0/10.0
- Schools +2.7/10.0
- Rent growth +2.5/5.0
- Livability +2.5/5.0
- Condition / age +2.5/5.0
$65,000
🖨 Deal sheet 📄 Offer letter ✓ Due diligence
Listing remarks MLS
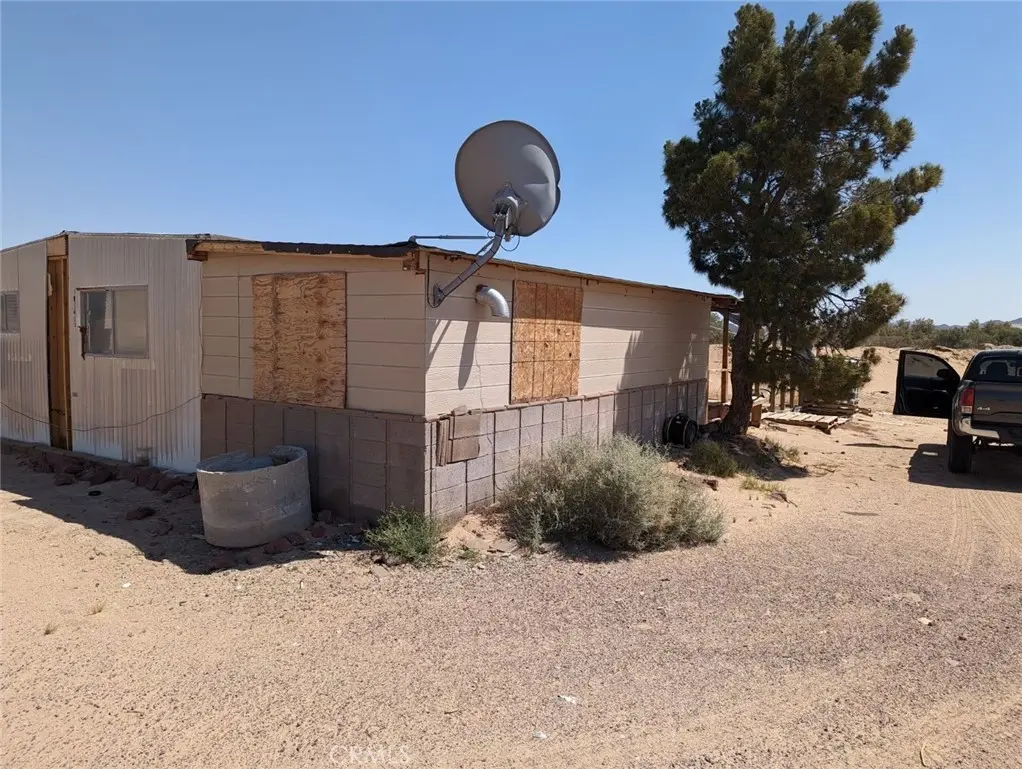
Your slice of paradise is ready and waiting with panoramic, unobstructed views. Experience off-grid living in a 3-bedroom, 1-bathroom mobile home on a spacious 30-acre lot. Utilities are available.
Key facts
- Off-grid living
- Panoramic views
- Spacious lot
Tags
Neighborhood map
What this means for you Summary
Snapshot
- This is a 3-bed/1.0-bath manufactured listed at $65k.
Deal economics
- At list price, monthly cash flow is $931 ($11k/yr) — positive.
- The deal already cash-flows at list — no discount required.
- Meets the 1% rule at list price ($2k rent vs $65k).
- Recommended offer: $57k (12.0% below list) — sets the bar for market timing.
Location & tenants
- Location reads: area grade A — affects rentability + tenant quality, not the cash-flow math above.
- Silver Valley Unified (town): math 23% / reading 39% proficiency, ranked #323 of 517 in CA (top 62%) — families likely to look elsewhere, expect single-tenant / working-renter base with shorter leases.
- Market conditions: 209 active listings in the ZIP; 5,458 units permitted in San Bernardino County in 2024 (1,500 in 5+ unit buildings).
Forward outlook
- In year one you build about $2k of equity ($449 loan paydown + $2k appreciation (3.0% local appreciation)).
- San Bernardino County population projected at +15% by 2050 — modest demand growth; plan on rents tracking national, not racing it.
- At projected returns (3.0% appreciation + 3.0% rent growth), your $18k cash investment doubles in ~2 years — after that, you're playing with house money.
Negotiation context
- It's been on market 353 days — a 12% lower offer ($57k) is reasonable based on typical stale-listing flexibility.
- 10 sale attempts since 20y ago; this cycle's ask has dropped $23k (26%) from the opening price — seller is motivated, your offer sets the floor, not the list.
Risks & watch-outs
- Climate carrying-cost: extreme-heat days projected 7→20/yr by 2055 (HVAC capex compounding) — expect insurance premiums to compound above CPI over the hold.
Questions for the listing agent
- It's been on market 353 days. Have you received any prior offers? Is the seller open to a 12% concession, seller financing, or rate buy-down credit?
- Built in 1971 — when were the roof, HVAC, electrical panel, plumbing, and water heater last replaced?
- Why hasn't it sold? Are there any deal-killer items the seller is aware of (foundation, flood, title, zoning, code violations)?
- Is there a deadline driving the sale (1031 exchange, divorce, estate, relocation)? That informs how much negotiation room exists.
- What's the average days-on-market for RENTAL listings here right now (not sales)? A rising rental-DOM trend means longer vacancies and softer asking-rent achievability than the comps imply.
- What's the recent tenant-quality profile in this submarket — average credit score on applications, eviction rate, late-payment / NSF rate, and stable-employment percentage? A property-management company in the area should have these aggregated.
- How much new for-sale + rental construction is in the pipeline within 1–3 miles? Heavy new supply typically softens prices + rents 12–24 months out; constrained supply supports both.
Investment metrics
- 1% rule
- 2.63% ✓
- Cap rate
- 23.48%
- Cash-on-cash
- 61.39%
- DSCR
- 3.73
- GRM
- 3.2
CMA / ARV
- ARV (median comp)
- $83,743
- List price
- $65,000
- Delta
- -22.38%
- Verdict
- UNDERPRICED
- Comps
- 1 within 2.0 mi
Projected returns pro-forma
3.0% appreciation · 3.0% rent growth · sell at horizon
- IRR
- 66.2%
- Equity multiple
- 4.69×
- Total profit
- $67,141
- Equity at exit
- $29,227
- IRR
- 65.7%
- Equity multiple
- 9.57×
- Total profit
- $155,928
- Equity at exit
- $45,042
Cash invested: $18,200 (down + closing). Projections, not guarantees.
Landlord ↔ Tenant lean methodology
- Overall (STATE)
- 18 Strongly Tenant-Friendly
- State California
- 18 Strongly Tenant-Friendly · D+13
- County
- — inherits STATE
- City
- — inherits STATE
ZIP-level market 92365
- Active inventory
- 209
- Price-to-rent
- 3.2×
Monthly cashflow live
- Estimated rent
- $1,712 medium interval (Pro) →
- Mortgage (P&I)
- −$341
- Tax from tax record
- −$54 /mo · $644/yr
- Insurance
- −$27
- HOA
- −$0
- Vacancy / Maint / Mgmt
- −$360
- Net cashflow
- $931
Break-even live
UW: 25.0% down · 7.5% · 30yr · 1.5% tax · 5.0% vac · 8.0% maint · 8.0% mgmt
Financing live
Cash to close
- Down payment
- $16,250
- Closing costs
- $1,950
- Reserves months
- —
- Total cash needed
- —
Loan-product check · same deal, 3 products live
Conventional
25% down · 7.5% · 30yr
- Down + closing
- —
- Monthly P&I
- —
- Monthly cashflow
- —
- DSCR
- —
- Eligible?
- —
Personal DTI + credit; lowest rate.
DSCR
20% down · 8.5% · 30yr
- Down + closing
- —
- Monthly P&I
- —
- Monthly cashflow
- —
- DSCR
- —
- Eligible?
- —
No personal income docs; deal must DSCR.
Hard money
10% down · 12.0% · 12mo
- Down + closing
- —
- Monthly P&I
- —
- Monthly cashflow
- —
- DSCR
- —
- Eligible?
- —
Short-term bridge; refi at stabilization.
Listing history 50 events
-
2026-06-18days on market $65,000 Active 353 DOM
-
2026-06-17pricedays on market $65,000 Active 352 DOM
-
2026-06-16days on market $79,900 Active 351 DOM
-
2026-06-15days on market $79,900 Active 350 DOM
-
2026-06-13days on market $79,900 Active 348 DOM
-
2026-06-13days on market $79,900 Active 347 DOM
-
2026-06-09days on market $79,900 Active 344 DOM
-
2026-06-08days on market $79,900 Active 343 DOM
-
2026-06-07days on market $79,900 Active 342 DOM
-
2026-06-04days on market $79,900 Active 339 DOM
-
2026-06-03days on market $79,900 Active 338 DOM
-
2026-06-02days on market $79,900 Active 337 DOM
-
2026-06-01days on market $79,900 Active 336 DOM
-
2026-05-31days on market $79,900 Active 335 DOM
-
2025-11-11price $79,900 197-char remark
Show marketing remark (197 chars)
Your slice of paradise is ready and waiting with panoramic, unobstructed views. Experience off-grid living in a 3-bedroom, 1-bathroom mobile home on a spacious 30-acre lot. Utilities are available.
-
2025-06-30$88,000 Active 197-char remark
Show marketing remark (197 chars)
Your slice of paradise is ready and waiting with panoramic, unobstructed views. Experience off-grid living in a 3-bedroom, 1-bathroom mobile home on a spacious 30-acre lot. Utilities are available.
-
2025-05-17historical
-
2025-05-17historical
-
2025-02-19price $99,000
-
2024-07-08price $134,900
-
2024-05-20$149,900 Active
-
2024-05-20$149,900 Active
-
2024-05-13historical
-
2023-11-03status Active
-
2023-11-03historical
-
2023-11-01historical
-
2023-11-01historical
-
2023-10-18price $168,000
-
2023-10-10price $188,000
-
2023-09-01price $212,000
-
2023-08-11price $229,000
-
2023-08-11$229,000 Active
-
2023-08-11historical
-
2023-07-12price $259,000
-
2023-06-14$299,000 Active
-
2023-06-14historical
-
2023-04-06price $299,000
-
2023-03-24price $339,000
-
2023-03-04price $349,000
-
2023-02-21price $359,000
-
2023-02-03price $379,000
-
2023-01-03status Active
-
2023-01-03$399,000
-
2023-01-03historical
-
2020-04-08soldstatus $62,000
-
2009-02-10historical
-
2008-08-29soldstatus $140,000
-
2008-01-13historical
-
2007-08-13$349,000
-
2006-10-03$495,000
ⓘ Source: listings_history table (triggers on properties + properties_extension) + one-shot
backfill from property_details.listing_events for pre-trigger history.
Tax reassessment forecast CA · Resets to sale price
- Current annual tax
- $644 · $54/mo
- Projected year-2 tax
- $644 · $54/mo
- Expected delta
- $0/yr ($0/mo · 0.0%)
ⓘ Screening estimate from a state-policy table — verify with the county assessor before closing.
Climate risk First Street
- Flood 1/10 Low FEMA zone D · 0% chance over 30 yrs
- Wildfire 4/10 Moderate
- Heat 8/10 Severe 7 d/yr ≥107°F today · 20 d/yr by 30 yrs out
- Wind 1/10 Low
- Air quality 6/10 Major 10 unhealthy d/yr today · 14 by 30 yrs out
Nearby sold comps map
Loading sold comps map…
Walkable amenities ~0.75 mi
Loading nearby amenities…
Taxation est. · year 1
- Rental income
- $20,547
- − Mortgage interest
- −$3,641
- − Property taxes
- −$644
- − Insurance
- −$325
- − Repairs & maintenance
- −$1,644
- − Management
- −$1,644
- − Depreciation
- −$1,891
- Taxable income
- $10,759
- Est. tax owed @ 24.0%
- −$2,582
- After-tax cash flow
- $8,591/yr
For passive investors: Depreciation is non-cash, so a rental often shows a tax loss while cash-flowing — sheltering income. Rental losses are passive: they offset passive income freely, and up to $25,000/yr can offset ordinary (W-2) income if you actively participate and your MAGI is under $100k (phasing out to $0 by $150k); unused losses carry forward. On sale, claimed depreciation is recaptured at up to 25%, and gains may owe capital-gains tax (a 1031 exchange can defer both). Figures are a year-1 estimate at your 24.0% rate — not tax advice; consult a CPA.
Schools (NCES district)
- District
- Silver Valley Unified
- NCES district ID
- 0636820
- Math proficiency
- 23% ▼ -12.00%
- Reading proficiency
- 39% ▼ -12.00%
- Median HH income
- $48,754
- Composite
- 26.85/100
- National rank
- #7105
- State rank
- #323 of 517 in CA
Livability — Newberry Springs
No livability data for this city. (Only ~50 U.S. cities are tracked.)
Census & demographics
- Population (ZIP)
- 2,514
Population outlook (San Bernardino County) Hauer SSP2
- Today (2025)
- 2,300,329 people
- By 2030
- 2,378,907 · +3.4%
- By 2040
- 2,523,137 · +9.7%
- By 2050
- 2,642,388 · +14.9%
- By 2075
- 2,880,769 · +25.2%
- By 2100
- 2,909,436 · +26.5%
Race, ethnicity, and origin ACS 2023
- Neighborhood character
- Diverse neighborhood (Simpson 0.60)
- Race & ethnicity
- White 56% Hispanic / Latino 29% Two or more races 20% Asian 8% Black 2%
- Hispanic origin (detail)
- Mexican 14% Dominican 7%
- Common ancestry
- Romanian 5% Slovak 2% Serbian 2%
- Foreign-born
- 16% · Canada, Vietnam
- Languages at home
- 85% English-only · Spanish 8% Vietnamese 2% German/W. Germanic 2%
Political lean MEDSL · San Bernardino
- 2024 margin
- Toss-up / Even · D 47.5% · R 49.7% · Other 2.8%
- 2008→2024 swing
- -8.5pp toward R · 2008: 6.3pp · 2024: -2.1pp
- All cycles
- 2024: R+2.1 2020: D+10.7 2016: D+9.8 2012: D+5.4 2008: D+6.3
Not yet ingested
- Civics
- —
Market trends
- HPI YoY
- —
- Current HPI
- —
- Rent YoY
- —
- Metro
- —
- State GDP YoY
- ▲ 3.21%
- F500 in state
- 116
Industry mix (Fortune 500 HQ in CA)
| Industry | F500 HQs | Revenue |
|---|---|---|
| Technology | 27 | $1,492B |
|
||
| Financial Services | 3 | $174B |
|
||
| Retail | 3 | $44B |
|
||
| Insurance | 3 | $26B |
|
||
| Media / Entertainment | 2 | $115B |
|
||
| Pharmaceuticals / Biotech | 2 | $62B |
|
||
Price history
-30.5% since first listed38 events — show timeline
- 2025-11-11 Price Changed $79,900 CRMLS
- 2025-06-30 Listed $88,000 CRMLS
- 2025-05-17 Listing Removed — CRMLS
- 2025-05-17 Listing Removed — CRMLS
- 2025-02-19 Price Changed $99,000 CRMLS
- 2024-07-08 Price Changed $134,900 CRMLS
- 2024-05-20 Listed $149,900 CRMLS
- 2024-05-20 Listed $149,900 CRMLS
- 2024-05-13 Listing Removed — CRMLS
- 2023-11-03 Relisted — CRMLS
- 2023-11-03 Listing Removed — CRMLS
- 2023-11-01 Coming Soon — CRMLS
- 2023-11-01 Listing Removed — CRMLS
- 2023-10-18 Price Changed $168,000 CRMLS
- 2023-10-10 Price Changed $188,000 CRMLS
- 2023-09-01 Price Changed $212,000 CRMLS
- 2023-08-11 Price Changed $229,000 CRMLS
- 2023-08-11 Listing Removed — CRMLS
- 2023-08-11 Listed $229,000 CRMLS
- 2023-07-12 Price Changed $259,000 CRMLS
- 2023-06-14 Listing Removed — CRMLS
- 2023-06-14 Listed $299,000 CRMLS
- 2023-04-06 Price Changed $299,000 CRMLS
- 2023-03-24 Price Changed $339,000 CRMLS
- 2023-03-04 Price Changed $349,000 CRMLS
- 2023-02-21 Price Changed $359,000 CRMLS
- 2023-02-03 Price Changed $379,000 CRMLS
- 2023-01-03 Relisted — CRMLS
- 2023-01-03 Listing Removed — CRMLS
- 2023-01-03 Listed $399,000 CRMLS
- 2020-04-08 Sold (Public Records) $62,000 Public Records
- 2009-02-10 Listing Removed — CRMLS
- 2008-08-29 Sold (Public Records) $140,000 Public Records
- 2008-01-13 Listing Removed — CRMLS
- 2007-08-13 Listed $349,000 CRMLS
- 2006-10-03 Listed $495,000 CRMLS
- 2005-09-02 Sold (Public Records) $115,000 Public Records
- 2005-09-02 Sold (MLS) $115,000 CRMLS
Property tax history
-4.7%/yrLatest (2025): $644 · +1.7% YoY. Source: county tax records.
Cash-flow waterfall
monthlySold comps — $/sqft
last 12 mo · ≤1 miLoading sold comps…