945 Valleywood Trl · Holly Lake Ranch, TX
Flood risk 1/10 · Minimal
- FEMA flood zone
- X (unshaded)
- Chance of flooding over 30 yrs
- 0.0%
- Est. flood insurance / yr
- $507 – $1,088
Fire risk 4/10 · Minor
- Est. fire insurance / yr
- $1,222 – $2,270
Heat risk 6/10 · Moderate
- Hot days now (above 110°F)
- 7 days/yr
- Hot days in 30 yrs
- 23 days/yr
Wind risk 6/10 · Moderate
- Chance of severe wind over 30 yrs
- 44.0%
Air-quality risk 2/10 · Minimal
- Unhealthy air days now
- 1 days/yr
- Unhealthy air days in 30 yrs
- 1 days/yr
Risk factors via First Street. Map © Google.
Why this score? — see what drove the D- grade
The composite is a weighted blend of 9 inputs, each scored 0–100. Each bar is that input's sub-score; the figure is the points it added to the 100-point composite (weight × sub-score).
- Cash flow +8.1/30.0
- ARV discount +7.5/15.0
- Appreciation +6.5/10.0
- Schools +3.6/10.0
- 1% rule +3.4/10.0
- Livability +3.3/5.0
- Rent growth +2.5/5.0
- Condition / age +2.5/5.0
- DSCR +2.1/10.0
$199,000
🖨 Deal sheet 📄 Offer letter ✓ Due diligence
Listing remarks MLS
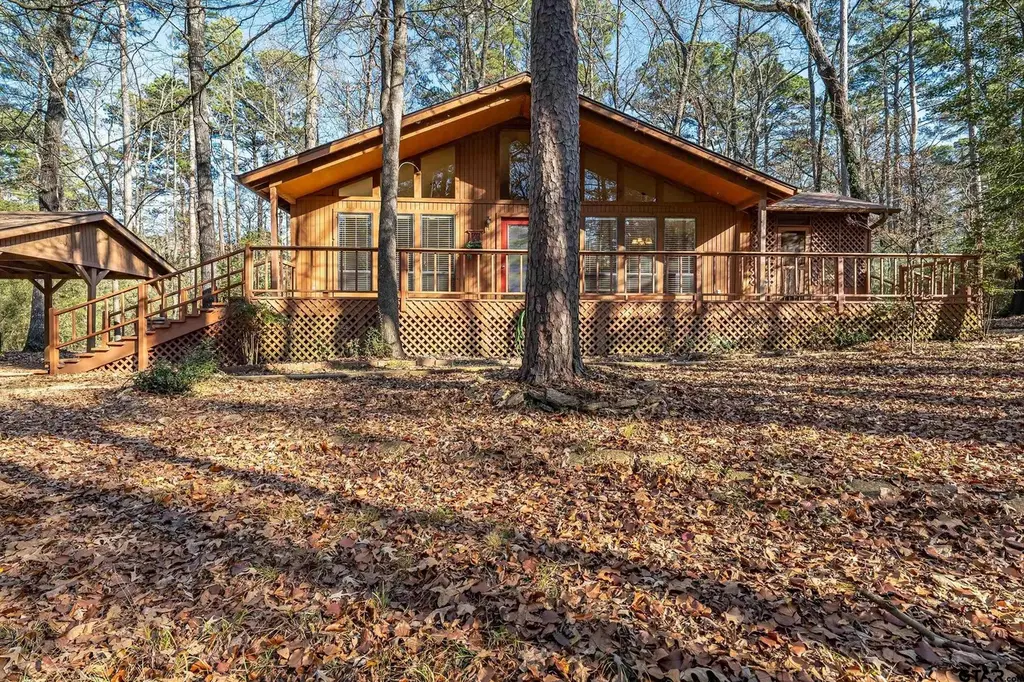
2 Bed/2 Bath/2car-port/1224 SF cottage in the peaceful woods of Section 6 in Holly Lake Ranch. This home has been well maintained and highlights include walk-in closets in both bedrooms, both bedrooms oversized with sitting areas, a 14x12 screened porch that can easily be converted to an additional living area and a mammoth 60x10 deck across the front. PLUS 2 storage sheds and a greenhouse. Holly Lake Ranch is a gated community with many amenities including 24x7 security, golf course, tennis & pickleball courts, dog parks, 2 lakes for fishing/boating, 2 dog parks, on-site restaurant and more.
Key facts
- Gated community
- Walk-in closets
- 60x10 deck
Tags
Neighborhood map
What this means for you Summary
Snapshot
- This is a 2-bed/1.0-bath single-family listed at $199k.
Deal economics
- At list price, monthly cash flow is $-198 ($-2k/yr) — negative.
- To cash-flow at today's rent, offer at most $164k (17.6% below list).
- To meet the 1% rule (rent ≥ 1% of price), the offer needs to be $168k (15.5% below list).
- Recommended offer: $164k (17.6% below list) — sets the bar for cash-flow.
- Cap rate 5.1% vs local median 3.8% in Holly Lake Ranch — top-decile yield for the area; either an underpriced asset or a hidden risk that comps aren't pricing in. Stress-test before assuming the spread holds.
Location & tenants
- Location reads 66/100 on livability (#597 in TX) — a middle-class / working-renter tenant base. Strengths: crime A+, cost of living A+, housing A+; Watch: schools D-, amenities F, commute F.
- Hawkins ISD (rural): math 42% / reading 43% proficiency, ranked #339 of 826 in TX (top 41%) — families likely to look elsewhere, expect single-tenant / working-renter base with shorter leases.
- Market conditions: 216 active listings in the ZIP; 72 units permitted in Wood County in 2024 (29 in 5+ unit buildings).
Forward outlook
- In year one you build about $8k of equity ($1k loan paydown + $6k appreciation (3.1% local appreciation)).
- Wood County population projected at +12% by 2050 — modest demand growth; plan on rents tracking national, not racing it.
- By year 5, paydown + projected appreciation supports a ~$33k cash-out refi (75% LTV) — recoverable capital for the next deal without selling this one.
Negotiation context
- It's been on market 164 days — a 12% lower offer ($175k) is reasonable based on typical stale-listing flexibility.
Risks & watch-outs
- Climate carrying-cost: major wind risk, 44% chance of damaging wind over 30y; extreme-heat days projected 7→23/yr by 2055 (HVAC capex compounding) — expect insurance premiums to compound above CPI over the hold.
Questions for the listing agent
- What do current leases actually rent for vs. the listed asking? Can we see a recent rent roll and the last 12 months of T-12 income?
- It's been on market 164 days. Have you received any prior offers? Is the seller open to a 18% concession, seller financing, or rate buy-down credit?
- What does the HOA fee cover, when was the last increase, and are there any pending special assessments or reserve-fund shortfalls?
- Why hasn't it sold? Are there any deal-killer items the seller is aware of (foundation, flood, title, zoning, code violations)?
- Is there a deadline driving the sale (1031 exchange, divorce, estate, relocation)? That informs how much negotiation room exists.
- Schools are D-rated, which usually means shorter tenancies and higher turnover. Who's the typical renter profile here, and what's been the actual vacancy rate?
- The area grade is low — what's the realistic commute time and amenity access for the typical tenant pool here? Any planned neighborhood developments (good or bad) we should know about?
- What's the average days-on-market for RENTAL listings here right now (not sales)? A rising rental-DOM trend means longer vacancies and softer asking-rent achievability than the comps imply.
- What's the recent tenant-quality profile in this submarket — average credit score on applications, eviction rate, late-payment / NSF rate, and stable-employment percentage? A property-management company in the area should have these aggregated.
- How much new for-sale + rental construction is in the pipeline within 1–3 miles? Heavy new supply typically softens prices + rents 12–24 months out; constrained supply supports both.
Investment metrics
- 1% rule
- 0.84% ✗
- Cap rate
- 5.10%
- Cash-on-cash
- -4.26%
- DSCR
- 0.81
- GRM
- 9.9
CMA / ARV
- ARV (median comp)
- $198,864
- List price
- $199,000
- Delta
- 0.07%
- Verdict
- FAIR
- Comps
- 16 within 1.0 mi
Show comp detail 5 sales within ~0.75 mi
| Address | Dist | Beds/Ba | Sqft | Sold | Price | $/sf | Match |
|---|---|---|---|---|---|---|---|
| 192 Drifting Cloud | 0.39mi | 2/2.0 | 1,250 (+2%) | 14mo | $225,000 | $180 | 63 |
| 121 Candlelight Cv | 0.42mi | 2/2.0 | 1,106 (-10%) | 2mo | $176,900 | $160 | 58 |
| 177 Woodfern Gln | 0.63mi | 2/2.0 | 1,106 (-10%) | 8mo | $182,000 | $165 | 44 |
| 1796 Valleywood Trl | 0.65mi | 2/3.0 | 1,238 (+1%) | 23mo | $219,500 | $177 | 41 |
| 135 Woodfern Gln | 0.61mi | 2/2.0 | 1,340 (+10%) | 18mo | $304,000 | $227 | 37 |
Match score weights: distance 35% · size 25% · config 20% · recency 20%. Top-matched comps best support the ARV.
Projected returns pro-forma
3.1% appreciation · 3.0% rent growth · sell at horizon
- IRR
- 3.9%
- Equity multiple
- 1.22×
- Total profit
- $12,504
- Equity at exit
- $90,562
- IRR
- 7.1%
- Equity multiple
- 2.10×
- Total profit
- $61,112
- Equity at exit
- $140,414
Cash invested: $55,720 (down + closing). Projections, not guarantees.
Landlord ↔ Tenant lean methodology
- Overall (STATE)
- 87 Strongly Landlord-Friendly
- State Texas
- 87 Strongly Landlord-Friendly · R+5
- County
- — inherits STATE
- City
- — inherits STATE
ZIP-level market 75765
- Home prices YoY
- 1.3%
- Active inventory
- 216
- Price-to-rent
- 9.9×
Monthly cashflow live
- Estimated rent
- $1,681 medium interval (Pro) →
- Mortgage (P&I)
- −$1,044
- Tax from tax record
- −$217 /mo · $2,606/yr
- Insurance
- −$83
- HOA
- −$182
- Vacancy / Maint / Mgmt
- −$353
- Net cashflow
- $-198
Break-even live
UW: 25.0% down · 7.5% · 30yr · 1.5% tax · 5.0% vac · 8.0% maint · 8.0% mgmt
Financing live
Cash to close
- Down payment
- $49,750
- Closing costs
- $5,970
- Reserves months
- —
- Total cash needed
- —
Loan-product check · same deal, 3 products live
Conventional
25% down · 7.5% · 30yr
- Down + closing
- —
- Monthly P&I
- —
- Monthly cashflow
- —
- DSCR
- —
- Eligible?
- —
Personal DTI + credit; lowest rate.
DSCR
20% down · 8.5% · 30yr
- Down + closing
- —
- Monthly P&I
- —
- Monthly cashflow
- —
- DSCR
- —
- Eligible?
- —
No personal income docs; deal must DSCR.
Hard money
10% down · 12.0% · 12mo
- Down + closing
- —
- Monthly P&I
- —
- Monthly cashflow
- —
- DSCR
- —
- Eligible?
- —
Short-term bridge; refi at stabilization.
HOA detail
- Monthly dues
- $182 · $2,184/yr
- Likely covers
- security
Listing history 19 events
-
2026-06-19days on market $199,000 Active 164 DOM
-
2026-06-18days on market $199,000 Active 163 DOM
-
2026-06-17days on market $199,000 Active 162 DOM
-
2026-06-16days on market $199,000 Active 161 DOM
-
2026-06-15days on market $199,000 Active 160 DOM
-
2026-06-14days on market $199,000 Active 158 DOM
-
2026-06-13days on market $199,000 Active 157 DOM
-
2026-06-10days on market $199,000 Active 155 DOM
-
2026-06-09days on market $199,000 Active 154 DOM
-
2026-06-08days on market $199,000 Active 153 DOM
-
2026-06-07days on market $199,000 Active 152 DOM
-
2026-06-05days on market $199,000 Active 149 DOM
-
2026-06-03days on market $199,000 Active 148 DOM
-
2026-06-02days on market $199,000 Active 147 DOM
-
2026-06-01days on market $199,000 Active 146 DOM
-
2026-05-31days on market $199,000 Active 145 DOM
-
2026-05-30days on market $199,000 Active 144 DOM
-
2026-01-06$199,000 Active 605-char remark
Show marketing remark (605 chars)
2 Bed/2 Bath/2car-port/1224 SF cottage in the peaceful woods of Section 6 in Holly Lake Ranch. This home has been well maintained and highlights include walk-in closets in both bedrooms, both bedrooms oversized with sitting areas, a 14x12 screened porch that can easily be converted to an additional living area and a mammoth 60x10 deck across the front. PLUS 2 storage sheds and a greenhouse. Holly Lake Ranch is a gated community with many amenities including 24x7 security, golf course, tennis & pickleball courts, dog parks, 2 lakes for fishing/boating, 2 dog parks, on-site restaurant and more.
-
2000-12-07soldstatus
ⓘ Source: listings_history table (triggers on properties + properties_extension) + one-shot
backfill from property_details.listing_events for pre-trigger history.
Tax reassessment forecast TX · Resets to sale price
- Current annual tax
- $2,606 · $217/mo
- Projected year-2 tax
- $3,642 · $303/mo
- Expected delta
- +$1,036/yr (+$86/mo · 39.8%)
ⓘ Screening estimate from a state-policy table — verify with the county assessor before closing.
Climate risk First Street
- Flood 1/10 Low FEMA zone X (unshaded) · 0% chance over 30 yrs
- Wildfire 4/10 Moderate
- Heat 6/10 Major 7 d/yr ≥110°F today · 23 d/yr by 30 yrs out
- Wind 6/10 Major 44% chance of damaging wind over 30 yrs
- Air quality 2/10 Low 1 unhealthy d/yr today · 1 by 30 yrs out
Nearby sold comps map
Loading sold comps map…
Walkable amenities ~0.75 mi
Loading nearby amenities…
Taxation est. · year 1
- Rental income
- $20,168
- − Mortgage interest
- −$11,147
- − Property taxes
- −$2,606
- − Insurance
- −$995
- − Repairs & maintenance
- −$1,613
- − Management
- −$1,613
- − HOA
- −$2,184
- − Depreciation
- −$5,789
- Taxable loss
- −$5,780
- Est. tax savings @ 24.0%
- +$1,387
- After-tax cash flow
- $-988/yr
For passive investors: Depreciation is non-cash, so a rental often shows a tax loss while cash-flowing — sheltering income. Rental losses are passive: they offset passive income freely, and up to $25,000/yr can offset ordinary (W-2) income if you actively participate and your MAGI is under $100k (phasing out to $0 by $150k); unused losses carry forward. On sale, claimed depreciation is recaptured at up to 25%, and gains may owe capital-gains tax (a 1031 exchange can defer both). Figures are a year-1 estimate at your 24.0% rate — not tax advice; consult a CPA.
Schools (NCES district)
- District
- Hawkins ISD
- NCES district ID
- 4822770
- Math proficiency
- 42% ▼ -12.00%
- Reading proficiency
- 43% ▼ -6.00%
- Median HH income
- $43,119
- Composite
- 35.91/100
- National rank
- #4809
- State rank
- #339 of 826 in TX
Livability — Holly Lake Ranch
- Score
- 66/100
- State rank
- #597
- US rank
- #11377
Category grades
Schools grade is shown separately in the Schools card above.
Census & demographics
- Census place
- Holly Lake Ranch, TX
- Population (ZIP)
- 8,195
Population outlook (Wood County) Hauer SSP2
- Today (2025)
- 46,480 people
- By 2030
- 47,796 · +2.8%
- By 2040
- 50,142 · +7.9%
- By 2050
- 52,122 · +12.1%
- By 2075
- 57,033 · +22.7%
- By 2100
- 56,418 · +21.4%
Race, ethnicity, and origin ACS 2023
- Neighborhood character
- Predominantly White (79%)
- Race & ethnicity
- White 79% Black 12% Hispanic / Latino 6% Two or more races 5%
- Hispanic origin (detail)
- Mexican 5%
- Common ancestry
- Lithuanian 2% Slovak 2% Serbian 1%
- Foreign-born
- 1% · Canada
- Languages at home
- 95% English-only · Spanish 4%
Political lean MEDSL · Wood
- 2024 margin
- Solid R (+69.7) · D 14.8% · R 84.6%
- 2008→2024 swing
- -15.5pp toward R · 2008: -54.2pp · 2024: -69.7pp
- All cycles
- 2024: R+69.7 2020: R+68.2 2016: R+70.0 2012: R+64.2 2008: R+54.2
Not yet ingested
- Civics
- —
Market trends
- HPI YoY
- ▲ 3.10%
- Current HPI
- 236.7688
- Rent YoY
- —
- Metro
- —
- State GDP YoY
- ▲ 3.95%
- F500 in state
- 110
Industry mix (Fortune 500 HQ in TX)
| Industry | F500 HQs | Revenue |
|---|---|---|
| Energy | 16 | $1,198B |
|
||
| Technology | 5 | $198B |
|
||
| Engineering / Construction | 4 | $72B |
|
||
| Energy Services | 3 | $60B |
|
||
| Utilities | 3 | $41B |
|
||
| Healthcare | 2 | $330B |
|
||
Price history
2 events — show timeline
- 2026-01-06 Listed $199,000 GTAR
- 2000-12-07 Sold (Public Records) — Public Records
Property tax history
+4.3%/yrLatest (2025): $2,606 · +10.0% YoY. Source: county tax records.
Cash-flow waterfall
monthlySold comps — $/sqft
last 12 mo · ≤1 miLoading sold comps…