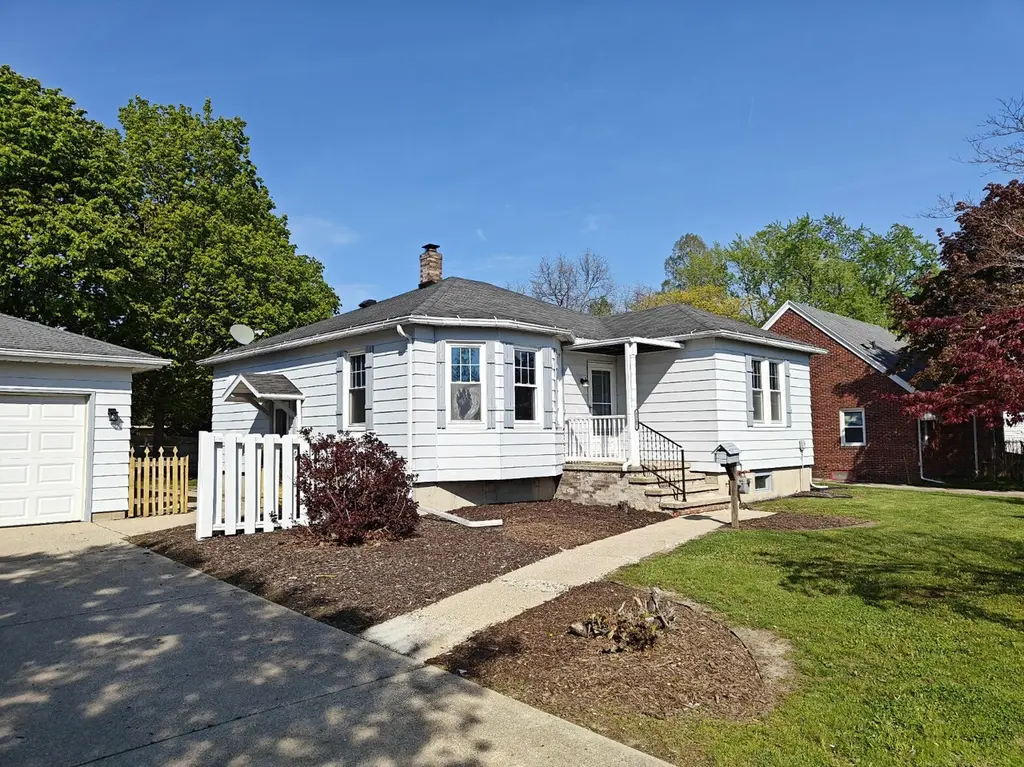
1207 Napier Ave · St. Joseph, MI
Flood risk 1/10 · Minimal
- FEMA flood zone
- X (unshaded)
- Chance of flooding over 30 yrs
- 0.0%
- Est. flood insurance / yr
- $473 – $860
Fire risk 1/10 · Minimal
- Est. fire insurance / yr
- $784 – $1,456
Heat risk 2/10 · Minimal
- Hot days now (above 100°F)
- 7 days/yr
- Hot days in 30 yrs
- 14 days/yr
Wind risk 2/10 · Minimal
- Chance of severe wind over 30 yrs
- —
Air-quality risk 5/10 · Moderate
- Unhealthy air days now
- 8 days/yr
- Unhealthy air days in 30 yrs
- 8 days/yr
Risk factors via First Street. Map © Google.
Why this score? — see what drove the C grade
The composite is a weighted blend of 9 inputs, each scored 0–100. Each bar is that input's sub-score; the figure is the points it added to the 100-point composite (weight × sub-score).
- Cash flow +21.0/30.0
- ARV discount +12.2/15.0
- DSCR +6.7/10.0
- 1% rule +5.6/10.0
- Schools +5.1/10.0
- Livability +2.5/5.0
- Condition / age +2.5/5.0
- Rent growth +2.4/5.0
- Appreciation +0.0/10.0
$265,000
🖨 Deal sheet (PDF) 📄 Offer letter ✓ Due diligence
Listing remarks MLS
Charming, clean, and move-in ready! Close to all that St. Joseph has to offer - downtown, beaches, shopping, and the hospital. Don't miss this opportunity to own a four-bedroom, two-bath home in the St. Joseph School District. Very private backyard with storage shed/garage and screened-in porch. Eat-in kitchen, large living room with amazing natural light, as well as a spacious living/recreation area in the basement. Two-car detached garage and concrete driveway are also featured on this updated home. This is a Fannie Mae HomePath Property.
Key facts
- Screened in porch
- Private backyard
- Spacious living area
Tags
Property features AI
Exterior
- Parking: Detached 2-car garage
- Utilities: Public water
- Home design: Single-family residence; Residential property
- Construction: Built in 1948; Aluminum siding; Composition roof
- Exterior features: Sidewalk; Paved road access
Interior
- Kitchen: Kitchen (10 x 18)
- Bedrooms: Primary bedroom (13 x 13); Bedroom 2 (13 x 13); Bedroom 3 (12 x 12); Bedroom 4 (11 x 12)
- Bathrooms: Two full bathrooms
- Heating & cooling: Forced air heating; Has cooling
- Interior features: Garage door opener; Pantry; Screens; Insulated windows; Full basement; Five total rooms
- Laundry & utility: Dedicated laundry room (13 x 15)
Neighborhood map
What this means for you Summary
Snapshot
- This is a 4-bed/2.0-bath single-family listed at $265k.
Deal economics
- At list price, monthly cash flow is $372 ($4k/yr) — positive.
- The deal already cash-flows at list — no discount required.
- Meets the 1% rule at list price ($3k rent vs $265k).
- Recommended offer: $261k (1.5% below list) — sets the bar for market timing.
- Cap rate 8.0% vs local median 3.0% in St. Joseph — top-decile yield for the area; either an underpriced asset or a hidden risk that comps aren't pricing in. Stress-test before assuming the spread holds.
Location & tenants
- Location reads: area grade C — affects rentability + tenant quality, not the cash-flow math above.
- St. Joseph Public Schools (suburban): math 53% / reading 64% proficiency, ranked #47 of 540 in MI (top 9%) — acceptable for families but not a draw, mixed tenant base, ~2y average lease; only 18% free/reduced lunch — higher-income household profile.
- Zoned schools: Lincoln School (math 42% / reading 62%, grade C-, #328 of 1,397 statewide, top 26%, 421 students, 34% FRL); Upton Middle School (math 56% / reading 65%, grade B+, #51 of 493 statewide, top 11%, 665 students, 30% FRL); St Joseph High School (math 52% / reading 69%, grade C+, #70 of 713 statewide, top 10%, 988 students, 26% FRL).
- Market conditions: Rents soft (-0.2%/yr); 228 active listings in the ZIP; 3 comparable units currently listed for rent nearby; rentals lingering (median 46d on market — plan ~5-8 weeks vacancy on turnover, expect pricing pressure); 100% of comp listings sitting > 30 days — soft ceiling on asking rent; solid renter incomes; 397 units permitted in Berrien County in 2024 (40 in 5+ unit buildings).
- This rent runs 32% of the median local income ($105k/yr) — at the standard rent-burdened threshold; future hikes will face affordability resistance.
Forward outlook
- Local home prices are declining (-3.0%/yr); year-one equity from $2k of loan paydown is wiped out by about $8k of value loss. Plan a longer hold.
- Berrien County population projected at -16% by 2050 — secular population decline; favor cash flow + early exit over multi-decade hold.
Negotiation context
- It's been on market 20 days — a 2% lower offer ($261k) is reasonable based on typical stale-listing flexibility.
- 12 sale attempts since 22y ago with the ask held roughly flat each time — persistent listings suggest the price (not the market) is what's stuck; bring a comps-based counter.
- Current owner paid $199k; 33% above their basis — modest negotiation headroom, anchor on the comps not their cost.
Risks & watch-outs
- Watch-outs: built in 1948 — expect roof / HVAC / electrical / plumbing capex.
Questions for the listing agent
- Built in 1948 — when were the roof, HVAC, electrical panel, plumbing, and water heater last replaced?
- Is there a deadline driving the sale (1031 exchange, divorce, estate, relocation)? That informs how much negotiation room exists.
- What's the average days-on-market for RENTAL listings here right now (not sales)? A rising rental-DOM trend means longer vacancies and softer asking-rent achievability than the comps imply.
- What's the recent tenant-quality profile in this submarket — average credit score on applications, eviction rate, late-payment / NSF rate, and stable-employment percentage? A property-management company in the area should have these aggregated.
- How much new for-sale + rental construction is in the pipeline within 1–3 miles? Heavy new supply typically softens prices + rents 12–24 months out; constrained supply supports both.
Investment metrics
- 1% rule
- 1.06% ✓
- Cap rate
- 7.98%
- Cash-on-cash
- 6.01%
- DSCR
- 1.27
- GRM
- 7.9
CMA / ARV
- ARV (median comp)
- $295,927
- List price
- $265,000
- Delta
- -10.45%
- Verdict
- UNDERPRICED
- Comps
- 20 within 1.0 mi
Show comp detail 12 sales within ~0.75 mi
| Address | Dist | Beds/Ba | Sqft | Sold | Price | $/sf | Match |
|---|---|---|---|---|---|---|---|
| 2311 Bryan St | 0.12mi | 4/2.0 | 1,853 (+1%) | 2mo | $360,000 | $194 | 90 |
| 911 Napier Ave | 0.17mi | 4/2.0 | 1,896 (+4%) | 5mo | $242,237 | $128 | 82 |
| 2817 Willa Dr | 0.50mi | 3/2.0 (-1) | 1,859 (+2%) | 8mo | $290,000 | $156 | 62 |
| 1518 Forres Ave | 0.75mi | 4/2.0 | 1,847 (+1%) | 3mo | $494,000 | $267 | 61 |
| 1209 Mohawk Ln | 0.37mi | 5/2.0 (+1) | 2,000 (+9%) | 3mo | $374,900 | $187 | 59 |
| 523 Howard Ave | 0.74mi | 4/3.0 | 1,862 (+2%) | 7mo | $425,000 | $228 | 52 |
| 828 Wolcott Ave | 0.60mi | 3/1.5 (-1) | 1,722 (-6%) | 7mo | $310,000 | $180 | 50 |
| 2800 Thayer Dr | 0.43mi | 3/1.5 (-1) | 1,610 (-12%) | 8mo | $294,500 | $183 | 46 |
| 1311 Wolcott Ave | 0.56mi | 4/2.0 | 1,553 (-15%) | 5mo | $250,000 | $161 | 45 |
| 2620 Botham Ct | 0.60mi | 3/2.0 (-1) | 1,576 (-14%) | 1mo | $265,000 | $168 | 43 |
| 513 N Ottawa Rd | 0.63mi | 3/2.5 (-1) | 2,070 (+13%) | 7mo | $197,500 | $95 | 36 |
| 1295 Pontiac Rd | 0.71mi | 3/1.0 (-1) | 1,587 (-13%) | 3mo | $250,000 | $158 | 34 |
Match score weights: distance 35% · size 25% · config 20% · recency 20%. Top-matched comps best support the ARV.
Projected returns pro-forma
-3.0% appreciation · 0.0% rent growth · sell at horizon
- IRR
- -10.5%
- Equity multiple
- 0.63×
- Total profit
- $-27,445
- Equity at exit
- $39,512
- IRR
- -6.0%
- Equity multiple
- 0.66×
- Total profit
- $-25,003
- Equity at exit
- $22,912
Cash invested: $74,200 (down + closing). Projections, not guarantees.
Landlord ↔ Tenant lean methodology
- Overall (STATE)
- 62 Landlord-Friendly
- State Michigan
- 62 Landlord-Friendly · EVEN
- County
- — inherits STATE
- City
- — inherits STATE
ZIP-level market 49085
- Rents YoY
- -0.2%
- Active inventory
- 228
- Price-to-rent
- 7.9×
Monthly cashflow live
- Estimated rent
- $2,807 medium interval (Pro) →
- Mortgage (P&I)
- −$1,390
- Tax from tax record
- −$346 /mo · $4,153/yr
- Insurance
- −$110
- HOA
- −$0
- Vacancy / Maint / Mgmt
- −$590
- Net cashflow
- $372
Break-even live
Sensitivity live
| Price | -10% $522 | -5% $447 | +0% $372 | +5% $297 | +10% $222 |
|---|---|---|---|---|---|
| Rent | -10% $150 | -5% $261 | +0% $372 | +5% $483 | +10% $593 |
| Rate | -1.0pp $505 | -0.5pp $439 | base $372 | +0.5pp $303 | +1.0pp $233 |
UW: 25.0% down · 7.5% · 30yr · 1.5% tax · 5.0% vac · 8.0% maint · 8.0% mgmt
Financing live
Cash to close
- Down payment
- $66,250
- Closing costs
- $7,950
- Reserves months
- —
- Total cash needed
- —
Loan-product check · same deal, 3 products live
Conventional
25% down · 7.5% · 30yr
- Down + closing
- —
- Monthly P&I
- —
- Monthly cashflow
- —
- DSCR
- —
- Eligible?
- —
Personal DTI + credit; lowest rate.
DSCR
20% down · 8.5% · 30yr
- Down + closing
- —
- Monthly P&I
- —
- Monthly cashflow
- —
- DSCR
- —
- Eligible?
- —
No personal income docs; deal must DSCR.
Hard money
10% down · 12.0% · 12mo
- Down + closing
- —
- Monthly P&I
- —
- Monthly cashflow
- —
- DSCR
- —
- Eligible?
- —
Short-term bridge; refi at stabilization.
Rent comps 3 comps
| Address | Beds | Baths | Sqft | Rent | $/sqft | DOM | Units | Dist |
|---|---|---|---|---|---|---|---|---|
| 1319 Lewis Ave Saint Joseph, MI | 4.0 | 3.0 | 2280 | $2,970 | $1.30 | 45d | 1 | 0.48mi |
| 916 Broad St St Joseph, MI | 3.0 | 1.5 | 1900 | $2,650 | $1.39 | 45d | 1 | 1.08mi |
| 187 Wayne St #13 Saint Joseph, MI | 3.0 | 2.0 | 1500 | $2,900 | $1.93 | 45d | 1 | 1.18mi |
Listing history 30 events
-
2026-06-01statusdays on market $265,000 Pending 20 DOM
Show marketing remark (546 chars)
Charming, clean, and move-in ready! Close to all that St. Joseph has to offer - downtown, beaches, shopping, and the hospital. Don't miss this opportunity to own a four-bedroom, two-bath home in the St. Joseph School District. Very private backyard with storage shed/garage and screened-in porch. Eat-in kitchen, large living room with amazing natural light, as well as a spacious living/recreation area in the basement. Two-car detached garage and concrete driveway are also featured on this updated home. This is a Fannie Mae HomePath Property.
-
2026-05-31days on market $265,000 Active 19 DOM
-
2026-05-30days on market $265,000 Active 18 DOM
-
2026-05-11$265,000 Active 548-char remark
Show marketing remark (546 chars)
Charming, clean, and move-in ready! Close to all that St. Joseph has to offer - downtown, beaches, shopping, and the hospital. Don't miss this opportunity to own a four-bedroom, two-bath home in the St. Joseph School District. Very private backyard with storage shed/garage and screened-in porch. Eat-in kitchen, large living room with amazing natural light, as well as a spacious living/recreation area in the basement. Two-car detached garage and concrete driveway are also featured on this updated home. This is a Fannie Mae HomePath Property.
-
2026-05-11$265,000 Active 546-char remark
Show marketing remark (546 chars)
Charming, clean, and move-in ready! Close to all that St. Joseph has to offer - downtown, beaches, shopping, and the hospital. Don't miss this opportunity to own a four-bedroom, two-bath home in the St. Joseph School District. Very private backyard with storage shed/garage and screened-in porch. Eat-in kitchen, large living room with amazing natural light, as well as a spacious living/recreation area in the basement. Two-car detached garage and concrete driveway are also featured on this updated home. This is a Fannie Mae HomePath Property.
-
2026-05-11$265,000 Active
Show marketing remark (546 chars)
Charming, clean, and move-in ready! Close to all that St. Joseph has to offer - downtown, beaches, shopping, and the hospital. Don't miss this opportunity to own a four-bedroom, two-bath home in the St. Joseph School District. Very private backyard with storage shed/garage and screened-in porch. Eat-in kitchen, large living room with amazing natural light, as well as a spacious living/recreation area in the basement. Two-car detached garage and concrete driveway are also featured on this updated home. This is a Fannie Mae HomePath Property.
-
2021-05-17soldstatus $199,000
-
2021-05-07soldstatus $199,000 Sold
-
2021-05-07soldstatus $199,000 Sold
-
2021-05-06status Pending
-
2021-05-06status Pending
-
2021-03-10historical Contingent - Continue To Show
-
2021-03-10historical Active Backup
-
2021-03-02$199,000 Active
-
2021-03-02$199,000 Active
-
2021-03-02$199,000
-
2018-06-05soldstatus $172,000
-
2018-06-01soldstatus $172,000
-
2018-06-01soldstatus $172,000 Sold
-
2018-05-24status Pending
-
2018-04-23historical Active Backup
-
2018-04-09status Active
-
2018-03-30historical Active Backup
-
2018-03-06$169,000 Active
-
2018-03-03$169,000
-
2018-03-03$169,000
-
2004-06-04soldstatus $109,900
-
2004-06-04soldstatus $109,900
-
2004-03-01$109,900
-
2004-03-01$109,900
ⓘ Source: listings_history table (triggers on properties + properties_extension) + one-shot
backfill from property_details.listing_events for pre-trigger history.
Tax reassessment forecast MI · Partial reset (capped growth)
- Current annual tax
- $4,153 · $346/mo
- Projected year-2 tax
- $4,153 · $346/mo
- Expected delta
- $0/yr ($0/mo · 0.0%)
ⓘ Screening estimate from a state-policy table — verify with the county assessor before closing.
Climate risk First Street
- Flood 1/10 Low FEMA zone X (unshaded) · 0% chance over 30 yrs
- Wildfire 1/10 Low
- Heat 2/10 Low 7 d/yr ≥100°F today · 14 d/yr by 30 yrs out
- Wind 2/10 Low
- Air quality 5/10 Major 8 unhealthy d/yr today · 8 by 30 yrs out
Nearby sold comps map
Loading sold comps map…
Walkable amenities ~0.75 mi
Loading nearby amenities…
Taxation est. · year 1
- Rental income
- $33,689
- − Mortgage interest
- −$14,844
- − Property taxes
- −$4,153
- − Insurance
- −$1,325
- − Repairs & maintenance
- −$2,695
- − Management
- −$2,695
- − Depreciation
- −$7,709
- Taxable income
- $268
- Est. tax owed @ 24.0%
- −$64
- After-tax cash flow
- $4,396/yr
For passive investors: Depreciation is non-cash, so a rental often shows a tax loss while cash-flowing — sheltering income. Rental losses are passive: they offset passive income freely, and up to $25,000/yr can offset ordinary (W-2) income if you actively participate and your MAGI is under $100k (phasing out to $0 by $150k); unused losses carry forward. On sale, claimed depreciation is recaptured at up to 25%, and gains may owe capital-gains tax (a 1031 exchange can defer both). Figures are a year-1 estimate at your 24.0% rate — not tax advice; consult a CPA.
Schools (NCES district)
- District
- St. Joseph Public Schools
- NCES district ID
- 2632850
- Math proficiency
- 53% ▼ -12.00%
- Reading proficiency
- 64% ▼ -8.00%
- Median HH income
- $61,232
- Composite
- 50.87/100
- National rank
- #1795
- State rank
- #47 of 540 in MI
Livability — St. Joseph
No livability data for this city. (Only ~50 U.S. cities are tracked.)
Census & demographics
- Census place
- St. Joseph, MI
- County
- Berrien County · 71,477 people
- Metro
- Niles, MI
- Population (ZIP)
- 23,827
- Household income
- $104,969
- Rent vs Own
- Severe rent burden
- 277.0
Population outlook (Berrien County) Hauer SSP2
- Today (2025)
- 149,273 people
- By 2030
- 145,211 · -2.7%
- By 2040
- 135,435 · -9.3%
- By 2050
- 125,543 · -15.9%
- By 2075
- 103,986 · -30.3%
- By 2100
- 82,256 · -44.9%
Race, ethnicity, and origin ACS 2023
- Neighborhood character
- Predominantly White (85%)
- Race & ethnicity
- White 85% Two or more races 6% Asian 4% Hispanic / Latino 3% Black 3%
- Common ancestry
- Romanian 6% Iranian 4% Italian 4%
- Foreign-born
- 8% · Canada, China
- Languages at home
- 91% English-only · Other Indo-European 5% Spanish 1% Chinese 1%
Political lean MEDSL · Berrien
- 2024 margin
- Lean R (+7.9) · D 45.4% · R 53.2% · Other 1.4%
- 2008→2024 swing
- -13.3pp toward R · 2008: 5.5pp · 2024: -7.9pp
- All cycles
- 2024: R+7.9 2020: R+7.4 2016: R+12.7 2012: R+6.6 2008: D+5.5
Not yet ingested
- Civics
- —
Market trends
- HPI YoY
- ▼ -332.72%
- Current HPI
- 207.2281
- Rent YoY
- ▼ -0.24%
- Metro
- Niles, MI
- State GDP YoY
- ▲ 1.37%
- F500 in state
- 28
Industry mix (Fortune 500 HQ in MI)
| Industry | F500 HQs | Revenue |
|---|---|---|
| Automotive Parts | 3 | $48B |
|
||
| Automotive | 2 | $372B |
|
||
| Chemicals | 1 | $45B |
|
||
| Automotive Retail | 1 | $29B |
|
||
| Healthcare / Medical Devices | 1 | $23B |
|
||
| Automotive Technology | 1 | $20B |
|
||
Price history
+141.1% since first listed30 events — show timeline
- 2026-06-01 Pending — REALCOMP
- 2026-06-01 Pending — MiRealSource-MiMLS
- 2026-06-01 Pending — SW Michigan MLS
- 2026-05-11 Listed $265,000 SW Michigan MLS
- 2026-05-11 Listed $265,000 MiRealSource-MiMLS
- 2026-05-11 Listed $265,000 REALCOMP
- 2021-05-17 Sold (Public Records) $199,000 Public Records
- 2021-05-07 Sold (MLS) $199,000 SW Michigan MLS
- 2021-05-07 Sold (MLS) $199,000 REALCOMP
- 2021-05-06 Pending — REALCOMP
- 2021-05-06 Pending — SW Michigan MLS
- 2021-03-10 Contingent — REALCOMP
- 2021-03-10 Contingent — SW Michigan MLS
- 2021-03-02 Listed $199,000 MiRealSource-MiMLS
- 2021-03-02 Listed $199,000 SW Michigan MLS
- 2021-03-02 Listed $199,000 REALCOMP
- 2018-06-05 Sold (Public Records) $172,000 Public Records
- 2018-06-01 Sold (MLS) $172,000 SW Michigan MLS
- 2018-06-01 Sold (MLS) $172,000 REALCOMP
- 2018-05-24 Pending — SW Michigan MLS
- 2018-04-23 Contingent — SW Michigan MLS
- 2018-04-09 Relisted — SW Michigan MLS
- 2018-03-30 Contingent — SW Michigan MLS
- 2018-03-06 Listed $169,000 SW Michigan MLS
- 2018-03-03 Listed $169,000 MiRealSource-MiMLS
- 2018-03-03 Listed $169,000 REALCOMP
- 2004-06-04 Sold (MLS) $109,900 REALCOMP
- 2004-06-04 Sold (MLS) $109,900 SW Michigan MLS
- 2004-03-01 Listed $109,900 REALCOMP
- 2004-03-01 Listed $109,900 SW Michigan MLS
Property tax history
+13.6%/yrLatest (2024): $4,153 · -11.8% YoY. Source: county tax records.
Cash-flow waterfall
monthlySold comps — $/sqft
last 12 mo · ≤1 miLoading sold comps…