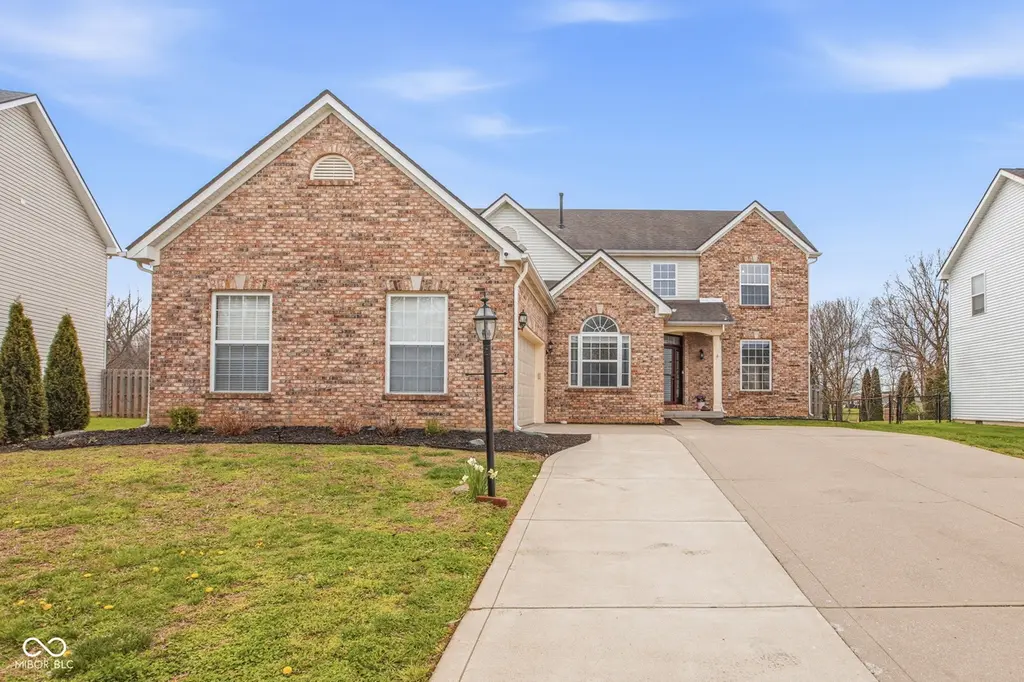
13985 Royalwood Dr · Fishers, IN
Flood risk 1/10 · Minimal
- FEMA flood zone
- X (unshaded)
- Chance of flooding over 30 yrs
- 0.0%
- Est. flood insurance / yr
- $473 – $860
Fire risk 1/10 · Minimal
- Est. fire insurance / yr
- $717 – $1,331
Heat risk 3/10 · Minor
- Hot days now (above 101°F)
- 7 days/yr
- Hot days in 30 yrs
- 18 days/yr
Wind risk 2/10 · Minimal
- Chance of severe wind over 30 yrs
- 0.0%
Air-quality risk 2/10 · Minimal
- Unhealthy air days now
- 2 days/yr
- Unhealthy air days in 30 yrs
- 2 days/yr
Risk factors via First Street. Map © Google.
Why this score? — see what drove the F grade
The composite is a weighted blend of 9 inputs, each scored 0–100. Each bar is that input's sub-score; the figure is the points it added to the 100-point composite (weight × sub-score).
- ARV discount +7.6/15.0
- Schools +5.3/10.0
- Rent growth +4.2/5.0
- Livability +4.2/5.0
- Cash flow +4.1/30.0
- Condition / age +2.5/5.0
- 1% rule +0.0/10.0
- DSCR +0.0/10.0
- Appreciation +0.0/10.0
$509,900
🖨 Deal sheet (PDF) 📄 Offer letter ✓ Due diligence
Listing remarks
Beautifully updated home in the heart of Fishers! This 4-bedroom, 2.5-bath home with a finished basement offers a spacious layout and thoughtful upgrades throughout. A large two-story foyer welcomes you inside, while fresh paint throughout, all-new carpet, and luxury vinyl flooring create a bright, modern feel. The main level features a private office with French doors and built-in bookshelves, along with a comfortable living space perfect for relaxing or entertaining. The fully updated custom kitchen is a standout feature, offering stainless steel appliances and a seamless flow into the great room with soaring 10-foot ceilings and a cozy gas fireplace. Step outside to the patio overlooking
Key facts
- Custom kitchen
- Private office
- Primary bathroom
Tags
Property features AI
Finance
- Other: Lot about 0.33 acre
- HOA & community: HOA with quarterly fee (approximately $125); HOA includes entrance/common area, insurance, nature area, park/playground; Association amenities: insurance, park, playground, pool; HOA governed by covenants & restrictions
Exterior
- Parking: Attached garage with keyless entry and service door; 2 garage spaces (garage approx. 735 sq ft)
- Utilities: Public water; Municipal sewer connected
- Home design: Single family residence; Updated/remodeled condition; Two levels
- Construction: Vinyl with brick exterior; Concrete perimeter foundation
- Exterior features: Covered patio; Patio; Full yard fence; Sidewalks; Mature trees
Interior
- Kitchen: Dishwasher; Gas oven; Range hood; Refrigerator; Disposal
- Bedrooms: 4 upstairs bedrooms; Office on main level
- Flooring: Luxury vinyl plank
- Bathrooms: 2 full bathrooms (upper); 1 half bathroom (main)
- Heating & cooling: Forced air heating; Central air conditioning
- Interior features: Breakfast bar; Built-in features; Pantry; Walk-in closet(s); Painted woodwork
- Laundry & utility: Gas water heater
Neighborhood map
What this means for you Summary
Snapshot
- This is a 3-bed/2.5-bath single-family listed at $510k.
Deal economics
- At list price, monthly cash flow is $-1k ($-17k/yr) — negative.
- To cash-flow at today's rent, offer at most $264k (48.3% below list).
- To meet the 1% rule (rent ≥ 1% of price), the offer needs to be $240k (53.0% below list).
- Recommended offer: $240k (53.0% below list) — sets the bar for 1% rule.
Location & tenants
- Location reads 83/100 on livability (#11 in IN, #898 nationally) — a professional / high-income tenant draw. Strengths: crime A+, amenities A+, employment A+; Watch: commute F.
- Hamilton Southeastern Schools (suburban): math 57% / reading 59% proficiency, ranked #14 of 301 in IN (top 5%) — acceptable for families but not a draw, mixed tenant base, ~2y average lease; only 10% free/reduced lunch — higher-income household profile.
- Zoned schools: Fall Creek Elementary School (math 81% / reading 63%, grade A-, #31 of 994 statewide, top 3%, 475 students, 12% FRL); Fall Creek Junior High (math 50% / reading 64%, grade B, #21 of 330 statewide, top 6%, 1,002 students, 14% FRL); Hamilton Southeastern Hs (math 66% / reading 85%, grade A-, #7 of 369 statewide, top 2%, 3,450 students, 15% FRL) — zoned schools at 14% FRL track the district average.
- Market conditions: Rents rising fast (+6.7%/yr); 329 active listings in the ZIP; 1 comparable units currently listed for rent nearby; high-income renter base; 4,661 units permitted in Hamilton County in 2024 (1,528 in 5+ unit buildings).
Forward outlook
- Local home prices are declining (-3.0%/yr); year-one equity from $4k of loan paydown is wiped out by about $15k of value loss. Plan a longer hold.
- Hamilton County population projected at +44% by 2050 — long-run rental-demand tailwind backs the buy-and-hold thesis.
Negotiation context
- Only 10 days on market — expect competitive offers; lowballing is unlikely to land.
- 10 sale attempts since 24y ago with the ask held roughly flat each time — persistent listings suggest the price (not the market) is what's stuck; bring a comps-based counter.
- Current owner paid $313k; list at $510k implies a 63% gain — meaningful room to come down on a strong offer.
Questions for the listing agent
- What do current leases actually rent for vs. the listed asking? Can we see a recent rent roll and the last 12 months of T-12 income?
- What does the HOA fee cover, when was the last increase, and are there any pending special assessments or reserve-fund shortfalls?
- Is there a deadline driving the sale (1031 exchange, divorce, estate, relocation)? That informs how much negotiation room exists.
- Schools are A-rated — typically a magnet for longer-tenancy family renters. What's the average tenant stay here, and is there a school-zone premium baked into asking?
- The area grade is low — what's the realistic commute time and amenity access for the typical tenant pool here? Any planned neighborhood developments (good or bad) we should know about?
- What's the average days-on-market for RENTAL listings here right now (not sales)? A rising rental-DOM trend means longer vacancies and softer asking-rent achievability than the comps imply.
- What's the recent tenant-quality profile in this submarket — average credit score on applications, eviction rate, late-payment / NSF rate, and stable-employment percentage? A property-management company in the area should have these aggregated.
- How much new for-sale + rental construction is in the pipeline within 1–3 miles? Heavy new supply typically softens prices + rents 12–24 months out; constrained supply supports both.
Investment metrics
- 1% rule
- 0.47% ✗
- Cap rate
- 3.01%
- Cash-on-cash
- -11.72%
- DSCR
- 0.48
- GRM
- 17.7
CMA / ARV
- ARV (on-the-fly)
- $511,368
- Comps found
- 12
Show comp detail 12 sales within ~0.75 mi
| Address | Dist | Beds/Ba | Sqft | Sold | Price | $/sf | Match |
|---|---|---|---|---|---|---|---|
| 13985 Royalwood Dr | 0.00mi | 4/2.5 (+1) | 3,920 (+10%) | 1mo | $515,000 | $131 | 78 |
| 14098 Stonewood Pl | 0.36mi | 4/3.0 (+1) | 3,735 (+4%) | 2mo | $431,000 | $115 | 68 |
| 14459 Stanley Ter | 0.51mi | 4/3.5 (+1) | 3,584 (+0%) | 2mo | $522,000 | $146 | 66 |
| 14211 Monarchy Ln | 0.21mi | 4/3.5 (+1) | 3,909 (+9%) | 2mo | $580,000 | $148 | 64 |
| 11750 Gatwick View Dr | 0.40mi | 4/3.5 (+1) | 3,436 (-4%) | 18mo | $485,000 | $141 | 51 |
| 11789 Langham Crescent Ct | 0.37mi | 4/2.5 (+1) | 3,238 (-10%) | 13mo | $485,000 | $150 | 51 |
| 13495 Millen Dr | 0.61mi | 4/3.5 (+1) | 3,576 (0%) | 17mo | $570,000 | $159 | 48 |
| 14446 Chapelwood Ln | 0.58mi | 4/3.5 (+1) | 3,258 (-9%) | 1mo | $430,000 | $132 | 48 |
| 11875 Sloane Muse | 0.42mi | 4/3.0 (+1) | 3,142 (-12%) | 15mo | $449,900 | $143 | 40 |
| 12035 Gatwick View Dr | 0.63mi | 4/2.5 (+1) | 3,852 (+8%) | 16mo | $465,500 | $121 | 39 |
| 12034 Gatwick View Dr | 0.61mi | 4/2.5 (+1) | 3,116 (-13%) | 9mo | $436,000 | $140 | 38 |
| 12178 Eddington Pl | 0.66mi | 4/3.5 (+1) | 3,228 (-10%) | 16mo | $465,000 | $144 | 31 |
Match score weights: distance 35% · size 25% · config 20% · recency 20%. Top-matched comps best support the ARV.
Projected returns pro-forma
-3.0% appreciation · 6.71% rent growth · sell at horizon
- IRR
- -34.4%
- Equity multiple
- -0.14×
- Total profit
- $-162,243
- Equity at exit
- $76,028
- IRR
- -28.7%
- Equity multiple
- -0.51×
- Total profit
- $-214,959
- Equity at exit
- $44,087
Cash invested: $142,772 (down + closing). Projections, not guarantees.
Landlord ↔ Tenant lean methodology
- Overall (STATE)
- 90 Strongly Landlord-Friendly
- State Indiana
- 90 Strongly Landlord-Friendly · R+11
- County
- — inherits STATE
- City
- — inherits STATE
ZIP-level market 46037
- Home prices YoY
- -18.6%
- Rents YoY
- 6.7%
- Active inventory
- 329
- Price-to-rent
- 17.7×
Monthly cashflow live
- Estimated rent
- $2,396 medium interval (Pro) →
- Mortgage (P&I)
- −$2,674
- Tax from tax record
- −$358 /mo · $4,299/yr
- Insurance
- −$212
- HOA
- −$42
- Vacancy / Maint / Mgmt
- −$503
- Net cashflow
- $-1,394
Break-even live
Sensitivity live
| Price | -10% $-1,105 | -5% $-1,250 | +0% $-1,394 | +5% $-1,538 | +10% $-1,683 |
|---|---|---|---|---|---|
| Rent | -10% $-1,583 | -5% $-1,489 | +0% $-1,394 | +5% $-1,299 | +10% $-1,205 |
| Rate | -1.0pp $-1,137 | -0.5pp $-1,264 | base $-1,394 | +0.5pp $-1,526 | +1.0pp $-1,661 |
UW: 25.0% down · 7.5% · 30yr · 1.5% tax · 5.0% vac · 8.0% maint · 8.0% mgmt
Financing live
Cash to close
- Down payment
- $127,475
- Closing costs
- $15,297
- Reserves months
- —
- Total cash needed
- —
Loan-product check · same deal, 3 products live
Conventional
25% down · 7.5% · 30yr
- Down + closing
- —
- Monthly P&I
- —
- Monthly cashflow
- —
- DSCR
- —
- Eligible?
- —
Personal DTI + credit; lowest rate.
DSCR
20% down · 8.5% · 30yr
- Down + closing
- —
- Monthly P&I
- —
- Monthly cashflow
- —
- DSCR
- —
- Eligible?
- —
No personal income docs; deal must DSCR.
Hard money
10% down · 12.0% · 12mo
- Down + closing
- —
- Monthly P&I
- —
- Monthly cashflow
- —
- DSCR
- —
- Eligible?
- —
Short-term bridge; refi at stabilization.
Rent comps 1 comps
| Address | Beds | Baths | Sqft | Rent | $/sqft | DOM | Units | Dist |
|---|---|---|---|---|---|---|---|---|
| 11263 Hearthstone Dr Fishers, IN | 4.0 | 3.0 | 3056 | $2,591 | $0.85 | 14d | 1 | 1.22mi |
HOA detail
- Monthly dues
- $42 · $504/yr
- Likely covers
- gas
Listing history 28 events
-
2026-04-30status Pending
-
2026-04-30price $509,900
-
2026-04-24status Active
-
2026-04-07status Pending
-
2026-04-03$519,900 Active
-
2026-01-27price $429,900
-
2026-01-09price $439,900
-
2025-12-26price $449,900
-
2025-12-26price $449,900
-
2025-12-11price $462,900
-
2025-12-05price $462,900
-
2025-11-19status Active
-
2025-11-11$474,900 Active
-
2019-06-04soldstatus $313,000
-
2019-05-29soldstatus $313,000 Sold
-
2019-04-12status Pending
-
2019-03-15$315,000 Active
-
2013-08-18historical
-
2013-08-09soldstatus $244,900
-
2013-07-15$244,900
-
2004-02-27soldstatus $229,500
-
2003-12-05$229,900
-
2002-11-26soldstatus $212,500
-
2002-08-08$212,500
-
2002-08-07historical
-
2002-08-07historical
-
2002-05-16$224,901
-
2002-03-12$234,900
ⓘ Source: listings_history table (triggers on properties + properties_extension) + one-shot
backfill from property_details.listing_events for pre-trigger history.
Tax reassessment forecast IN · Partial reset (capped growth)
- Current annual tax
- $4,299 · $358/mo
- Projected year-2 tax
- $4,317 · $360/mo
- Expected delta
- +$17/yr (+$1/mo · 0.4%)
ⓘ Screening estimate from a state-policy table — verify with the county assessor before closing.
Climate risk First Street
- Flood 1/10 Low FEMA zone X (unshaded) · 0% chance over 30 yrs
- Wildfire 1/10 Low
- Heat 3/10 Moderate 7 d/yr ≥101°F today · 18 d/yr by 30 yrs out
- Wind 2/10 Low 0% chance of damaging wind over 30 yrs
- Air quality 2/10 Low 2 unhealthy d/yr today · 2 by 30 yrs out
Nearby sold comps map
Loading sold comps map…
Walkable amenities ~0.75 mi
Loading nearby amenities…
Taxation est. · year 1
- Rental income
- $28,750
- − Mortgage interest
- −$28,562
- − Property taxes
- −$4,299
- − Insurance
- −$2,550
- − Repairs & maintenance
- −$2,300
- − Management
- −$2,300
- − HOA
- −$504
- − Depreciation
- −$14,833
- Taxable loss
- −$26,599
- Est. tax savings @ 24.0%
- +$6,384
- After-tax cash flow
- $-10,344/yr
For passive investors: Depreciation is non-cash, so a rental often shows a tax loss while cash-flowing — sheltering income. Rental losses are passive: they offset passive income freely, and up to $25,000/yr can offset ordinary (W-2) income if you actively participate and your MAGI is under $100k (phasing out to $0 by $150k); unused losses carry forward. On sale, claimed depreciation is recaptured at up to 25%, and gains may owe capital-gains tax (a 1031 exchange can defer both). Figures are a year-1 estimate at your 24.0% rate — not tax advice; consult a CPA.
Schools (NCES district)
- District
- Hamilton Southeastern Schools
- NCES district ID
- 1810650
- Math proficiency
- 57% ▼ -11.00%
- Reading proficiency
- 59% ▼ -7.00%
- Median HH income
- $87,726
- Composite
- 53.02/100
- National rank
- #1520
- State rank
- #14 of 301 in IN
Livability — Fishers
- Score
- 83/100
- State rank
- #11
- US rank
- #898
Category grades
Schools grade is shown separately in the Schools card above.
Census & demographics
- Census place
- Fishers, IN
- County
- Hamilton County · 337,479 people
- City population
- 92,467
- Metro
- Indianapolis-Carmel-Anderson, IN
- Population (ZIP)
- 48,713
- Household income
- $141,810
- Rent vs Own
- Severe rent burden
- 738.0
Population outlook (Hamilton County) Hauer SSP2
- Today (2025)
- 381,938 people
- By 2030
- 417,496 · +9.3%
- By 2040
- 486,684 · +27.4%
- By 2050
- 549,805 · +44.0%
- By 2075
- 687,078 · +79.9%
- By 2100
- 754,495 · +97.5%
Race, ethnicity, and origin ACS 2023
- Neighborhood character
- Predominantly White (79%)
- Race & ethnicity
- White 79% Asian 10% Two or more races 5% Hispanic / Latino 3% Black 3%
- Common ancestry
- Romanian 2% Slovak 2% Iranian 1%
- Foreign-born
- 10% · Canada, China, South Korea
- Languages at home
- 87% English-only · Other Indo-European 4% Other Asian/Pacific 4% Spanish 2%
Political lean MEDSL · Hamilton
- 2024 margin
- Lean R (+6.1) · D 46.0% · R 52.1% · Other 1.9%
- 2008→2024 swing
- +16.2pp toward D · 2008: -22.2pp · 2024: -6.1pp
- All cycles
- 2024: R+6.1 2020: R+6.8 2016: R+19.6 2012: R+34.3 2008: R+22.2
Not yet ingested
- Civics
- —
Market trends
- HPI YoY
- ▼ -48.93%
- Current HPI
- 213.5424
- Rent YoY
- ▲ 6.71%
- Metro
- Indianapolis-Carmel-Anderson, IN
- State GDP YoY
- ▲ 2.90%
- F500 in state
- 18
Industry mix (Fortune 500 HQ in IN)
| Industry | F500 HQs | Revenue |
|---|---|---|
| Industrial Machinery | 2 | $37B |
|
||
| Healthcare | 1 | $177B |
|
||
| Pharmaceuticals | 1 | $45B |
|
||
| Metals / Steel | 1 | $18B |
|
||
| Agriculture | 1 | $17B |
|
||
| Packaging | 1 | $12B |
|
||
Price history
+117.1% since first listed28 events — show timeline
- 2026-04-30 Pending — MIBOR as Distributed by MLS Grid
- 2026-04-30 Price Changed $509,900 MIBOR as Distributed by MLS Grid
- 2026-04-24 Relisted — MIBOR as Distributed by MLS Grid
- 2026-04-07 Pending — MIBOR as Distributed by MLS Grid
- 2026-04-03 Listed $519,900 MIBOR as Distributed by MLS Grid
- 2026-01-27 Price Changed $429,900 IRMLS
- 2026-01-09 Price Changed $439,900 IRMLS
- 2025-12-26 Price Changed $449,900 RRELMS
- 2025-12-26 Price Changed $449,900 IRMLS
- 2025-12-11 Price Changed $462,900 RRELMS
- 2025-12-05 Price Changed $462,900 IRMLS
- 2025-11-19 Relisted — IRMLS
- 2025-11-11 Listed $474,900 IRMLS
- 2019-06-04 Sold (Public Records) $313,000 Public Records
- 2019-05-29 Sold (MLS) $313,000 MIBOR as Distributed by MLS Grid
- 2019-04-12 Pending — MIBOR as Distributed by MLS Grid
- 2019-03-15 Listed $315,000 MIBOR as Distributed by MLS Grid
- 2013-08-18 Listing Removed — MIBOR as Distributed by MLS Grid
- 2013-08-09 Sold (MLS) $244,900 MIBOR as Distributed by MLS Grid
- 2013-07-15 Listed $244,900 MIBOR as Distributed by MLS Grid
- 2004-02-27 Sold (MLS) $229,500 MIBOR as Distributed by MLS Grid
- 2003-12-05 Listed $229,900 MIBOR as Distributed by MLS Grid
- 2002-11-26 Sold (MLS) $212,500 MIBOR as Distributed by MLS Grid
- 2002-08-08 Listed $212,500 MIBOR as Distributed by MLS Grid
- 2002-08-07 Listing Removed — MIBOR as Distributed by MLS Grid
- 2002-08-07 Listing Removed — MIBOR as Distributed by MLS Grid
- 2002-05-16 Listed $224,901 MIBOR as Distributed by MLS Grid
- 2002-03-12 Listed $234,900 MIBOR as Distributed by MLS Grid
Property tax history
+5.5%/yrLatest (2025): $4,299 · -7.9% YoY. Source: county tax records.
Cash-flow waterfall
monthlySold comps — $/sqft
last 12 mo · ≤1 miLoading sold comps…