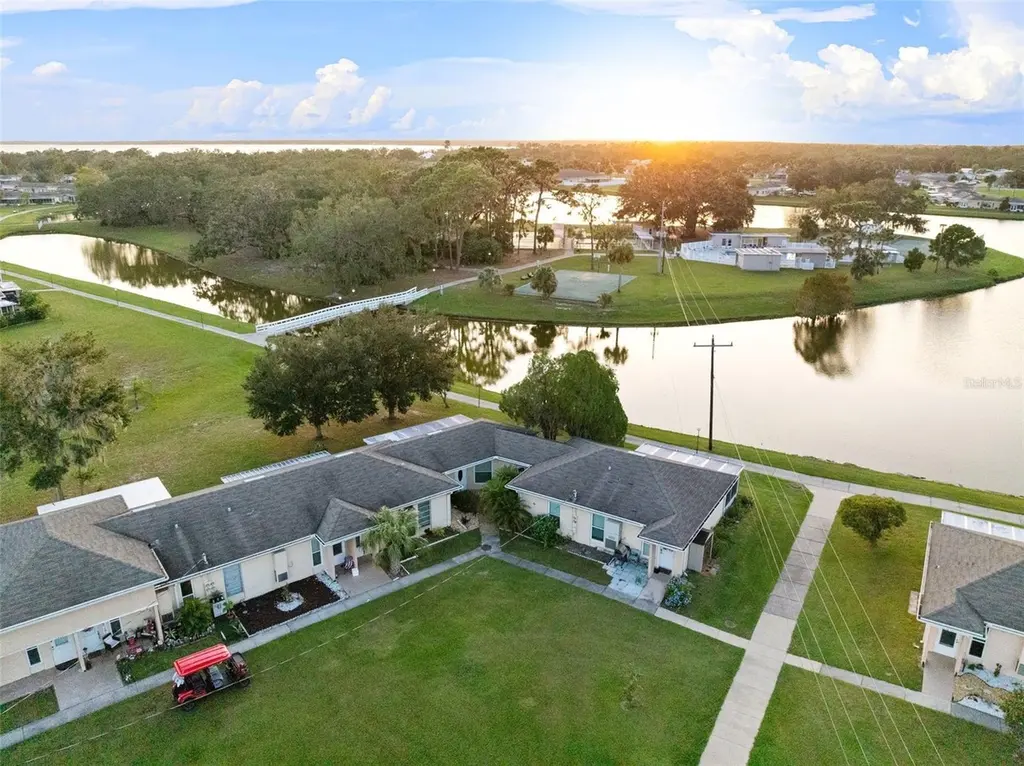
 🌊 Lakefront
3515 Club Cir · Indian Lake Estates, FL
Flood risk 1/10 · Minimal
- FEMA flood zone
- X (unshaded)
- Chance of flooding over 30 yrs
- 0.0%
- Est. flood insurance / yr
- $507 – $1,088
Fire risk 5/10 · Moderate
- Est. fire insurance / yr
- $947 – $1,759
Heat risk 8/10 · Major
- Hot days now (above 107°F)
- 7 days/yr
- Hot days in 30 yrs
- 25 days/yr
Wind risk 9/10 · Severe
- Chance of severe wind over 30 yrs
- 99.0%
Air-quality risk 1/10 · Minimal
- Unhealthy air days now
- 0 days/yr
- Unhealthy air days in 30 yrs
- 0 days/yr
Risk factors via First Street. Map © Google.
Why this score? — see what drove the D grade
The composite is a weighted blend of 9 inputs, each scored 0–100. Each bar is that input's sub-score; the figure is the points it added to the 100-point composite (weight × sub-score).
- 1% rule +7.9/10.0
- Cash flow +7.5/30.0
- ARV discount +7.5/15.0
- Appreciation +5.2/10.0
- Schools +3.5/10.0
- Rent growth +2.5/5.0
- Livability +2.5/5.0
- Condition / age +2.5/5.0
- DSCR +1.6/10.0
$77,950
🖨 Deal sheet 📄 Offer letter ✓ Due diligence
Listing remarks
Welcome to this 1 bedroom 1 bathroom villa. A clean and cozy unit ready for move in. The kitchen island has been professionally renovated offering an updated modern look with quartz countertop. The bathroom has a modern tile walk in shower. Entire unit has tile flooring throughout. A Separate covered sunroom allowing to relax and enjoy the delightful lake views. This is a great opportunity for a comfortable living space. Assigned parking space for your own vehicle. A short walk to the clubhouse and all the wonderful amenities. The On-site amenities include; Laundry, Swimming pool, Auditorium Basketball Courts, Bocce Ball court, Car wash, Chapel, Horseshoe pits, Game room, Beauty salon, Libr
Key facts
- Quartz countertop
- Lake views
- Covered sunroom
Tags
Property features AI
Finance
- Other: No lease restrictions reported
- Financial info: Total monthly fees $350; Total annual fees $4,200
- HOA & community: Monthly HOA fee of $350 (includes cable TV, pool, water); Association name: jessica soto; Community amenities include fitness center, pool, and tennis courts; Golf carts allowed; Pets allowed (max 20 lbs)
Exterior
- Utilities: Public water; Public sewer; Electricity available; Water connected; Sewer connected; Cable connected
- Home design: Residential villa; One level; North-facing
- Construction: Stucco construction; Shingle roof; Slab foundation; Built on public records
- Exterior features: Exterior lighting; Paved road
Interior
- Kitchen: Range; Refrigerator; Disposal
- Bedrooms: 1 bedroom
- Flooring: Ceramic tile
- Bathrooms: 1 full bathroom
- Heating & cooling: Central heating; Central air
- Interior features: Thermostat; Disposal; Range; Refrigerator; Ceramic tile flooring; Central heating; Central air
- Laundry & utility: Laundry in common area
Neighborhood map
What this means for you Summary
Snapshot
- This is a 1-bed/1.0-bath single-family listed at $78k.
Deal economics
- At list price, monthly cash flow is $-99 ($-1k/yr) — negative.
- To cash-flow at today's rent, offer at most $61k (22.3% below list).
- Meets the 1% rule at list price ($1k rent vs $78k).
- Recommended offer: $61k (22.3% below list) — sets the bar for cash-flow.
Location & tenants
- Location reads: area grade D — affects rentability + tenant quality, not the cash-flow math above.
- Polk (suburban): math 39% / reading 43% proficiency, ranked #62 of 73 in FL (top 85%) — families likely to look elsewhere, expect single-tenant / working-renter base with shorter leases.
- Market conditions: 20 active listings in the ZIP; 2 comparable units currently listed for rent nearby; 10,384 units permitted in Polk County in 2024 (1,716 in 5+ unit buildings).
Forward outlook
- In year one you build about $881 of equity ($538 loan paydown + $343 appreciation (0.4% local appreciation)).
- Polk County population projected at +33% by 2050 — long-run rental-demand tailwind backs the buy-and-hold thesis.
Negotiation context
- It's been on market 45 days — a 3% lower offer ($76k) is reasonable based on typical stale-listing flexibility.
- 3 sale attempts since 2y ago; this cycle's ask has dropped $11k (12%) from the opening price — seller is motivated, your offer sets the floor, not the list.
Risks & watch-outs
- Watch-outs: HOA is 35% of rent.
- Climate carrying-cost: severe wind risk, 99% chance of damaging wind over 30y; moderate wildfire risk; extreme-heat days projected 7→25/yr by 2055 (HVAC capex compounding) — expect insurance premiums to compound above CPI over the hold.
Questions for the listing agent
- What do current leases actually rent for vs. the listed asking? Can we see a recent rent roll and the last 12 months of T-12 income?
- It's been on market 45 days. Have you received any prior offers? Is the seller open to a 22% concession, seller financing, or rate buy-down credit?
- Built in 1965 — when were the roof, HVAC, electrical panel, plumbing, and water heater last replaced?
- What does the HOA fee cover, when was the last increase, and are there any pending special assessments or reserve-fund shortfalls?
- Is there a deadline driving the sale (1031 exchange, divorce, estate, relocation)? That informs how much negotiation room exists.
- The area grade is low — what's the realistic commute time and amenity access for the typical tenant pool here? Any planned neighborhood developments (good or bad) we should know about?
- This sits on a lake — are riparian / water-frontage rights deeded with the parcel? Any dock permits, shoreline easements, or HOA water-use restrictions?
- What's the documented flood / surge / shoreline-erosion history here (FEMA AND non-FEMA — e.g., storm surge, creek backup, septic-field saturation)?
- Any water-quality or seasonal algae-bloom issues that affect tenant satisfaction or short-term-rental demand?
- What's the average days-on-market for RENTAL listings here right now (not sales)? A rising rental-DOM trend means longer vacancies and softer asking-rent achievability than the comps imply.
- What's the recent tenant-quality profile in this submarket — average credit score on applications, eviction rate, late-payment / NSF rate, and stable-employment percentage? A property-management company in the area should have these aggregated.
- How much new for-sale + rental construction is in the pipeline within 1–3 miles? Heavy new supply typically softens prices + rents 12–24 months out; constrained supply supports both.
Investment metrics
- 1% rule
- 1.29% ✓
- Cap rate
- 4.78%
- Cash-on-cash
- -5.42%
- DSCR
- 0.76
- GRM
- 6.5
CMA / ARV
No comps found within radius.
Projected returns pro-forma
0.44% appreciation · 3.0% rent growth · sell at horizon
- IRR
- -6.3%
- Equity multiple
- 0.69×
- Total profit
- $-6,696
- Equity at exit
- $24,365
- IRR
- -0.3%
- Equity multiple
- 0.96×
- Total profit
- $-868
- Equity at exit
- $30,707
Cash invested: $21,826 (down + closing). Projections, not guarantees.
Landlord ↔ Tenant lean methodology
- Overall (STATE)
- 87 Strongly Landlord-Friendly
- State Florida
- 87 Strongly Landlord-Friendly · R+3
- County
- — inherits STATE
- City
- — inherits STATE
ZIP-level market 33854
- Home prices YoY
- 0.3%
- Active inventory
- 20
- Price-to-rent
- 6.5×
Monthly cashflow live
- Estimated rent
- $1,004 medium interval (Pro) →
- Mortgage (P&I)
- −$409
- Tax from tax record
- −$100 /mo · $1,204/yr
- Insurance
- −$32
- HOA
- −$350
- Vacancy / Maint / Mgmt
- −$211
- Net cashflow
- $-99
Break-even live
UW: 25.0% down · 7.5% · 30yr · 1.5% tax · 5.0% vac · 8.0% maint · 8.0% mgmt
Financing live
Cash to close
- Down payment
- $19,488
- Closing costs
- $2,338
- Reserves months
- —
- Total cash needed
- —
Loan-product check · same deal, 3 products live
Conventional
25% down · 7.5% · 30yr
- Down + closing
- —
- Monthly P&I
- —
- Monthly cashflow
- —
- DSCR
- —
- Eligible?
- —
Personal DTI + credit; lowest rate.
DSCR
20% down · 8.5% · 30yr
- Down + closing
- —
- Monthly P&I
- —
- Monthly cashflow
- —
- DSCR
- —
- Eligible?
- —
No personal income docs; deal must DSCR.
Hard money
10% down · 12.0% · 12mo
- Down + closing
- —
- Monthly P&I
- —
- Monthly cashflow
- —
- DSCR
- —
- Eligible?
- —
Short-term bridge; refi at stabilization.
Rent comps 2 comps
| Address | Beds | Baths | Sqft | Rent | $/sqft | DOM | Units | Dist |
|---|---|---|---|---|---|---|---|---|
| 2709 Club Cir Lake Wales, FL | 1.0 | 1.0 | 648 | $950 | $1.47 | 23d | 1 | 0.24mi |
| 1707 Club Cir Unit 1707 Lakeshore, FL | 1.0 | 1.0 | 648 | $1,075 | $1.66 | 23d | 1 | 0.31mi |
HOA detail
- Monthly dues
- $350 · $4,200/yr
- Likely covers
- poolparking
Listing history 20 events
-
2026-06-18days on market $77,950 Active 45 DOM
-
2026-06-17days on market $77,950 Active 44 DOM
-
2026-06-16days on market $77,950 Active 43 DOM
-
2026-06-15days on market $77,950 Active 42 DOM
-
2026-06-13pricedays on market $77,950 Active 40 DOM
-
2026-06-10days on market $83,900 Active 37 DOM
-
2026-06-09days on market $83,900 Active 36 DOM
-
2026-06-08days on market $83,900 Active 35 DOM
-
2026-06-07days on market $83,900 Active 34 DOM
-
2026-06-05days on market $83,900 Active 31 DOM
-
2026-06-03days on market $83,900 Active 30 DOM
-
2026-06-03days on market $83,900 Active 29 DOM
-
2026-06-01days on market $83,900 Active 28 DOM
-
2026-05-31pricedays on market $83,900 Active 27 DOM
-
2026-05-04$89,000 Active
-
2025-06-04historical $895
-
2025-05-09$895
-
2025-05-08historical
-
2025-02-14price $99,000
-
2024-11-13$105,900 Active
ⓘ Source: listings_history table (triggers on properties + properties_extension) + one-shot
backfill from property_details.listing_events for pre-trigger history.
Tax reassessment forecast FL · Resets to sale price
- Current annual tax
- $1,204 · $100/mo
- Projected year-2 tax
- $1,204 · $100/mo
- Expected delta
- $0/yr ($0/mo · 0.0%)
ⓘ Screening estimate from a state-policy table — verify with the county assessor before closing.
Climate risk First Street
- Flood 1/10 Low FEMA zone X (unshaded) · 0% chance over 30 yrs
- Wildfire 5/10 Major
- Heat 8/10 Severe 7 d/yr ≥107°F today · 25 d/yr by 30 yrs out
- Wind 9/10 Extreme 99% chance of damaging wind over 30 yrs
- Air quality 1/10 Low 0 unhealthy d/yr today · 0 by 30 yrs out
Nearby sold comps map
Loading sold comps map…
Walkable amenities ~0.75 mi
Loading nearby amenities…
Taxation est. · year 1
- Rental income
- $12,046
- − Mortgage interest
- −$4,366
- − Property taxes
- −$1,204
- − Insurance
- −$390
- − Repairs & maintenance
- −$964
- − Management
- −$964
- − HOA
- −$4,200
- − Depreciation
- −$2,268
- Taxable loss
- −$2,309
- Est. tax savings @ 24.0%
- +$554
- After-tax cash flow
- $-628/yr
For passive investors: Depreciation is non-cash, so a rental often shows a tax loss while cash-flowing — sheltering income. Rental losses are passive: they offset passive income freely, and up to $25,000/yr can offset ordinary (W-2) income if you actively participate and your MAGI is under $100k (phasing out to $0 by $150k); unused losses carry forward. On sale, claimed depreciation is recaptured at up to 25%, and gains may owe capital-gains tax (a 1031 exchange can defer both). Figures are a year-1 estimate at your 24.0% rate — not tax advice; consult a CPA.
Schools (NCES district)
- District
- Polk
- NCES district ID
- 1201590
- Math proficiency
- 39% ▼ -11.00%
- Reading proficiency
- 43% ▼ -4.00%
- Median HH income
- $43,979
- Composite
- 34.74/100
- National rank
- #5132
- State rank
- #62 of 73 in FL
Livability — Indian Lake Estates
No livability data for this city. (Only ~50 U.S. cities are tracked.)
Census & demographics
- City population
- 33
- Population (ZIP)
- 481
Population outlook (Polk County) Hauer SSP2
- Today (2025)
- 752,975 people
- By 2030
- 804,621 · +6.9%
- By 2040
- 906,117 · +20.3%
- By 2050
- 1,000,476 · +32.9%
- By 2075
- 1,197,520 · +59.0%
- By 2100
- 1,271,518 · +68.9%
Race, ethnicity, and origin ACS 2023
- Neighborhood character
- Predominantly Hispanic (71%)
- Race & ethnicity
- Hispanic / Latino 71% White 19% Two or more races 19% Black 8%
- Hispanic origin (detail)
- Puerto Rican 69%
- Common ancestry
- Romanian 1%
- Languages at home
- 48% English-only · Spanish 52%
Political lean MEDSL · Polk
- 2024 margin
- Strong R (+20.7) · D 39.2% · R 59.9%
- 2008→2024 swing
- -14.6pp toward R · 2008: -6.1pp · 2024: -20.7pp
- All cycles
- 2024: R+20.7 2020: R+14.4 2016: R+14.1 2012: R+6.8 2008: R+6.1
Not yet ingested
- Civics
- —
Market trends
- HPI YoY
- ▲ 0.44%
- Current HPI
- 168.7178
- Rent YoY
- —
- Metro
- —
- State GDP YoY
- ▲ 3.28%
- F500 in state
- 36
Industry mix (Fortune 500 HQ in FL)
| Industry | F500 HQs | Revenue |
|---|---|---|
| Industrial Technology | 2 | $29B |
|
||
| Insurance | 2 | $17B |
|
||
| Retail | 1 | $60B |
|
||
| Technology Distribution | 1 | $58B |
|
||
| Homebuilding | 1 | $35B |
|
||
| Technology Manufacturing | 1 | $35B |
|
||
Price history
-16.0% since first listed6 events — show timeline
- 2026-05-04 Listed $89,000 Stellar MLS as Distributed by MLS Grid
- 2025-06-04 Rental Removed $895 STELLARMLS
- 2025-05-09 Listed for Rent $895 STELLARMLS
- 2025-05-08 Listing Removed — Stellar MLS as Distributed by MLS Grid
- 2025-02-14 Price Changed $99,000 Stellar MLS as Distributed by MLS Grid
- 2024-11-13 Listed $105,900 Stellar MLS as Distributed by MLS Grid
Property tax history
+9.4%/yrLatest (2025): $1,204 · +13.0% YoY. Source: county tax records.
Cash-flow waterfall
monthlySold comps — $/sqft
last 12 mo · ≤1 miLoading sold comps…