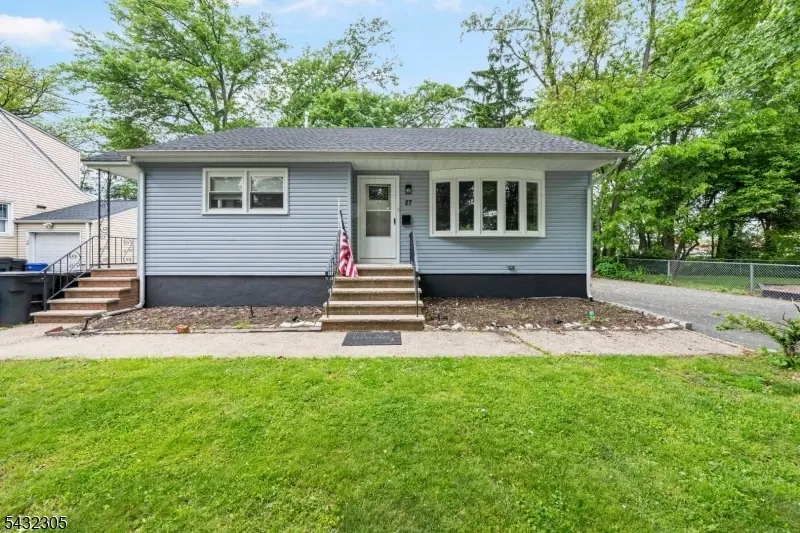
27 Alvin Ter · Springfield, NJ
Flood risk 8/10 · Major
- FEMA flood zone
- AE
- Chance of flooding over 30 yrs
- 0.99%
- Est. flood insurance / yr
- $1,737 – $8,500
Fire risk 1/10 · Minimal
- Est. fire insurance / yr
- $526 – $976
Heat risk 7/10 · Major
- Hot days now (above 101°F)
- 7 days/yr
- Hot days in 30 yrs
- 15 days/yr
Wind risk 6/10 · Moderate
- Chance of severe wind over 30 yrs
- 27.0%
Air-quality risk 4/10 · Minor
- Unhealthy air days now
- 3 days/yr
- Unhealthy air days in 30 yrs
- 5 days/yr
Risk factors via First Street. Map © Google.
Why this score? — see what drove the D grade
The composite is a weighted blend of 9 inputs, each scored 0–100. Each bar is that input's sub-score; the figure is the points it added to the 100-point composite (weight × sub-score).
- Cash flow +12.3/30.0
- ARV discount +8.6/15.0
- Appreciation +5.0/10.0
- 1% rule +3.8/10.0
- DSCR +3.6/10.0
- Schools +2.6/10.0
- Rent growth +2.5/5.0
- Livability +2.5/5.0
- Condition / age +2.5/5.0
$729,900
🖨 Deal sheet (PDF) 📄 Offer letter ✓ Due diligence
Listing remarks
Now listed at $729,900, reduced from $749,900 for exceptional value in one of Springfield most desirable neighborhoods. This beautifully updated 4-bedroom, 3-bath split-level home offers a rare combination of privacy and convenience with only one neighboring property and Alvin Park right next door. Bright open-concept living and dining spaces with Sun-filled eat-in kitchen with new flooring and ample storage. Spacious upstairs bedrooms including an updated primary suite. Fully finished lower level with home office, laundry and a flexible bonus space. Driveway parking for up to 6 cars, so not headache for visitors. Low taxes in a prestigious neighborhood with top-rated schools, a real bonus
Key facts
- 7,840 sq ft lot
- 6 parking spots
- Built 1961
Property features AI
Finance
- HOA & community: Pets allowed; On-site exercise room
Exterior
- Parking: Six parking spaces; Blacktop driveway
- Utilities: Electric service; Natural gas service; Public sewer; Public water
- Home design: Split-level design; Renovated in 2020
- Construction: Renovated construction; Full basement
- Exterior features: Vinyl siding; Asphalt shingle roof; Cul-de-sac lot; Storage shed
Interior
- Kitchen: Dishwasher; Gas range/oven; Microwave; Kitchen exhaust fan
- Bedrooms: Master bedroom with full bath; Three additional bedrooms on the second level
- Flooring: Tile; Vinyl/linoleum; Wood
- Bathrooms: Three full bathrooms
- Heating & cooling: Two heating units (forced hot air and heat pump); Natural gas heating; Two central air units
- Interior features: Eat-in kitchen; Living/dining combo; Office; Family room; Den; Full basement; Storage shed
- Laundry & utility: Washer; Dryer; Laundry room on ground level
Neighborhood map
What this means for you Summary
Snapshot
- This is a 4-bed/3.0-bath single-family listed at $730k.
Deal economics
- At list price, monthly cash flow is $-562 ($-7k/yr) — negative.
- To cash-flow at today's rent, offer at most $631k (13.6% below list).
- To meet the 1% rule (rent ≥ 1% of price), the offer needs to be $643k (11.9% below list).
- Recommended offer: $631k (13.6% below list) — sets the bar for cash-flow.
Location & tenants
- Location reads: area grade D — affects rentability + tenant quality, not the cash-flow math above.
- Springfield Public School District (suburban): math 25% / reading 25% proficiency, ranked #350 of 472 in NJ (top 74%) — low school quality limits family demand, transient renter base, plan for 1-2y turnover; only 8% free/reduced lunch — higher-income household profile.
- Zoned schools: Florence M. Gaudineer Middle School (518 students, 14% FRL); Jonathan Dayton High School (659 students, 16% FRL).
- Market conditions: 2 active listings in the ZIP; 3 comparable units currently listed for rent nearby; rentals leasing fast (median 0d on market — plan ~1-2 weeks tenant-placement turnaround); 1,749 units permitted in Union County in 2024 (1,421 in 5+ unit buildings).
Forward outlook
- In year one you build about $27k of equity ($5k loan paydown + $22k appreciation (3.0% local appreciation)).
- Union County population projected at +17% by 2050 — long-run rental-demand tailwind backs the buy-and-hold thesis.
- By year 2, paydown + projected appreciation supports a ~$44k cash-out refi (75% LTV) — recoverable capital for the next deal without selling this one.
Negotiation context
- It's been on market 37 days — a 3% lower offer ($708k) is reasonable based on typical stale-listing flexibility.
- 4 sale attempts since 8y ago with the ask held roughly flat each time — persistent listings suggest the price (not the market) is what's stuck; bring a comps-based counter.
- Current owner paid $240k; list at $730k implies a 204% gain — meaningful room to come down on a strong offer.
Risks & watch-outs
- Watch-outs: flood insurance adds $427/mo.
- Climate carrying-cost: in FEMA flood zone AE (mandatory federal flood insurance); major wind risk, 27% chance of damaging wind over 30y; extreme-heat days projected 7→15/yr by 2055 (HVAC capex compounding) — expect insurance premiums to compound above CPI over the hold.
Questions for the listing agent
- What do current leases actually rent for vs. the listed asking? Can we see a recent rent roll and the last 12 months of T-12 income?
- It's been on market 37 days. Have you received any prior offers? Is the seller open to a 14% concession, seller financing, or rate buy-down credit?
- Built in 1961 — when were the roof, HVAC, electrical panel, plumbing, and water heater last replaced?
- What's the actual annual flood-insurance premium (NFIP or private), and is the property in a SFHA with mandatory coverage?
- Is there a deadline driving the sale (1031 exchange, divorce, estate, relocation)? That informs how much negotiation room exists.
- The area grade is low — what's the realistic commute time and amenity access for the typical tenant pool here? Any planned neighborhood developments (good or bad) we should know about?
- What's the average days-on-market for RENTAL listings here right now (not sales)? A rising rental-DOM trend means longer vacancies and softer asking-rent achievability than the comps imply.
- What's the recent tenant-quality profile in this submarket — average credit score on applications, eviction rate, late-payment / NSF rate, and stable-employment percentage? A property-management company in the area should have these aggregated.
- How much new for-sale + rental construction is in the pipeline within 1–3 miles? Heavy new supply typically softens prices + rents 12–24 months out; constrained supply supports both.
Investment metrics
- 1% rule
- 0.88% ✗
- Cap rate
- 6.07%
- Cash-on-cash
- -0.80%
- DSCR
- 0.96
- GRM
- 9.5
CMA / ARV
- ARV (median comp)
- $748,741
- List price
- $729,900
- Delta
- -2.52%
- Verdict
- FAIR
- Comps
- 10 within 1.0 mi
Projected returns pro-forma
3.0% appreciation · 3.0% rent growth · sell at horizon
- IRR
- 4.5%
- Equity multiple
- 1.26×
- Total profit
- $52,578
- Equity at exit
- $328,195
- IRR
- 7.7%
- Equity multiple
- 2.17×
- Total profit
- $238,111
- Equity at exit
- $505,787
Cash invested: $204,372 (down + closing). Projections, not guarantees.
Landlord ↔ Tenant lean methodology
- Overall (STATE)
- 21 Tenant-Leaning
- State New Jersey
- 21 Tenant-Leaning · D+6
- County
- — inherits STATE
- City
- — inherits STATE
ZIP-level market 07081-1414
- Active inventory
- 2
- Price-to-rent
- 9.5×
Monthly cashflow live
- Estimated rent
- $6,427 medium interval (Pro) →
- Mortgage (P&I)
- −$3,828
- Tax from tax record
- −$1,082 /mo · $12,978/yr
- Insurance
- −$304
- Flood insurance flood zone
- −$427 /mo · $5,118/yr
- HOA
- −$0
- Vacancy / Maint / Mgmt
- −$1,350
- Net cashflow
- $-562
Break-even live
Sensitivity live
| Price | -10% $-149 | -5% $-356 | +0% $-562 | +5% $-769 | +10% $-975 |
|---|---|---|---|---|---|
| Rent | -10% $-1,070 | -5% $-816 | +0% $-562 | +5% $-308 | +10% $-55 |
| Rate | -1.0pp $-195 | -0.5pp $-377 | base $-562 | +0.5pp $-751 | +1.0pp $-944 |
UW: 25.0% down · 7.5% · 30yr · 1.5% tax · 5.0% vac · 8.0% maint · 8.0% mgmt
Financing live
Cash to close
- Down payment
- $182,475
- Closing costs
- $21,897
- Reserves months
- —
- Total cash needed
- —
Loan-product check · same deal, 3 products live
Conventional
25% down · 7.5% · 30yr
- Down + closing
- —
- Monthly P&I
- —
- Monthly cashflow
- —
- DSCR
- —
- Eligible?
- —
Personal DTI + credit; lowest rate.
DSCR
20% down · 8.5% · 30yr
- Down + closing
- —
- Monthly P&I
- —
- Monthly cashflow
- —
- DSCR
- —
- Eligible?
- —
No personal income docs; deal must DSCR.
Hard money
10% down · 12.0% · 12mo
- Down + closing
- —
- Monthly P&I
- —
- Monthly cashflow
- —
- DSCR
- —
- Eligible?
- —
Short-term bridge; refi at stabilization.
Rent comps 3 comps
| Address | Beds | Baths | Sqft | Rent | $/sqft | DOM | Units | Dist |
|---|---|---|---|---|---|---|---|---|
| 2851 Debra Way Unit 1546266P Union, NJ | 4.0 | 3.0 | 2497 | $5,806 | $2.33 | 17d | 1 | 0.47mi |
| 92 Millburn Ave Springfield, NJ | 1.0–3.0 | 1.0–4.0 | 1923 | $8,745 | $4.55 | 0d | 7 | 1.03mi |
| 2400 Vauxhall Rd Union, NJ | 1.0–3.0 | 1.0–2.5 | 1132 | $3,730 | $3.30 | 0d | 1 | 1.37mi |
Listing history 27 events
-
2026-06-21days on market $729,900 Active 37 DOM
-
2026-06-18days on market $729,900 Active 34 DOM
-
2026-06-17days on market $729,900 Active 33 DOM
-
2026-06-16days on market $729,900 Active 32 DOM
-
2026-06-15days on market $729,900 Active 31 DOM
-
2026-06-13days on market $729,900 Active 29 DOM
-
2026-06-13days on market $729,900 Active 28 DOM
-
2026-06-09days on market $729,900 Active 25 DOM
-
2026-06-08days on market $729,900 Active 24 DOM
-
2026-06-07days on market $729,900 Active 23 DOM
-
2026-06-04days on market $729,900 Active 20 DOM
-
2026-06-03days on market $729,900 Active 19 DOM
-
2026-06-02days on market $729,900 Active 18 DOM
-
2026-06-01days on market $729,900 Active 17 DOM
-
2026-05-31days on market $729,900 Active 16 DOM
-
2026-05-15$749,900 Active 705-char remark
-
2026-05-15historical $749,900 705-char remark
-
2019-03-27soldstatus $240,000 Sold
-
2019-02-26historical
-
2019-01-25status Active
-
2019-01-11historical
-
2018-12-26status Active
-
2018-11-01historical
-
2018-10-15price $250,000
-
2018-09-18price $270,000
-
2018-08-21price $275,000
-
2018-07-23$270,000 Active
ⓘ Source: listings_history table (triggers on properties + properties_extension) + one-shot
backfill from property_details.listing_events for pre-trigger history.
Tax reassessment forecast NJ · Partial reset (capped growth)
- Current annual tax
- $12,978 · $1,082/mo
- Projected year-2 tax
- $15,576 · $1,298/mo
- Expected delta
- +$2,598/yr (+$217/mo · 20.0%)
ⓘ Screening estimate from a state-policy table — verify with the county assessor before closing.
Climate risk First Street
- Flood 8/10 Severe FEMA zone AE · 99% chance over 30 yrs
- Wildfire 1/10 Low
- Heat 7/10 Severe 7 d/yr ≥101°F today · 15 d/yr by 30 yrs out
- Wind 6/10 Major 27% chance of damaging wind over 30 yrs
- Air quality 4/10 Moderate 3 unhealthy d/yr today · 5 by 30 yrs out
Nearby sold comps map
Loading sold comps map…
Walkable amenities ~0.75 mi
Loading nearby amenities…
Taxation est. · year 1
- Rental income
- $77,128
- − Mortgage interest
- −$40,886
- − Property taxes
- −$12,978
- − Insurance
- −$8,768
- − Repairs & maintenance
- −$6,170
- − Management
- −$6,170
- − Depreciation
- −$21,233
- Taxable loss
- −$19,078
- Est. tax savings @ 24.0%
- +$4,579
- After-tax cash flow
- $-2,169/yr
For passive investors: Depreciation is non-cash, so a rental often shows a tax loss while cash-flowing — sheltering income. Rental losses are passive: they offset passive income freely, and up to $25,000/yr can offset ordinary (W-2) income if you actively participate and your MAGI is under $100k (phasing out to $0 by $150k); unused losses carry forward. On sale, claimed depreciation is recaptured at up to 25%, and gains may owe capital-gains tax (a 1031 exchange can defer both). Figures are a year-1 estimate at your 24.0% rate — not tax advice; consult a CPA.
Schools (NCES district)
- District
- Springfield Public School District
- NCES district ID
- 3415630
- Math proficiency
- 25% ▼ -27.00%
- Reading proficiency
- 25% ▼ -43.00%
- Median HH income
- $93,744
- Composite
- 26.25/100
- National rank
- #7255
- State rank
- #350 of 472 in NJ
Livability — Springfield
No livability data for this city. (Only ~50 U.S. cities are tracked.)
Census & demographics
No demographic data for this ZIP.
Market trends
- HPI YoY
- —
- Current HPI
- —
- Rent YoY
- —
- Metro
- —
- State GDP YoY
- ▲ 2.05%
- F500 in state
- 34
Industry mix (Fortune 500 HQ in NJ)
| Industry | F500 HQs | Revenue |
|---|---|---|
| Consumer Goods | 3 | $31B |
|
||
| Pharmaceuticals | 2 | $153B |
|
||
| Technology | 2 | $21B |
|
||
| Insurance | 2 | $20B |
|
||
| Healthcare | 2 | $19B |
|
||
| Financial Services | 1 | $70B |
|
||
Price history
+170.3% since first listed13 events — show timeline
- 2026-05-29 Price Changed $729,900 GSMLS
- 2026-05-15 Listed $749,900 GSMLS
- 2026-05-15 Coming Soon $749,900 GSMLS
- 2019-03-27 Sold (MLS) $240,000 GSMLS
- 2019-02-26 Delisted — GSMLS
- 2019-01-25 Relisted — GSMLS
- 2019-01-11 Delisted — GSMLS
- 2018-12-26 Relisted — GSMLS
- 2018-11-01 Delisted — GSMLS
- 2018-10-15 Price Changed $250,000 GSMLS
- 2018-09-18 Price Changed $270,000 GSMLS
- 2018-08-21 Price Changed $275,000 GSMLS
- 2018-07-23 Listed $270,000 GSMLS
Property tax history
+5.0%/yrLatest (2025): $12,978 · +1.5% YoY. Source: county tax records.
Cash-flow waterfall
monthlySold comps — $/sqft
last 12 mo · ≤1 miLoading sold comps…