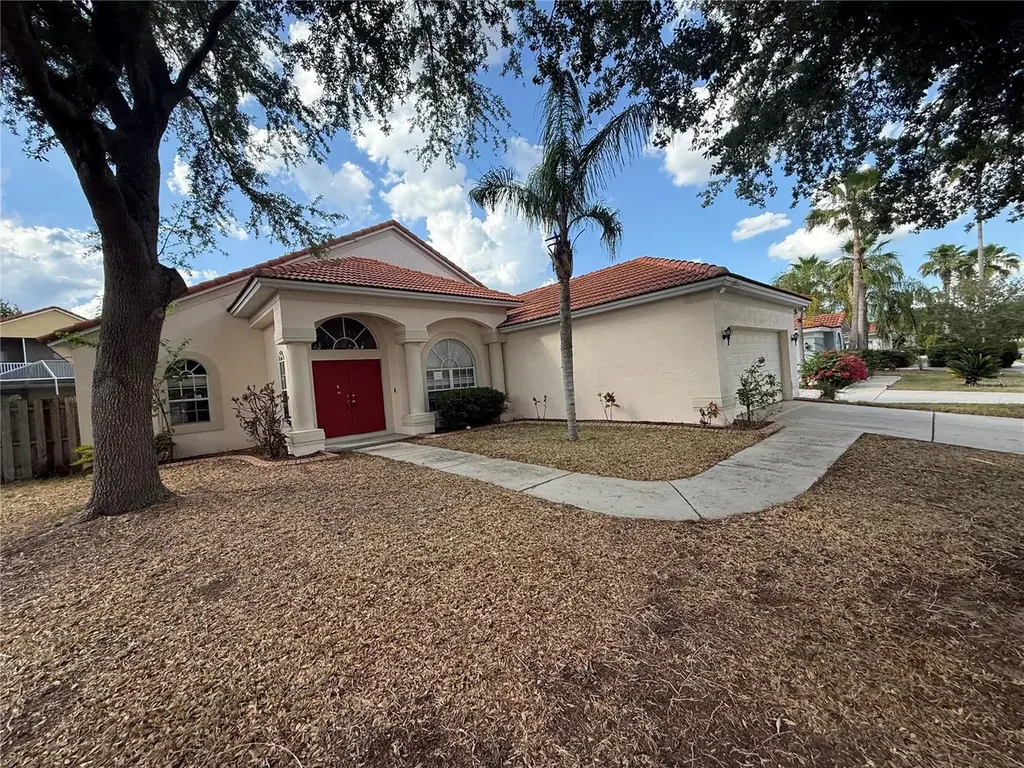
1310 Brentwood Hills Blvd · Brandon, FL
Flood risk 1/10 · Minimal
- FEMA flood zone
- X (unshaded)
- Chance of flooding over 30 yrs
- 0.0%
- Est. flood insurance / yr
- $507 – $1,088
Fire risk 1/10 · Minimal
- Est. fire insurance / yr
- $947 – $1,759
Heat risk 10/10 · Severe
- Hot days now (above 109°F)
- 7 days/yr
- Hot days in 30 yrs
- 25 days/yr
Wind risk 9/10 · Severe
- Chance of severe wind over 30 yrs
- 99.0%
Air-quality risk 4/10 · Minor
- Unhealthy air days now
- 4 days/yr
- Unhealthy air days in 30 yrs
- 5 days/yr
Risk factors via First Street. Map © Google.
Why this score? — see what drove the D+ grade
The composite is a weighted blend of 9 inputs, each scored 0–100. Each bar is that input's sub-score; the figure is the points it added to the 100-point composite (weight × sub-score).
- Cash flow +18.2/30.0
- ARV discount +7.5/15.0
- DSCR +5.7/10.0
- Schools +4.2/10.0
- Livability +4.2/5.0
- 1% rule +3.8/10.0
- Condition / age +2.5/5.0
- Rent growth +2.2/5.0
- Appreciation +0.0/10.0
$291,500
🖨 Deal sheet 📄 Offer letter ✓ Due diligence
Listing remarks MLS
Back on the market due to buyers financing falling through! Lovely turn key, 4 bed, 2 bath, 2 cg home in desirable Brentwood Hills. Close to all the necessities and conveniences that Brandon has to offer. Minutes to the the Lee Roy Selmon Espressway (Crosstown) makes for an easy and quick commute to Tampa, MacDill and St Pete. This home boasts a split floor plan, volume ceilings, stainless steel kitchen appliances, new interior and exterior paint, tile and laminate wood flooring with carpet in the bonus/game room upstairs. The spacious master bedroom has a large walk in closet and beautiful updated bathroom with a tiled walk in shower, solid surface counters, soaking tub and dual sinks. Glass sliders in the master, living/dining, and one of the secondary bedrooms lead out to the ample sized, fenced in backyard. BBQ enthusiasts will appreciate the beautiful new wooden deck perfect for grilling and hosting. There is a newer wooden play set with swings included in purchase as well. The home is a short walk to the community pool, tennis courts and playground. Don't miss out, schedule your private showing today.
Key facts
- Tile roof
- Bonus room
- Open loft area
Tags
Property features AI
Finance
- HOA & community: HOA managed by McNeil Management; HOA fees required — $190 quarterly (approx. $63.33/month); Community has street lights; Pets allowed
Exterior
- Parking: Attached garage; 2-car garage
- Utilities: Public water; Public sewer
- Home design: Single family residence; Residential property; Two stories; Faces west; Planned development (PD) zoning
- Construction: Block construction; Tile roof; Slab foundation; Built on a 0.18-acre lot (70 x 112)
- Exterior features: Sidewalk; Paved road access
Interior
- Kitchen: No appliances included
- Bedrooms: 4 bedrooms
- Flooring: Ceramic tile
- Bathrooms: 2 full bathrooms
- Heating & cooling: Electric heating; Central air conditioning
- Interior features: High ceilings; Bonus room
- Laundry & utility: Laundry inside
Neighborhood map
What this means for you Summary
Snapshot
- This is a 4-bed/2.0-bath single-family listed at $292k.
Deal economics
- At list price, monthly cash flow is $261 ($3k/yr) — positive.
- The deal already cash-flows at list — no discount required.
- To meet the 1% rule (rent ≥ 1% of price), the offer needs to be $258k (11.6% below list).
- Recommended offer: $258k (11.6% below list) — sets the bar for 1% rule.
Location & tenants
- Location reads 85/100 on livability (#26 in FL, #507 nationally) — a professional / high-income tenant draw. Strengths: amenities A+, housing A+, health & safety A+.
- Hillsborough (suburban): math 47% / reading 50% proficiency, ranked #41 of 73 in FL (top 56%) — families likely to look elsewhere, expect single-tenant / working-renter base with shorter leases.
- Market conditions: Rents soft (-1.2%/yr); 313 active listings in the ZIP; 14 comparable units currently listed for rent nearby; rentals at typical pace (median 20d on market — plan ~3-4 weeks tenant-placement turnaround); solid renter incomes; 9,053 units permitted in Hillsborough County in 2024 (4,555 in 5+ unit buildings).
- This rent runs 38% of the median local income ($81k/yr) — at the standard rent-burdened threshold; future hikes will face affordability resistance.
Forward outlook
- Local home prices are declining (-3.0%/yr); year-one equity from $2k of loan paydown is wiped out by about $9k of value loss. Plan a longer hold.
- Hillsborough County population projected at +37% by 2050 — long-run rental-demand tailwind backs the buy-and-hold thesis.
Negotiation context
- Only 6 days on market — expect competitive offers; lowballing is unlikely to land.
- 5 sale attempts since 22y ago with the ask held roughly flat each time — persistent listings suggest the price (not the market) is what's stuck; bring a comps-based counter.
Risks & watch-outs
- Climate carrying-cost: severe wind risk, 99% chance of damaging wind over 30y; extreme-heat days projected 7→25/yr by 2055 (HVAC capex compounding) — expect insurance premiums to compound above CPI over the hold.
Questions for the listing agent
- What does the HOA fee cover, when was the last increase, and are there any pending special assessments or reserve-fund shortfalls?
- Is there a deadline driving the sale (1031 exchange, divorce, estate, relocation)? That informs how much negotiation room exists.
- The area grade is low — what's the realistic commute time and amenity access for the typical tenant pool here? Any planned neighborhood developments (good or bad) we should know about?
- What's the average days-on-market for RENTAL listings here right now (not sales)? A rising rental-DOM trend means longer vacancies and softer asking-rent achievability than the comps imply.
- What's the recent tenant-quality profile in this submarket — average credit score on applications, eviction rate, late-payment / NSF rate, and stable-employment percentage? A property-management company in the area should have these aggregated.
- How much new for-sale + rental construction is in the pipeline within 1–3 miles? Heavy new supply typically softens prices + rents 12–24 months out; constrained supply supports both.
Investment metrics
- 1% rule
- 0.88% ✗
- Cap rate
- 7.37%
- Cash-on-cash
- 3.83%
- DSCR
- 1.17
- GRM
- 9.4
CMA / ARV
No comps found within radius.
Projected returns pro-forma
-3.0% appreciation · 0.0% rent growth · sell at horizon
- IRR
- -13.4%
- Equity multiple
- 0.53×
- Total profit
- $-38,295
- Equity at exit
- $43,464
- IRR
- -9.4%
- Equity multiple
- 0.49×
- Total profit
- $-41,596
- Equity at exit
- $25,204
Cash invested: $81,620 (down + closing). Projections, not guarantees.
Landlord ↔ Tenant lean methodology
- Overall (STATE)
- 87 Strongly Landlord-Friendly
- State Florida
- 87 Strongly Landlord-Friendly · R+3
- County
- — inherits STATE
- City
- — inherits STATE
ZIP-level market 33511
- Rents YoY
- -1.2%
- Active inventory
- 313
- Price-to-rent
- 9.4×
Monthly cashflow live
- Estimated rent
- $2,577 high interval (Pro) →
- Mortgage (P&I)
- −$1,529
- Tax from tax record
- −$62 /mo · $745/yr
- Insurance
- −$121
- HOA
- −$63
- Vacancy / Maint / Mgmt
- −$541
- Net cashflow
- $261
Break-even live
UW: 25.0% down · 7.5% · 30yr · 1.5% tax · 5.0% vac · 8.0% maint · 8.0% mgmt
Financing live
Cash to close
- Down payment
- $72,875
- Closing costs
- $8,745
- Reserves months
- —
- Total cash needed
- —
Loan-product check · same deal, 3 products live
Conventional
25% down · 7.5% · 30yr
- Down + closing
- —
- Monthly P&I
- —
- Monthly cashflow
- —
- DSCR
- —
- Eligible?
- —
Personal DTI + credit; lowest rate.
DSCR
20% down · 8.5% · 30yr
- Down + closing
- —
- Monthly P&I
- —
- Monthly cashflow
- —
- DSCR
- —
- Eligible?
- —
No personal income docs; deal must DSCR.
Hard money
10% down · 12.0% · 12mo
- Down + closing
- —
- Monthly P&I
- —
- Monthly cashflow
- —
- DSCR
- —
- Eligible?
- —
Short-term bridge; refi at stabilization.
Rent comps 14 comps
| Address | Beds | Baths | Sqft | Rent | $/sqft | DOM | Units | Dist |
|---|---|---|---|---|---|---|---|---|
| 1517 Loretta Ct Brandon, FL | 3.0 | 2.0 | 1781 | $2,300 | $1.29 | 24d | 1 | 0.51mi |
| 1125 Lumsden Pointe Blvd Valrico, FL | 4.0 | 2.0 | 1899 | $2,250 | $1.18 | 11d | 1 | 0.63mi |
| 232 Beverly Blvd Brandon, FL | 3.0 | 1.0 | 1595 | $2,000 | $1.25 | 24d | 1 | 0.67mi |
| 855 E Brandon Blvd Brandon, FL | 5.0 | 3.0 | 2464 | $3,000 | $1.22 | 24d | 1 | 0.84mi |
| 811 Innergary Pl Valrico, FL | 4.0 | 3.0 | 2120 | $2,800 | $1.32 | 17d | 1 | 0.99mi |
| 1325 Cadence Ct Brandon, FL | 3.0 | 3.0 | 2718 | $2,999 | $1.10 | 17d | 1 | 1.13mi |
| 1325 Cadence Ct Brandon, FL | 4.0 | 3.0 | 2718 | $2,999 | $1.10 | 24d | 1 | 1.13mi |
| 415 Belle Montclair Loop Unit 430 Brandon, FL | 3.0 | 2.5 | 1615 | $1,929 | $1.19 | 17d | 1 | 1.26mi |
| 415 Belle Montclair Loop Unit 430 Brandon, FL | 3.0 | 2.5 | 1615 | $1,929 | $1.19 | 20d | 1 | 1.26mi |
| 442 Belle Montclair Loop Unit 3-430 Brandon, FL | 3.0 | 2.5 | 1615 | $1,929 | $1.19 | 24d | 1 | 1.29mi |
| 1427 Main St Valrico, FL | 4.0 | 3.0 | 2208 | $2,831 | $1.28 | 13d | 1 | 1.35mi |
| 644 Chesney Dr Valrico, FL | 4.0 | 3.0 | 2038 | $2,695 | $1.32 | 4d | 1 | 1.38mi |
| 2403 Stonehill Ave Valrico, FL | 4.0 | 2.0 | 2022 | $2,500 | $1.24 | 24d | 1 | 1.42mi |
| 2427 Camden Oaks Pl Valrico, FL | 4.0 | 2.0 | 1734 | $3,250 | $1.87 | 3d | 1 | 1.48mi |
HOA detail
- Monthly dues
- $63 · $756/yr
- Likely covers
- pool
Listing history 5 events
-
2026-06-13statusdays on market $291,500 Pending 6 DOM
-
2026-06-09days on market $291,500 Active 5 DOM
-
2026-06-08days on market $291,500 Active 4 DOM
-
2026-06-07remarks 699-char remark
-
2026-06-07$291,500 Active 3 DOM
ⓘ Source: listings_history table (triggers on properties + properties_extension) + one-shot
backfill from property_details.listing_events for pre-trigger history.
Tax reassessment forecast FL · Resets to sale price
- Current annual tax
- $745 · $62/mo
- Projected year-2 tax
- $2,419 · $202/mo
- Expected delta
- +$1,674/yr (+$140/mo · 224.6%)
ⓘ Screening estimate from a state-policy table — verify with the county assessor before closing.
Climate risk First Street
- Flood 1/10 Low FEMA zone X (unshaded) · 0% chance over 30 yrs
- Wildfire 1/10 Low
- Heat 10/10 Extreme 7 d/yr ≥109°F today · 25 d/yr by 30 yrs out
- Wind 9/10 Extreme 99% chance of damaging wind over 30 yrs
- Air quality 4/10 Moderate 4 unhealthy d/yr today · 5 by 30 yrs out
Nearby sold comps map
Loading sold comps map…
Walkable amenities ~0.75 mi
Loading nearby amenities…
Taxation est. · year 1
- Rental income
- $30,925
- − Mortgage interest
- −$16,329
- − Property taxes
- −$745
- − Insurance
- −$1,458
- − Repairs & maintenance
- −$2,474
- − Management
- −$2,474
- − HOA
- −$756
- − Depreciation
- −$8,480
- Taxable loss
- −$1,790
- Est. tax savings @ 24.0%
- +$430
- After-tax cash flow
- $3,558/yr
For passive investors: Depreciation is non-cash, so a rental often shows a tax loss while cash-flowing — sheltering income. Rental losses are passive: they offset passive income freely, and up to $25,000/yr can offset ordinary (W-2) income if you actively participate and your MAGI is under $100k (phasing out to $0 by $150k); unused losses carry forward. On sale, claimed depreciation is recaptured at up to 25%, and gains may owe capital-gains tax (a 1031 exchange can defer both). Figures are a year-1 estimate at your 24.0% rate — not tax advice; consult a CPA.
Schools (NCES district)
- District
- Hillsborough
- NCES district ID
- 1200870
- Math proficiency
- 47% ▼ -8.00%
- Reading proficiency
- 50% ▼ -4.00%
- Median HH income
- $50,622
- Composite
- 41.6/100
- National rank
- #3435
- State rank
- #41 of 73 in FL
Livability — Brandon
- Score
- 85/100
- State rank
- #26
- US rank
- #507
Category grades
Schools grade is shown separately in the Schools card above.
Census & demographics
- Census place
- Brandon, FL
- County
- Hillsborough County · 1,540,968 people
- City population
- 92,716
- Metro
- Tampa-St. Petersburg-Clearwater, FL
- Population (ZIP)
- 62,138
- Household income
- $81,301
- Rent vs Own
- Severe rent burden
- 3073.0
Population outlook (Hillsborough County) Hauer SSP2
- Today (2025)
- 1,607,022 people
- By 2030
- 1,733,968 · +7.9%
- By 2040
- 1,979,565 · +23.2%
- By 2050
- 2,203,427 · +37.1%
- By 2075
- 2,667,893 · +66.0%
- By 2100
- 2,891,558 · +79.9%
Race, ethnicity, and origin ACS 2023
- Neighborhood character
- Diverse neighborhood (Simpson 0.68)
- Race & ethnicity
- White 45% Hispanic / Latino 30% Two or more races 18% Black 15% Asian 4%
- Hispanic origin (detail)
- Mexican 3% Puerto Rican 10% Cuban 6% Dominican 2%
- Common ancestry
- Romanian 2% Lithuanian 2% Slovak 2%
- Foreign-born
- 18% · Canada, Jamaica
- Languages at home
- 72% English-only · Spanish 22% Other Indo-European 2% Other Asian/Pacific 1%
Political lean MEDSL · Hillsborough
- 2024 margin
- Toss-up / Even · D 47.8% · R 50.9% · Other 1.3%
- 2008→2024 swing
- -10.2pp toward R · 2008: 7.1pp · 2024: -3.1pp
- All cycles
- 2024: R+3.1 2020: D+6.9 2016: D+6.8 2012: D+6.7 2008: D+7.1
Not yet ingested
- Civics
- —
Market trends
- HPI YoY
- ▼ -279.49%
- Current HPI
- 333.4744
- Rent YoY
- ▼ -1.17%
- Metro
- Tampa-St. Petersburg-Clearwater, FL
- State GDP YoY
- ▲ 3.28%
- F500 in state
- 36
Industry mix (Fortune 500 HQ in FL)
| Industry | F500 HQs | Revenue |
|---|---|---|
| Industrial Technology | 2 | $29B |
|
||
| Insurance | 2 | $17B |
|
||
| Retail | 1 | $60B |
|
||
| Technology Distribution | 1 | $58B |
|
||
| Homebuilding | 1 | $35B |
|
||
| Technology Manufacturing | 1 | $35B |
|
||
Price history
+44.0% since first listed14 events — show timeline
- 2026-06-04 Listed $291,500 Stellar MLS as Distributed by MLS Grid
- 2020-08-27 Sold (MLS) $285,000 Stellar MLS as Distributed by MLS Grid
- 2020-07-15 Pending — Stellar MLS as Distributed by MLS Grid
- 2020-06-22 Relisted — Stellar MLS as Distributed by MLS Grid
- 2020-05-29 Pending — Stellar MLS as Distributed by MLS Grid
- 2020-05-27 Price Changed $285,000 Stellar MLS as Distributed by MLS Grid
- 2020-05-02 Price Changed $289,000 Stellar MLS as Distributed by MLS Grid
- 2020-04-20 Listed $299,000 Stellar MLS as Distributed by MLS Grid
- 2004-08-16 Sold (Public Records) $218,000 Public Records
- 2004-07-30 Sold (MLS) $218,000 Stellar MLS as Distributed by MLS Grid
- 2004-06-16 Listed $219,900 Stellar MLS as Distributed by MLS Grid
- 2004-06-15 Listing Removed — Stellar MLS as Distributed by MLS Grid
- 2004-02-07 Listed $226,500 Stellar MLS as Distributed by MLS Grid
- 1998-01-30 Sold (Public Records) $202,500 Public Records
Property tax history
-7.9%/yrLatest (2025): $745 · +4.0% YoY. Source: county tax records.
Cash-flow waterfall
monthlySold comps — $/sqft
last 12 mo · ≤1 miLoading sold comps…