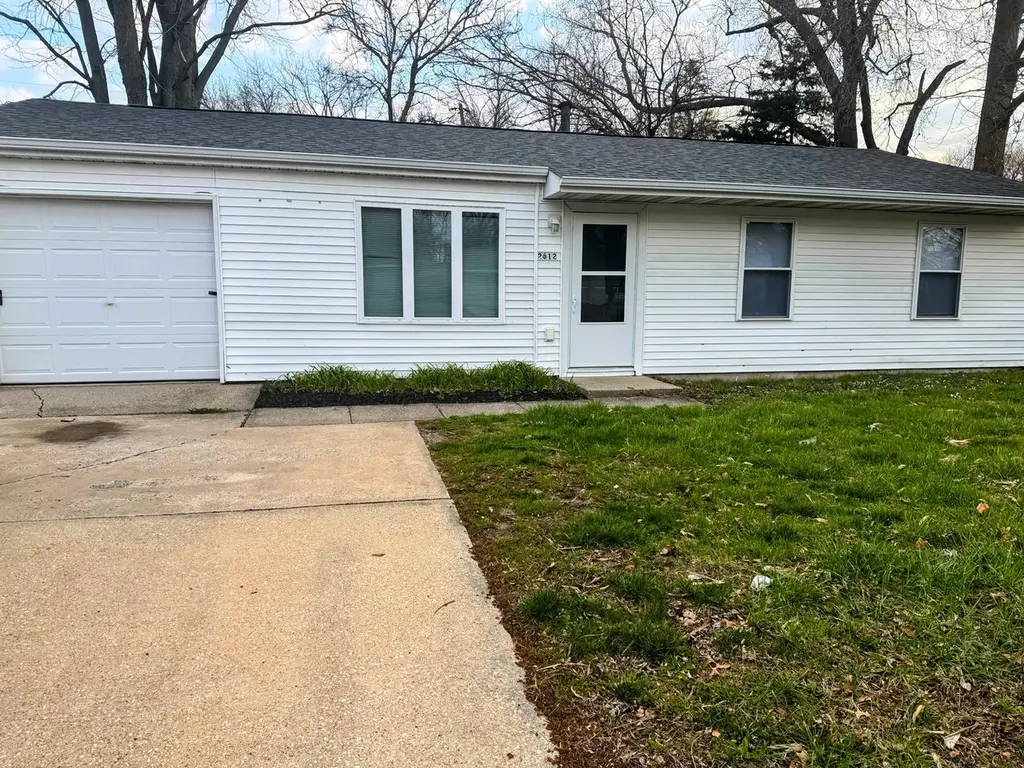
2612 W Kirby Ave · Champaign, IL
Flood risk 1/10 · Minimal
- FEMA flood zone
- X (unshaded)
- Chance of flooding over 30 yrs
- 0.0%
- Est. flood insurance / yr
- $507 – $1,088
Fire risk 1/10 · Minimal
- Est. fire insurance / yr
- $804 – $1,492
Heat risk 3/10 · Minor
- Hot days now (above 103°F)
- 7 days/yr
- Hot days in 30 yrs
- 19 days/yr
Wind risk 2/10 · Minimal
- Chance of severe wind over 30 yrs
- 1.0%
Air-quality risk 2/10 · Minimal
- Unhealthy air days now
- 0 days/yr
- Unhealthy air days in 30 yrs
- 1 days/yr
Risk factors via First Street. Map © Google.
Why this score? — see what drove the C+ grade
The composite is a weighted blend of 9 inputs, each scored 0–100. Each bar is that input's sub-score; the figure is the points it added to the 100-point composite (weight × sub-score).
- Cash flow +24.2/30.0
- ARV discount +9.9/15.0
- DSCR +7.8/10.0
- 1% rule +6.1/10.0
- Rent growth +4.8/5.0
- Livability +4.2/5.0
- Condition / age +2.5/5.0
- Schools +2.2/10.0
- Appreciation +0.0/10.0
$164,999
🖨 Deal sheet 📄 Offer letter ✓ Due diligence
Listing remarks MLS
Welcome home! This beautifully remodeled 4-bedroom, 1-bath gem is truly move-in ready and filled with fresh, modern touches throughout. Step inside to a stunning new kitchen featuring stylish finishes and updated fixtures-perfect for everyday living and easy entertaining. The fully renovated bathroom offers a clean, contemporary feel, while new wood laminate flooring flows seamlessly through the home, adding warmth and durability. Every detail has been thoughtfully updated to create a bright, inviting space that still feels comfortable and cozy. With four spacious bedrooms, you'll have plenty of flexibility for a growing household, a home office, or guest space. Whether you're a first-time buyer or looking for a smart investment, this home checks all the boxes. With extensive updates already done, you'll enjoy low maintenance and peace of mind for years to come. It's the perfect blend of modern style, comfort, and versatility-ready for you to move right in and make it your own!
Key facts
- Remodeled kitchen
- Extensive updates
- 7,535 sq ft lot
Tags
Neighborhood map
What this means for you Summary
Snapshot
- This is a 4-bed/1.0-bath single-family listed at $165k.
Deal economics
- At list price, monthly cash flow is $328 ($4k/yr) — positive.
- The deal already cash-flows at list — no discount required.
- Meets the 1% rule at list price ($2k rent vs $165k).
- Recommended offer: $163k (1.5% below list) — sets the bar for market timing.
- Cap rate 8.7% vs local median 3.8% in Champaign — top-decile yield for the area; either an underpriced asset or a hidden risk that comps aren't pricing in. Stress-test before assuming the spread holds.
Location & tenants
- Location reads 83/100 on livability (#44 in IL, #902 nationally) — a professional / high-income tenant draw. Strengths: commute A+, cost of living A+, housing A+; Watch: crime F.
- Champaign CUSD 4 (urban): math 24% / reading 26% proficiency, ranked #333 of 620 in IL (top 54%) — low school quality limits family demand, transient renter base, plan for 1-2y turnover.
- Market conditions: Rents rising fast (+9.3%/yr); 89 active listings in the ZIP; 7 comparable units currently listed for rent nearby; rentals leasing fast (median 14d on market — plan ~1-2 weeks tenant-placement turnaround); 573 units permitted in Champaign County in 2024 (359 in 5+ unit buildings).
- This rent runs 31% of the median local income ($71k/yr) — at the standard rent-burdened threshold; future hikes will face affordability resistance.
Forward outlook
- Local home prices are declining (-3.0%/yr); year-one equity from $1k of loan paydown is wiped out by about $5k of value loss. Plan a longer hold.
- Champaign County population projected at +15% by 2050 — modest demand growth; plan on rents tracking national, not racing it.
- At projected returns (-3.0% appreciation + 8.0% rent growth), your $46k cash investment doubles in ~8 years — after that, you're playing with house money.
Negotiation context
- It's been on market 27 days — a 2% lower offer ($163k) is reasonable based on typical stale-listing flexibility.
- 7 sale attempts since 15y ago with the ask held roughly flat each time — persistent listings suggest the price (not the market) is what's stuck; bring a comps-based counter.
- Current owner paid $66k; list at $165k implies a 150% gain — meaningful room to come down on a strong offer.
Questions for the listing agent
- Built in 1960 — when were the roof, HVAC, electrical panel, plumbing, and water heater last replaced?
- Is there a deadline driving the sale (1031 exchange, divorce, estate, relocation)? That informs how much negotiation room exists.
- Crime grade is F in this area — have there been break-ins, vandalism, or insurance claims at this property in the last 3 years? What carrier currently insures it and at what premium?
- What's the average days-on-market for RENTAL listings here right now (not sales)? A rising rental-DOM trend means longer vacancies and softer asking-rent achievability than the comps imply.
- What's the recent tenant-quality profile in this submarket — average credit score on applications, eviction rate, late-payment / NSF rate, and stable-employment percentage? A property-management company in the area should have these aggregated.
- How much new for-sale + rental construction is in the pipeline within 1–3 miles? Heavy new supply typically softens prices + rents 12–24 months out; constrained supply supports both.
Investment metrics
- 1% rule
- 1.11% ✓
- Cap rate
- 8.68%
- Cash-on-cash
- 8.51%
- DSCR
- 1.38
- GRM
- 7.5
CMA / ARV
- ARV (median comp)
- $174,379
- List price
- $164,999
- Delta
- -5.38%
- Verdict
- FAIR
- Comps
- 20 within 1.0 mi
Show comp detail 12 sales within ~0.75 mi
| Address | Dist | Beds/Ba | Sqft | Sold | Price | $/sf | Match |
|---|---|---|---|---|---|---|---|
| 2412 Lawndale Dr | 0.17mi | 3/1.0 (-1) | 1,167 (-5%) | 1mo | $150,000 | $129 | 79 |
| 2704 W Kirby Ave | 0.04mi | 3/1.0 (-1) | 1,095 (-11%) | 0mo | $173,000 | $158 | 76 |
| 1818 Stratford Dr | 0.34mi | 4/2.0 | 1,194 (-2%) | 1mo | $287,000 | $240 | 75 |
| 1402 Scottsdale Dr | 0.17mi | 3/1.0 (-1) | 1,323 (+8%) | 6mo | $185,000 | $140 | 69 |
| 2705 Willowpark Dr | 0.15mi | 3/1.0 (-1) | 1,053 (-14%) | 1mo | $190,000 | $180 | 64 |
| 2003 W Kirby Ave | 0.53mi | 4/1.0 | 1,130 (-8%) | 1mo | $175,000 | $155 | 61 |
| 1904 Scottsdale Dr | 0.46mi | 3/2.0 (-1) | 1,278 (+4%) | 3mo | $225,000 | $176 | 60 |
| 1601 Carolyn Dr | 0.29mi | 3/1.0 (-1) | 1,073 (-12%) | 3mo | $157,500 | $147 | 59 |
| 1821 Alder Ln | 0.73mi | 4/2.0 | 1,212 (-1%) | 3mo | $194,000 | $160 | 58 |
| 2409 W John St | 0.73mi | 3/1.0 (-1) | 1,181 (-4%) | 0mo | $195,000 | $165 | 55 |
| 901 Dogwood Dr | 0.72mi | 5/2.0 (+1) | 1,161 (-5%) | 4mo | $170,000 | $146 | 45 |
| 902 Oakcrest Dr | 0.58mi | 3/1.0 (-1) | 1,072 (-12%) | 2mo | $170,000 | $159 | 45 |
Match score weights: distance 35% · size 25% · config 20% · recency 20%. Top-matched comps best support the ARV.
Projected returns pro-forma
-3.0% appreciation · 8.0% rent growth · sell at horizon
- IRR
- 2.1%
- Equity multiple
- 1.08×
- Total profit
- $3,853
- Equity at exit
- $24,602
- IRR
- 16.0%
- Equity multiple
- 2.61×
- Total profit
- $74,443
- Equity at exit
- $14,266
Cash invested: $46,200 (down + closing). Projections, not guarantees.
Landlord ↔ Tenant lean methodology
- Overall (STATE)
- 43 Moderately Tenant-Leaning
- State Illinois
- 43 Moderately Tenant-Leaning · D+7
- County
- — inherits STATE
- City
- — inherits STATE
ZIP-level market 61821
- Home prices YoY
- -26.1%
- Rents YoY
- 9.3%
- Active inventory
- 89
- Price-to-rent
- 7.5×
Monthly cashflow live
- Estimated rent
- $1,835 high interval (Pro) →
- Mortgage (P&I)
- −$865
- Tax from tax record
- −$188 /mo · $2,256/yr
- Insurance
- −$69
- HOA
- −$0
- Vacancy / Maint / Mgmt
- −$385
- Net cashflow
- $328
Break-even live
UW: 25.0% down · 7.5% · 30yr · 1.5% tax · 5.0% vac · 8.0% maint · 8.0% mgmt
Financing live
Cash to close
- Down payment
- $41,250
- Closing costs
- $4,950
- Reserves months
- —
- Total cash needed
- —
Loan-product check · same deal, 3 products live
Conventional
25% down · 7.5% · 30yr
- Down + closing
- —
- Monthly P&I
- —
- Monthly cashflow
- —
- DSCR
- —
- Eligible?
- —
Personal DTI + credit; lowest rate.
DSCR
20% down · 8.5% · 30yr
- Down + closing
- —
- Monthly P&I
- —
- Monthly cashflow
- —
- DSCR
- —
- Eligible?
- —
No personal income docs; deal must DSCR.
Hard money
10% down · 12.0% · 12mo
- Down + closing
- —
- Monthly P&I
- —
- Monthly cashflow
- —
- DSCR
- —
- Eligible?
- —
Short-term bridge; refi at stabilization.
Rent comps 7 comps
| Address | Beds | Baths | Sqft | Rent | $/sqft | DOM | Units | Dist |
|---|---|---|---|---|---|---|---|---|
| 910 S Duncan Rd Champaign, IL | 3.0 | 1.0 | 1050 | $1,400 | $1.33 | 43d | 1 | 0.57mi |
| 1902 Meadow Dr Champaign, IL | 3.0 | 1.0 | 898 | $1,750 | $1.95 | 13d | 1 | 0.62mi |
| 618 Dogwood Dr Champaign, IL | 3.0 | 1.0 | 1073 | $2,200 | $2.05 | 13d | 1 | 0.84mi |
| 1915 S Mattis Ave Champaign, IL | 1.0–3.0 | 1.0–2.0 | 971 | $2,099 | $2.16 | 13d | 11 | 0.85mi |
| 1801 W John St Unit 1821 Champaign, IL | 3.0 | 1.5 | 1200 | $1,390 | $1.16 | 13d | 1 | 0.94mi |
| 1801 W John St Unit 723 Champaign, IL | 3.0 | 1.5 | 1200 | $1,390 | $1.16 | 21d | 1 | 0.94mi |
| 3907 Balmoral Dr Champaign, IL | 3.0 | 2.5 | 1452 | $1,995 | $1.37 | 13d | 1 | 1.16mi |
Listing history 33 events
-
2026-06-18days on market $164,999 Active 27 DOM
-
2026-06-17days on market $164,999 Active 26 DOM
-
2026-06-16days on market $164,999 Active 25 DOM
-
2026-06-15days on market $164,999 Active 24 DOM
-
2026-06-14days on market $164,999 Active 22 DOM
-
2026-06-13days on market $164,999 Active 21 DOM
-
2026-06-10days on market $164,999 Active 160 DOM
-
2026-06-09days on market $164,999 Active 159 DOM
-
2026-06-09price $164,999 Active 158 DOM
-
2026-06-08days on market $167,900 Active 158 DOM
-
2026-06-07days on market $167,900 Active 157 DOM
-
2026-06-05days on market $167,900 Active 154 DOM
-
2026-06-03days on market $167,900 Active 153 DOM
-
2026-06-02days on market $167,900 Active 152 DOM
-
2026-06-01days on market $167,900 Active 151 DOM
-
2026-05-31days on market $167,900 Active 150 DOM
-
2026-05-30days on market $167,900 Active 149 DOM
-
2026-04-21price $167,900 992-char remark
Show marketing remark (992 chars)
Welcome home! This beautifully remodeled 4-bedroom, 1-bath gem is truly move-in ready and filled with fresh, modern touches throughout. Step inside to a stunning new kitchen featuring stylish finishes and updated fixtures-perfect for everyday living and easy entertaining. The fully renovated bathroom offers a clean, contemporary feel, while new wood laminate flooring flows seamlessly through the home, adding warmth and durability. Every detail has been thoughtfully updated to create a bright, inviting space that still feels comfortable and cozy. With four spacious bedrooms, you'll have plenty of flexibility for a growing household, a home office, or guest space. Whether you're a first-time buyer or looking for a smart investment, this home checks all the boxes. With extensive updates already done, you'll enjoy low maintenance and peace of mind for years to come. It's the perfect blend of modern style, comfort, and versatility-ready for you to move right in and make it your own!
-
2026-01-01$169,900 Active 992-char remark
Show marketing remark (992 chars)
Welcome home! This beautifully remodeled 4-bedroom, 1-bath gem is truly move-in ready and filled with fresh, modern touches throughout. Step inside to a stunning new kitchen featuring stylish finishes and updated fixtures-perfect for everyday living and easy entertaining. The fully renovated bathroom offers a clean, contemporary feel, while new wood laminate flooring flows seamlessly through the home, adding warmth and durability. Every detail has been thoughtfully updated to create a bright, inviting space that still feels comfortable and cozy. With four spacious bedrooms, you'll have plenty of flexibility for a growing household, a home office, or guest space. Whether you're a first-time buyer or looking for a smart investment, this home checks all the boxes. With extensive updates already done, you'll enjoy low maintenance and peace of mind for years to come. It's the perfect blend of modern style, comfort, and versatility-ready for you to move right in and make it your own!
-
2025-12-31historical
-
2025-10-31Active
-
2022-04-15soldstatus $66,000 Closed
-
2022-03-15status Pending
-
2022-03-14$66,000 Active
-
2015-02-16historical
-
2014-12-05
-
2014-12-03historical
-
2014-07-01
-
2011-07-21soldstatus $38,000
-
2011-04-18historical
-
2011-04-07$45,000
-
2011-04-06historical
-
2011-04-06
ⓘ Source: listings_history table (triggers on properties + properties_extension) + one-shot
backfill from property_details.listing_events for pre-trigger history.
Tax reassessment forecast IL · Partial reset (capped growth)
- Current annual tax
- $2,256 · $188/mo
- Projected year-2 tax
- $3,001 · $250/mo
- Expected delta
- +$745/yr (+$62/mo · 33.0%)
ⓘ Screening estimate from a state-policy table — verify with the county assessor before closing.
Climate risk First Street
- Flood 1/10 Low FEMA zone X (unshaded) · 0% chance over 30 yrs
- Wildfire 1/10 Low
- Heat 3/10 Moderate 7 d/yr ≥103°F today · 19 d/yr by 30 yrs out
- Wind 2/10 Low 100% chance of damaging wind over 30 yrs
- Air quality 2/10 Low 0 unhealthy d/yr today · 1 by 30 yrs out
Nearby sold comps map
Loading sold comps map…
Walkable amenities ~0.75 mi
Loading nearby amenities…
Taxation est. · year 1
- Rental income
- $22,022
- − Mortgage interest
- −$9,243
- − Property taxes
- −$2,256
- − Insurance
- −$825
- − Repairs & maintenance
- −$1,762
- − Management
- −$1,762
- − Depreciation
- −$4,800
- Taxable income
- $1,375
- Est. tax owed @ 24.0%
- −$330
- After-tax cash flow
- $3,603/yr
For passive investors: Depreciation is non-cash, so a rental often shows a tax loss while cash-flowing — sheltering income. Rental losses are passive: they offset passive income freely, and up to $25,000/yr can offset ordinary (W-2) income if you actively participate and your MAGI is under $100k (phasing out to $0 by $150k); unused losses carry forward. On sale, claimed depreciation is recaptured at up to 25%, and gains may owe capital-gains tax (a 1031 exchange can defer both). Figures are a year-1 estimate at your 24.0% rate — not tax advice; consult a CPA.
Schools (NCES district)
- District
- Champaign CUSD 4
- NCES district ID
- 1709420
- Math proficiency
- 24% ▼ -7.00%
- Reading proficiency
- 26% ▼ -7.00%
- Median HH income
- $45,797
- Composite
- 21.66/100
- National rank
- #8281
- State rank
- #333 of 620 in IL
Livability — Champaign
- Score
- 83/100
- State rank
- #44
- US rank
- #902
Category grades
Schools grade is shown separately in the Schools card above.
Census & demographics
- Census place
- Champaign, IL
- County
- Champaign County · 182,148 people
- City population
- 96,852
- Metro
- Champaign-Urbana, IL
- Population (ZIP)
- 28,611
- Household income
- $70,715
- Rent vs Own
- Severe rent burden
- 1023.0
Population outlook (Champaign County) Hauer SSP2
- Today (2025)
- 223,848 people
- By 2030
- 231,416 · +3.4%
- By 2040
- 244,321 · +9.1%
- By 2050
- 256,432 · +14.6%
- By 2075
- 285,823 · +27.7%
- By 2100
- 296,406 · +32.4%
Race, ethnicity, and origin ACS 2023
- Neighborhood character
- Diverse neighborhood (Simpson 0.61)
- Race & ethnicity
- White 57% Black 23% Asian 8% Hispanic / Latino 8% Two or more races 6%
- Hispanic origin (detail)
- Mexican 4% Puerto Rican 2%
- Common ancestry
- Romanian 4% Lithuanian 2% Slovak 2%
- Foreign-born
- 14% · Canada, China, South Korea
- Languages at home
- 82% English-only · Spanish 5% French/Haitian/Cajun 5% Tagalog/Filipino 2%
Political lean MEDSL · Champaign
- 2024 margin
- Strong D (+24.1) · D 61.3% · R 37.2% · Other 1.5%
- 2008→2024 swing
- +6.6pp toward D · 2008: 17.5pp · 2024: 24.1pp
- All cycles
- 2024: D+24.1 2020: D+22.8 2016: D+18.4 2012: D+6.8 2008: D+17.5
Not yet ingested
- Civics
- —
Market trends
- HPI YoY
- ▼ -78.19%
- Current HPI
- 221.1245
- Rent YoY
- ▲ 9.29%
- Metro
- Champaign-Urbana, IL
- State GDP YoY
- ▲ 1.59%
- F500 in state
- 60
Industry mix (Fortune 500 HQ in IL)
| Industry | F500 HQs | Revenue |
|---|---|---|
| Insurance | 4 | $201B |
|
||
| Consumer Goods | 4 | $87B |
|
||
| Industrial Machinery | 3 | $64B |
|
||
| Healthcare | 2 | $55B |
|
||
| Retail / Pharmacy | 1 | $148B |
|
||
| Agriculture / Food | 1 | $86B |
|
||
Price history
+273.1% since first listed16 events — show timeline
- 2026-04-21 Price Changed $167,900 MRED as Distributed by MLS Grid
- 2026-01-01 Listed $169,900 MRED as Distributed by MLS Grid
- 2025-12-31 Listing Removed — MRED as Distributed by MLS Grid
- 2025-10-31 Listed — MRED as Distributed by MLS Grid
- 2022-04-15 Sold (MLS) $66,000 MRED as Distributed by MLS Grid
- 2022-03-15 Pending — MRED as Distributed by MLS Grid
- 2022-03-14 Listed $66,000 MRED as Distributed by MLS Grid
- 2015-02-16 Listing Removed — MRED as Distributed by MLS Grid
- 2014-12-05 Listed — MRED as Distributed by MLS Grid
- 2014-12-03 Listing Removed — MRED as Distributed by MLS Grid
- 2014-07-01 Listed — MRED as Distributed by MLS Grid
- 2011-07-21 Sold (MLS) $38,000 MRED as Distributed by MLS Grid
- 2011-04-18 Listing Removed — MRED as Distributed by MLS Grid
- 2011-04-07 Listed $45,000 MRED as Distributed by MLS Grid
- 2011-04-06 Listed — MRED as Distributed by MLS Grid
- 2011-04-06 Listing Removed — MRED as Distributed by MLS Grid
Property tax history
+7.6%/yrLatest (2024): $2,256 · -13.8% YoY. Source: county tax records.
Cash-flow waterfall
monthlySold comps — $/sqft
last 12 mo · ≤1 miLoading sold comps…