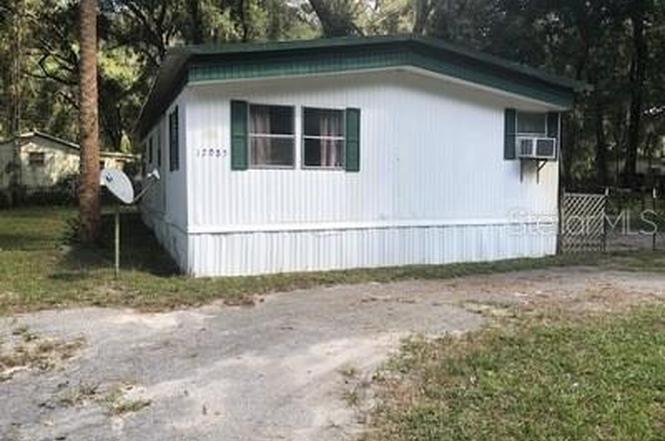
17085 NE 36th Ave · Reddick, FL
Flood risk 1/10 · Minimal
- FEMA flood zone
- X (unshaded)
- Chance of flooding over 30 yrs
- 0.0%
- Est. flood insurance / yr
- $507 – $1,088
Fire risk 7/10 · Major
- Est. fire insurance / yr
- $947 – $1,759
Heat risk 8/10 · Major
- Hot days now (above 108°F)
- 7 days/yr
- Hot days in 30 yrs
- 20 days/yr
Wind risk 9/10 · Severe
- Chance of severe wind over 30 yrs
- 99.0%
Air-quality risk 3/10 · Minor
- Unhealthy air days now
- 2 days/yr
- Unhealthy air days in 30 yrs
- 4 days/yr
Risk factors via First Street. Map © Google.
Why this score? — see what drove the B- grade
The composite is a weighted blend of 9 inputs, each scored 0–100. Each bar is that input's sub-score; the figure is the points it added to the 100-point composite (weight × sub-score).
- Cash flow +30.0/30.0
- 1% rule +10.0/10.0
- DSCR +10.0/10.0
- ARV discount +7.5/15.0
- Schools +3.6/10.0
- Livability +2.9/5.0
- Rent growth +2.5/5.0
- Condition / age +2.5/5.0
- Appreciation +0.0/10.0
$67,000
🖨 Deal sheet (PDF) 📄 Offer letter ✓ Due diligence
Listing remarks MLS
Add your own touches to this 2bed 2bath Double Wide Home. Inside walls were gutted to studs in 2012 re-insulated, drywalled and floorboards fixed, and new flooring installed. Home now features 3 bedrooms, a bonus room, a walk-in closet, laundry room one full bathroom and another that's half but ready for a shower or a bath. Custom Kitchen Cabinets and Entertainment Center. Fenced yard. Shed has 220 electric and water. Needs some TLC.
Key facts
- 9,148 sq ft lot
- Built 1981
- Listed 146 days
Neighborhood map
What this means for you Summary
Snapshot
- This is a 2-bed/2.0-bath manufactured listed at $67k.
Deal economics
- At list price, monthly cash flow is $403 ($5k/yr) — positive.
- The deal already cash-flows at list — no discount required.
- Meets the 1% rule at list price ($1k rent vs $67k).
- Recommended offer: $59k (12.0% below list) — sets the bar for market timing.
- Cap rate 13.5% vs local median 1.7% in Reddick — top-decile yield for the area; either an underpriced asset or a hidden risk that comps aren't pricing in. Stress-test before assuming the spread holds.
Location & tenants
- Location reads 58/100 on livability (#845 in FL) — a working-class tenant base; expect higher turnover. Strengths: cost of living A+, housing A+; Watch: crime D, amenities F, commute F.
- Marion (rural): math 42% / reading 43% proficiency, ranked #61 of 73 in FL (top 84%) — families likely to look elsewhere, expect single-tenant / working-renter base with shorter leases; 61% free/reduced lunch — lower-income household profile, screen leases tightly.
- Zoned schools: Sparr Elementary School (math 42% / reading 42%, grade F, #1,403 of 2,144 statewide, top 67%, 425 students, 67% FRL); North Marion High School (math 20% / reading 32%, grade F, #494 of 667 statewide, top 75%, 1,303 students, 66% FRL).
- Market conditions: 142 active listings in the ZIP; 1 comparable units currently listed for rent nearby; 7,071 units permitted in Marion County in 2024 (534 in 5+ unit buildings).
Forward outlook
- Local home prices are declining (-3.0%/yr); year-one equity from $463 of loan paydown is wiped out by about $2k of value loss. Plan a longer hold.
- Marion County population projected at +13% by 2050 — modest demand growth; plan on rents tracking national, not racing it.
- At projected returns (-3.0% appreciation + 3.0% rent growth), your $19k cash investment doubles in ~5 years — after that, you're playing with house money.
Negotiation context
- It's been on market 146 days — a 12% lower offer ($59k) is reasonable based on typical stale-listing flexibility.
- 4 sale attempts since 20y ago; this cycle's ask has dropped $13k (16%) from the opening price — seller is motivated, your offer sets the floor, not the list.
- Current owner paid $20k; list at $67k implies a 235% gain — meaningful room to come down on a strong offer.
Risks & watch-outs
- Climate carrying-cost: severe wind risk, 99% chance of damaging wind over 30y; major wildfire risk; extreme-heat days projected 7→20/yr by 2055 (HVAC capex compounding) — expect insurance premiums to compound above CPI over the hold.
Questions for the listing agent
- It's been on market 146 days. Have you received any prior offers? Is the seller open to a 12% concession, seller financing, or rate buy-down credit?
- Why hasn't it sold? Are there any deal-killer items the seller is aware of (foundation, flood, title, zoning, code violations)?
- Is there a deadline driving the sale (1031 exchange, divorce, estate, relocation)? That informs how much negotiation room exists.
- Schools are D-rated, which usually means shorter tenancies and higher turnover. Who's the typical renter profile here, and what's been the actual vacancy rate?
- Crime grade is D in this area — have there been break-ins, vandalism, or insurance claims at this property in the last 3 years? What carrier currently insures it and at what premium?
- What's the average days-on-market for RENTAL listings here right now (not sales)? A rising rental-DOM trend means longer vacancies and softer asking-rent achievability than the comps imply.
- What's the recent tenant-quality profile in this submarket — average credit score on applications, eviction rate, late-payment / NSF rate, and stable-employment percentage? A property-management company in the area should have these aggregated.
- How much new for-sale + rental construction is in the pipeline within 1–3 miles? Heavy new supply typically softens prices + rents 12–24 months out; constrained supply supports both.
Investment metrics
- 1% rule
- 1.64% ✓
- Cap rate
- 13.50%
- Cash-on-cash
- 25.75%
- DSCR
- 2.15
- GRM
- 5.1
CMA / ARV
No comps found within radius.
Projected returns pro-forma
-3.0% appreciation · 3.0% rent growth · sell at horizon
- IRR
- 19.4%
- Equity multiple
- 1.79×
- Total profit
- $14,798
- Equity at exit
- $9,990
- IRR
- 27.7%
- Equity multiple
- 3.45×
- Total profit
- $45,972
- Equity at exit
- $5,793
Cash invested: $18,760 (down + closing). Projections, not guarantees.
Landlord ↔ Tenant lean methodology
- Overall (STATE)
- 87 Strongly Landlord-Friendly
- State Florida
- 87 Strongly Landlord-Friendly · R+3
- County
- — inherits STATE
- City
- — inherits STATE
ZIP-level market 32113
- Home prices YoY
- -5.5%
- Active inventory
- 142
- Price-to-rent
- 5.1×
Monthly cashflow live
- Estimated rent
- $1,100 medium interval (Pro) →
- Mortgage (P&I)
- −$351
- Tax from tax record
- −$87 /mo · $1,047/yr
- Insurance
- −$28
- HOA
- −$0
- Vacancy / Maint / Mgmt
- −$231
- Net cashflow
- $403
Break-even live
Sensitivity live
| Price | -10% $440 | -5% $421 | +0% $403 | +5% $384 | +10% $365 |
|---|---|---|---|---|---|
| Rent | -10% $316 | -5% $359 | +0% $403 | +5% $446 | +10% $489 |
| Rate | -1.0pp $436 | -0.5pp $420 | base $403 | +0.5pp $385 | +1.0pp $367 |
UW: 25.0% down · 7.5% · 30yr · 1.5% tax · 5.0% vac · 8.0% maint · 8.0% mgmt
Financing live
Cash to close
- Down payment
- $16,750
- Closing costs
- $2,010
- Reserves months
- —
- Total cash needed
- —
Loan-product check · same deal, 3 products live
Conventional
25% down · 7.5% · 30yr
- Down + closing
- —
- Monthly P&I
- —
- Monthly cashflow
- —
- DSCR
- —
- Eligible?
- —
Personal DTI + credit; lowest rate.
DSCR
20% down · 8.5% · 30yr
- Down + closing
- —
- Monthly P&I
- —
- Monthly cashflow
- —
- DSCR
- —
- Eligible?
- —
No personal income docs; deal must DSCR.
Hard money
10% down · 12.0% · 12mo
- Down + closing
- —
- Monthly P&I
- —
- Monthly cashflow
- —
- DSCR
- —
- Eligible?
- —
Short-term bridge; refi at stabilization.
Rent comps 1 comps
| Address | Beds | Baths | Sqft | Rent | $/sqft | DOM | Units | Dist |
|---|---|---|---|---|---|---|---|---|
| 17410 NE 37th Ct Citra, FL | 1.0 | 1.0 | 672 | $1,100 | $1.64 | 13d | 1 | 0.35mi |
Listing history 13 events
-
2025-11-20status Pending
-
2025-10-29price $67,000
-
2025-09-11price $69,000
-
2025-08-26price $72,500
-
2025-07-30price $75,000
-
2025-06-27$80,000 Active
-
2018-08-23soldstatus $20,000 437-char remark
Show marketing remark (437 chars)
Add your own touches to this 2bed 2bath Double Wide Home. Inside walls were gutted to studs in 2012 re-insulated, drywalled and floorboards fixed, and new flooring installed. Home now features 3 bedrooms, a bonus room, a walk-in closet, laundry room one full bathroom and another that's half but ready for a shower or a bath. Custom Kitchen Cabinets and Entertainment Center. Fenced yard. Shed has 220 electric and water. Needs some TLC.
-
2018-05-21soldstatus $85,000
-
2018-02-19$25,000 437-char remark
Show marketing remark (437 chars)
Add your own touches to this 2bed 2bath Double Wide Home. Inside walls were gutted to studs in 2012 re-insulated, drywalled and floorboards fixed, and new flooring installed. Home now features 3 bedrooms, a bonus room, a walk-in closet, laundry room one full bathroom and another that's half but ready for a shower or a bath. Custom Kitchen Cabinets and Entertainment Center. Fenced yard. Shed has 220 electric and water. Needs some TLC.
-
2008-04-23historical
-
2008-01-04$29,000
-
2006-08-05soldstatus $16,000
-
2006-04-05$19,900
ⓘ Source: listings_history table (triggers on properties + properties_extension) + one-shot
backfill from property_details.listing_events for pre-trigger history.
Tax reassessment forecast FL · Resets to sale price
- Current annual tax
- $1,047 · $87/mo
- Projected year-2 tax
- $1,047 · $87/mo
- Expected delta
- $0/yr ($0/mo · 0.0%)
ⓘ Screening estimate from a state-policy table — verify with the county assessor before closing.
Climate risk First Street
- Flood 1/10 Low FEMA zone X (unshaded) · 0% chance over 30 yrs
- Wildfire 7/10 Severe
- Heat 8/10 Severe 7 d/yr ≥108°F today · 20 d/yr by 30 yrs out
- Wind 9/10 Extreme 99% chance of damaging wind over 30 yrs
- Air quality 3/10 Moderate 2 unhealthy d/yr today · 4 by 30 yrs out
Nearby sold comps map
Loading sold comps map…
Walkable amenities ~0.75 mi
Loading nearby amenities…
Taxation est. · year 1
- Rental income
- $13,200
- − Mortgage interest
- −$3,753
- − Property taxes
- −$1,047
- − Insurance
- −$335
- − Repairs & maintenance
- −$1,056
- − Management
- −$1,056
- − Depreciation
- −$1,949
- Taxable income
- $4,004
- Est. tax owed @ 24.0%
- −$961
- After-tax cash flow
- $3,869/yr
For passive investors: Depreciation is non-cash, so a rental often shows a tax loss while cash-flowing — sheltering income. Rental losses are passive: they offset passive income freely, and up to $25,000/yr can offset ordinary (W-2) income if you actively participate and your MAGI is under $100k (phasing out to $0 by $150k); unused losses carry forward. On sale, claimed depreciation is recaptured at up to 25%, and gains may owe capital-gains tax (a 1031 exchange can defer both). Figures are a year-1 estimate at your 24.0% rate — not tax advice; consult a CPA.
Schools (NCES district)
- District
- Marion
- NCES district ID
- 1201260
- Math proficiency
- 42% ▼ -7.00%
- Reading proficiency
- 43% ▼ -4.00%
- Median HH income
- $40,015
- Composite
- 35.61/100
- National rank
- #4890
- State rank
- #61 of 73 in FL
Livability — Reddick
- Score
- 58/100
- State rank
- #845
- US rank
- #21164
Category grades
Schools grade is shown separately in the Schools card above.
Census & demographics
- Population (ZIP)
- 5,382
Population outlook (Marion County) Hauer SSP2
- Today (2025)
- 365,905 people
- By 2030
- 376,768 · +3.0%
- By 2040
- 396,555 · +8.4%
- By 2050
- 412,723 · +12.8%
- By 2075
- 446,090 · +21.9%
- By 2100
- 436,193 · +19.2%
Race, ethnicity, and origin ACS 2023
- Neighborhood character
- Predominantly White (67%)
- Race & ethnicity
- White 67% Black 12% Two or more races 11% Hispanic / Latino 10%
- Hispanic origin (detail)
- Mexican 5% Puerto Rican 3% Cuban 1%
- Common ancestry
- Iranian 3% Serbian 2% Slovak 1%
- Foreign-born
- 3% · Canada
- Languages at home
- 93% English-only · Spanish 6% Other Indo-European 1%
Political lean MEDSL · Marion
- 2024 margin
- Solid R (+31.6) · D 33.8% · R 65.5%
- 2008→2024 swing
- -20.0pp toward R · 2008: -11.6pp · 2024: -31.6pp
- All cycles
- 2024: R+31.6 2020: R+25.9 2016: R+26.2 2012: R+16.2 2008: R+11.6
Not yet ingested
- Civics
- —
Market trends
- HPI YoY
- ▼ -16.68%
- Current HPI
- 284.1669
- Rent YoY
- —
- Metro
- —
- State GDP YoY
- ▲ 3.28%
- F500 in state
- 36
Industry mix (Fortune 500 HQ in FL)
| Industry | F500 HQs | Revenue |
|---|---|---|
| Industrial Technology | 2 | $29B |
|
||
| Insurance | 2 | $17B |
|
||
| Retail | 1 | $60B |
|
||
| Technology Distribution | 1 | $58B |
|
||
| Homebuilding | 1 | $35B |
|
||
| Technology Manufacturing | 1 | $35B |
|
||
Price history
+236.7% since first listed13 events — show timeline
- 2025-11-20 Pending — Stellar MLS as Distributed by MLS Grid
- 2025-10-29 Price Changed $67,000 Stellar MLS as Distributed by MLS Grid
- 2025-09-11 Price Changed $69,000 Stellar MLS as Distributed by MLS Grid
- 2025-08-26 Price Changed $72,500 Stellar MLS as Distributed by MLS Grid
- 2025-07-30 Price Changed $75,000 Stellar MLS as Distributed by MLS Grid
- 2025-06-27 Listed $80,000 Stellar MLS as Distributed by MLS Grid
- 2018-08-23 Sold (MLS) $20,000 Stellar MLS as Distributed by MLS Grid
- 2018-05-21 Sold (Public Records) $85,000 Public Records
- 2018-02-19 Listed $25,000 Stellar MLS as Distributed by MLS Grid
- 2008-04-23 Listing Removed — Stellar MLS as Distributed by MLS Grid
- 2008-01-04 Listed $29,000 Stellar MLS as Distributed by MLS Grid
- 2006-08-05 Sold (MLS) $16,000 Stellar MLS as Distributed by MLS Grid
- 2006-04-05 Listed $19,900 Stellar MLS as Distributed by MLS Grid
Property tax history
+6.4%/yrLatest (2025): $1,047 · +45.9% YoY. Source: county tax records.
Cash-flow waterfall
monthlySold comps — $/sqft
last 12 mo · ≤1 miLoading sold comps…