 Triplex
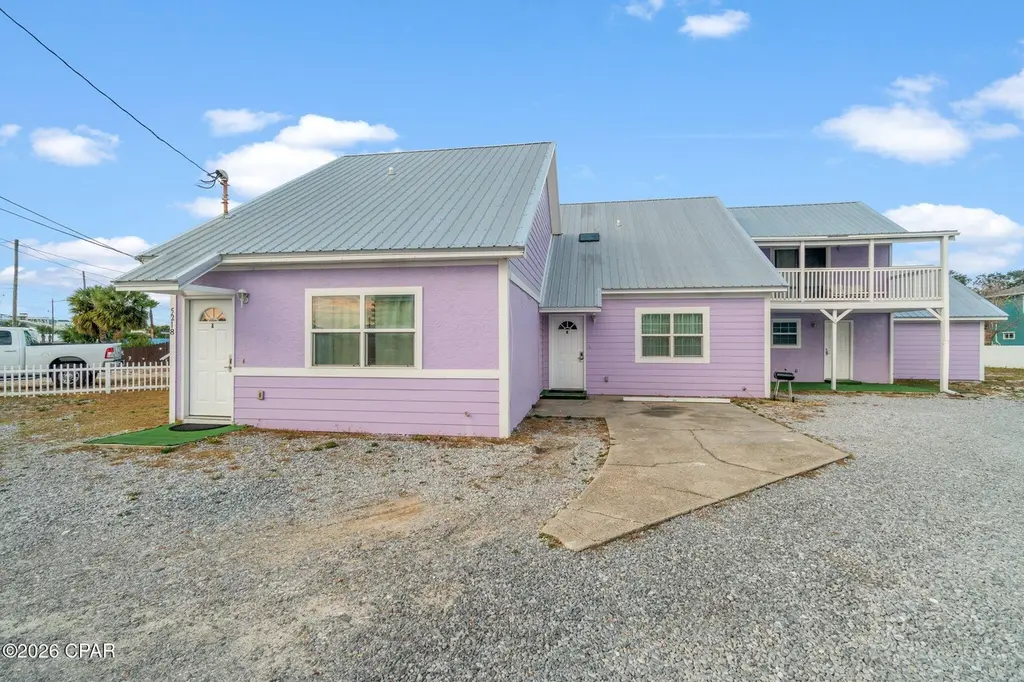
5218 Beach Dr · Lower Grand Lagoon, FL
Flood risk 4/10 · Minor
- FEMA flood zone
- X (unshaded)
- Chance of flooding over 30 yrs
- 0.21%
- Est. flood insurance / yr
- $507 – $1,088
Fire risk 1/10 · Minimal
- Est. fire insurance / yr
- $947 – $1,759
Heat risk 10/10 · Severe
- Hot days now (above 106°F)
- 7 days/yr
- Hot days in 30 yrs
- 22 days/yr
Wind risk 9/10 · Severe
- Chance of severe wind over 30 yrs
- 99.0%
Air-quality risk 1/10 · Minimal
- Unhealthy air days now
- 0 days/yr
- Unhealthy air days in 30 yrs
- 0 days/yr
Risk factors via First Street. Map © Google.
Why this score? — see what drove the F grade
The composite is a weighted blend of 9 inputs, each scored 0–100. Each bar is that input's sub-score; the figure is the points it added to the 100-point composite (weight × sub-score).
- Cash flow +6.4/30.0
- Schools +4.3/10.0
- Livability +3.4/5.0
- Rent growth +3.1/5.0
- Condition / age +2.5/5.0
- DSCR +0.7/10.0
- 1% rule +0.6/10.0
- ARV discount +0.0/15.0
- Appreciation +0.0/10.0
$795,000
🖨 Deal sheet 📄 Offer letter ✓ Due diligence
Multi-family units
County records classify this as Multi-Family (2-4 Unit). Listing-text estimate: 3 units. confirmed
Listing remarks MLS
Attention investors! Income-producing triplex just a short walk to the beach in PCB (4 min walk to Schooners). Perfect for short-term rentals, vacation stays, or long-term tenants. Properties this close to the sand rarely hit the market--strong rental potential and multiple income streams! A - 1 bed + loft, 2 baths. B - 2 bed, 2 bath. C - 2 bed, 2 bath.
Key facts
- 0.27 acre lot
- Built 1992
- Listed 98 days
Tags
Neighborhood map
What this means for you Summary
Snapshot
- This is a 1×1bd/2ba + 2×2bd/2ba units multifamily listed at $795k.
Deal economics
- At list price, monthly cash flow is $-1k ($-16k/yr) — negative. Per door: $-455/mo.
- To cash-flow at today's rent, offer at most $554k (30.4% below list).
- To meet the 1% rule (rent ≥ 1% of price), the offer needs to be $445k (44.1% below list).
- Recommended offer: $445k (44.1% below list) — sets the bar for 1% rule.
- Cap rate 4.2% vs local median 2.1% in Lower Grand Lagoon — top-decile yield for the area; either an underpriced asset or a hidden risk that comps aren't pricing in. Stress-test before assuming the spread holds.
Location & tenants
- Location reads 68/100 on livability (#518 in FL) — a middle-class / working-renter tenant base. Strengths: crime A+, housing A+, employment B; Watch: schools D-, amenities F, commute F.
- Bay (suburban): math 51% / reading 51% proficiency, ranked #29 of 73 in FL (top 40%) — acceptable for families but not a draw, mixed tenant base, ~2y average lease.
- Market conditions: Rents rising (+2.5%/yr); 1022 active listings in the ZIP; 1 comparable units currently listed for rent nearby; solid renter incomes; 2,473 units permitted in Bay County in 2024 (559 in 5+ unit buildings).
- At $4,448/mo this rent would consume 66% of the median local household income ($81k/yr) (locally 817% of renters already pay >50% of income on rent) — very limited rent-growth headroom before tenants either downsize or default.
Forward outlook
- Local home prices are declining (-3.0%/yr); year-one equity from $5k of loan paydown is wiped out by about $24k of value loss. Plan a longer hold.
- Bay County population projected at +24% by 2050 — long-run rental-demand tailwind backs the buy-and-hold thesis.
Negotiation context
- It's been on market 99 days — a 9% lower offer ($723k) is reasonable based on typical stale-listing flexibility.
Risks & watch-outs
- Climate carrying-cost: severe wind risk, 99% chance of damaging wind over 30y; extreme-heat days projected 7→22/yr by 2055 (HVAC capex compounding) — expect insurance premiums to compound above CPI over the hold.
Questions for the listing agent
- What do current leases actually rent for vs. the listed asking? Can we see a recent rent roll and the last 12 months of T-12 income?
- It's been on market 99 days. Have you received any prior offers? Is the seller open to a 44% concession, seller financing, or rate buy-down credit?
- Can we see the unit-by-unit rent roll, current vacancy, and any below-market leases? What's the average tenancy length?
- What capital expenditures (roof, boiler, parking lot, exteriors) have been made in the last 5 years, and what's planned in the next 2?
- Why hasn't it sold? Are there any deal-killer items the seller is aware of (foundation, flood, title, zoning, code violations)?
- Is there a deadline driving the sale (1031 exchange, divorce, estate, relocation)? That informs how much negotiation room exists.
- Schools are D-rated, which usually means shorter tenancies and higher turnover. Who's the typical renter profile here, and what's been the actual vacancy rate?
- The area grade is low — what's the realistic commute time and amenity access for the typical tenant pool here? Any planned neighborhood developments (good or bad) we should know about?
- What's the average days-on-market for RENTAL listings here right now (not sales)? A rising rental-DOM trend means longer vacancies and softer asking-rent achievability than the comps imply.
- What's the recent tenant-quality profile in this submarket — average credit score on applications, eviction rate, late-payment / NSF rate, and stable-employment percentage? A property-management company in the area should have these aggregated.
- How much new apartment / multifamily construction is in the pipeline within 1–3 miles? Heavy new supply (>2% of stock underway) typically softens rents 12–24 months out; light construction supports rent growth.
Investment metrics
- 1% rule
- 0.56% ✗
- Cap rate
- 4.23%
- Cash-on-cash
- -7.37%
- DSCR
- 0.67
- GRM
- 14.9
CMA / ARV
- ARV (median comp)
- $562,396
- List price
- $795,000
- Delta
- 41.36%
- Verdict
- OVERPRICED
- Comps
- 7 within 1.0 mi
Projected returns pro-forma
-3.0% appreciation · 2.55% rent growth · sell at horizon
- IRR
- -29.6%
- Equity multiple
- 0.02×
- Total profit
- $-218,168
- Equity at exit
- $118,537
- IRR
- -32.5%
- Equity multiple
- -0.40×
- Total profit
- $-311,453
- Equity at exit
- $68,737
Cash invested: $222,600 (down + closing). Projections, not guarantees.
Landlord ↔ Tenant lean methodology
- Overall (STATE)
- 87 Strongly Landlord-Friendly
- State Florida
- 87 Strongly Landlord-Friendly · R+3
- County
- — inherits STATE
- City
- — inherits STATE
ZIP-level market 32408
- Rents YoY
- 2.5%
- Active inventory
- 1022
- Price-to-rent
- 46.1×
Monthly cashflow live
- Estimated rent
- $4,448 high interval (Pro) →
- Mortgage (P&I)
- −$4,169
- Tax from tax record
- −$380 /mo · $4,560/yr
- Insurance
- −$331
- HOA
- −$0
- Vacancy / Maint / Mgmt
- −$934
- Net cashflow
- $-1,366
Break-even live
3-unit breakdown (identical units grouped — click to expand)
| Units | Beds | Baths | Est. rent |
|---|---|---|---|
| 1× unit | 1 | 2 | $1,438 |
| 2× units | 2 | 2 | $3,010 |
| #2 | 2 | 2 | $1,505 |
| #3 | 2 | 2 | $1,505 |
| Total (3 units) | $4,448 | ||
UW: 25.0% down · 7.5% · 30yr · 1.5% tax · 5.0% vac · 8.0% maint · 8.0% mgmt
Financing live
Cash to close
- Down payment
- $198,750
- Closing costs
- $23,850
- Reserves months
- —
- Total cash needed
- —
Loan-product check · same deal, 3 products live
Conventional
25% down · 7.5% · 30yr
- Down + closing
- —
- Monthly P&I
- —
- Monthly cashflow
- —
- DSCR
- —
- Eligible?
- —
Personal DTI + credit; lowest rate.
DSCR
20% down · 8.5% · 30yr
- Down + closing
- —
- Monthly P&I
- —
- Monthly cashflow
- —
- DSCR
- —
- Eligible?
- —
No personal income docs; deal must DSCR.
Hard money
10% down · 12.0% · 12mo
- Down + closing
- —
- Monthly P&I
- —
- Monthly cashflow
- —
- DSCR
- —
- Eligible?
- —
Short-term bridge; refi at stabilization.
Rent comps 1 comps
| Address | Beds | Baths | Sqft | Rent | $/sqft | DOM | Units | Dist |
|---|---|---|---|---|---|---|---|---|
| 6238 Thomas Dr Panama City, FL | 4.0 | 4.0 | 2367 | $4,000 | $1.69 | 21d | 1 | 0.89mi |
Listing history 19 events
-
2026-06-19days on market $795,000 Active 99 DOM
-
2026-06-18days on market $795,000 Active 98 DOM
-
2026-06-17days on market $795,000 Active 97 DOM
-
2026-06-16days on market $795,000 Active 96 DOM
-
2026-06-15days on market $795,000 Active 95 DOM
-
2026-06-14days on market $795,000 Active 93 DOM
-
2026-06-13days on market $795,000 Active 92 DOM
-
2026-06-10days on market $795,000 Active 90 DOM
-
2026-06-09days on market $795,000 Active 89 DOM
-
2026-06-08days on market $795,000 Active 88 DOM
-
2026-06-07days on market $795,000 Active 87 DOM
-
2026-06-05days on market $795,000 Active 84 DOM
-
2026-06-03days on market $795,000 Active 83 DOM
-
2026-06-02days on market $795,000 Active 82 DOM
-
2026-06-01days on market $795,000 Active 81 DOM
-
2026-05-31days on market $795,000 Active 80 DOM
-
2026-05-30days on market $795,000 Active 79 DOM
-
2026-04-02price $795,000 355-char remark
Show marketing remark (355 chars)
Attention investors! Income-producing triplex just a short walk to the beach in PCB (4 min walk to Schooners). Perfect for short-term rentals, vacation stays, or long-term tenants. Properties this close to the sand rarely hit the market--strong rental potential and multiple income streams! A - 1 bed + loft, 2 baths. B - 2 bed, 2 bath. C - 2 bed, 2 bath.
-
2026-03-12$845,000 Active 355-char remark
Show marketing remark (355 chars)
Attention investors! Income-producing triplex just a short walk to the beach in PCB (4 min walk to Schooners). Perfect for short-term rentals, vacation stays, or long-term tenants. Properties this close to the sand rarely hit the market--strong rental potential and multiple income streams! A - 1 bed + loft, 2 baths. B - 2 bed, 2 bath. C - 2 bed, 2 bath.
ⓘ Source: listings_history table (triggers on properties + properties_extension) + one-shot
backfill from property_details.listing_events for pre-trigger history.
Tax reassessment forecast FL · Resets to sale price
- Current annual tax
- $4,560 · $380/mo
- Projected year-2 tax
- $6,598 · $550/mo
- Expected delta
- +$2,038/yr (+$170/mo · 44.7%)
ⓘ Screening estimate from a state-policy table — verify with the county assessor before closing.
Climate risk First Street
- Flood 4/10 Moderate FEMA zone X (unshaded) · 21% chance over 30 yrs
- Wildfire 1/10 Low
- Heat 10/10 Extreme 7 d/yr ≥106°F today · 22 d/yr by 30 yrs out
- Wind 9/10 Extreme 99% chance of damaging wind over 30 yrs
- Air quality 1/10 Low 0 unhealthy d/yr today · 0 by 30 yrs out
Nearby sold comps map
Loading sold comps map…
Walkable amenities ~0.75 mi
Loading nearby amenities…
Taxation est. · year 1
- Rental income
- $53,376
- − Mortgage interest
- −$44,532
- − Property taxes
- −$4,560
- − Insurance
- −$3,975
- − Repairs & maintenance
- −$4,270
- − Management
- −$4,270
- − Depreciation
- −$23,127
- Taxable loss
- −$31,359
- Est. tax savings @ 24.0%
- +$7,526
- After-tax cash flow
- $-8,871/yr
For passive investors: Depreciation is non-cash, so a rental often shows a tax loss while cash-flowing — sheltering income. Rental losses are passive: they offset passive income freely, and up to $25,000/yr can offset ordinary (W-2) income if you actively participate and your MAGI is under $100k (phasing out to $0 by $150k); unused losses carry forward. On sale, claimed depreciation is recaptured at up to 25%, and gains may owe capital-gains tax (a 1031 exchange can defer both). Figures are a year-1 estimate at your 24.0% rate — not tax advice; consult a CPA.
Schools (NCES district)
- District
- Bay
- NCES district ID
- 1200090
- Math proficiency
- 51% ▼ -8.00%
- Reading proficiency
- 51% ▼ -7.00%
- Median HH income
- $47,740
- Composite
- 43.41/100
- National rank
- #3014
- State rank
- #29 of 73 in FL
Livability — Lower Grand Lagoon
- Score
- 68/100
- State rank
- #518
- US rank
- #9567
Category grades
Schools grade is shown separately in the Schools card above.
Census & demographics
- Census place
- Lower Grand Lagoon, FL
- County
- Bay County · 163,593 people
- Metro
- Panama City, FL
- Population (ZIP)
- 18,832
- Household income
- $80,822
- Rent vs Own
- Severe rent burden
- 817.0
Population outlook (Bay County) Hauer SSP2
- Today (2025)
- 206,264 people
- By 2030
- 217,740 · +5.6%
- By 2040
- 238,738 · +15.7%
- By 2050
- 255,545 · +23.9%
- By 2075
- 288,295 · +39.8%
- By 2100
- 288,638 · +39.9%
Race, ethnicity, and origin ACS 2023
- Neighborhood character
- Predominantly White (81%)
- Race & ethnicity
- White 81% Hispanic / Latino 7% Two or more races 6% Black 3% Asian 2%
- Hispanic origin (detail)
- Mexican 2% Puerto Rican 2%
- Common ancestry
- Romanian 4% Lithuanian 4% Italian 2%
- Foreign-born
- 11% · Canada, South Korea
- Languages at home
- 88% English-only · Spanish 5% Russian/Polish/Slavic 4% Tagalog/Filipino 1%
Political lean MEDSL · Bay
- 2024 margin
- Solid R (+47.4) · D 25.8% · R 73.1% · Other 1.1%
- 2008→2024 swing
- -6.6pp toward R · 2008: -40.7pp · 2024: -47.4pp
- All cycles
- 2024: R+47.4 2020: R+43.5 2016: R+46.3 2012: R+43.6 2008: R+40.7
Not yet ingested
- Civics
- —
Market trends
- HPI YoY
- ▼ -202.52%
- Current HPI
- 246.9126
- Rent YoY
- ▲ 2.55%
- Metro
- Panama City, FL
- State GDP YoY
- ▲ 3.28%
- F500 in state
- 36
Industry mix (Fortune 500 HQ in FL)
| Industry | F500 HQs | Revenue |
|---|---|---|
| Industrial Technology | 2 | $29B |
|
||
| Insurance | 2 | $17B |
|
||
| Retail | 1 | $60B |
|
||
| Technology Distribution | 1 | $58B |
|
||
| Homebuilding | 1 | $35B |
|
||
| Technology Manufacturing | 1 | $35B |
|
||
Price history
-5.9% since first listed2 events — show timeline
- 2026-04-02 Price Changed $795,000 CPARMLS
- 2026-03-12 Listed $845,000 CPARMLS
Property tax history
+4.9%/yrLatest (2025): $4,560 · +7.8% YoY. Source: county tax records.
Cash-flow waterfall
monthlySold comps — $/sqft
last 12 mo · ≤1 miLoading sold comps…