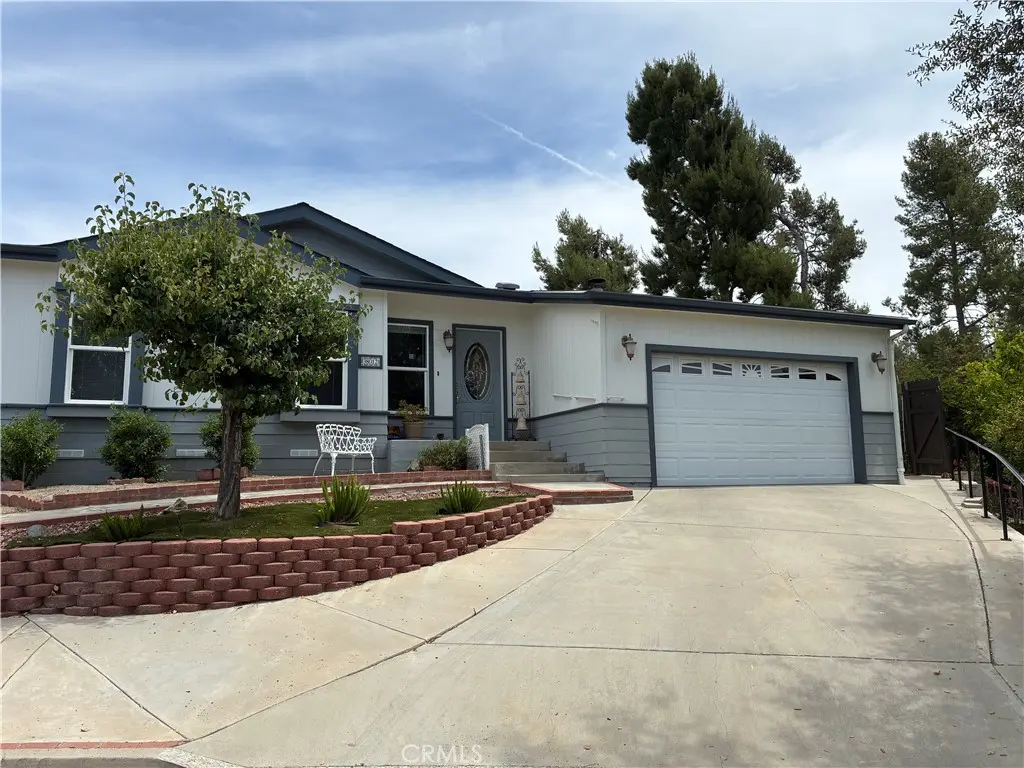
38012 Calle Quedo · Murrieta, CA
Flood risk 1/10 · Minimal
- FEMA flood zone
- D
- Chance of flooding over 30 yrs
- 0.0%
- Est. flood insurance / yr
- $544 – $1,084
Fire risk 6/10 · Moderate
- Est. fire insurance / yr
- $659 – $1,223
Heat risk 7/10 · Major
- Hot days now (above 105°F)
- 7 days/yr
- Hot days in 30 yrs
- 21 days/yr
Wind risk 1/10 · Minimal
- Chance of severe wind over 30 yrs
- —
Air-quality risk 5/10 · Moderate
- Unhealthy air days now
- 7 days/yr
- Unhealthy air days in 30 yrs
- 8 days/yr
Risk factors via First Street. Map © Google.
Why this score? — see what drove the D- grade
The composite is a weighted blend of 9 inputs, each scored 0–100. Each bar is that input's sub-score; the figure is the points it added to the 100-point composite (weight × sub-score).
- Cash flow +12.2/30.0
- ARV discount +7.9/15.0
- Schools +5.3/10.0
- DSCR +3.6/10.0
- Livability +3.4/5.0
- 1% rule +2.6/10.0
- Condition / age +2.5/5.0
- Rent growth +2.3/5.0
- Appreciation +0.0/10.0
$489,000
🖨 Deal sheet 📄 Offer letter ✓ Due diligence
Listing remarks MLS
Beautiful curb appeal manufactured home in 55+ Golf Knolls community. A little paint and this will be the perfect home to retire in. Amazing senior community in Murrieta.
Key facts
- 0.26 acre lot
- 2 garage spots
- Community pool
Property features AI
Finance
- Other: Living area and lot size sourced from public records; Year built sourced from assessor; Property does not include an ADU
- Financial info: Special assessments
- HOA & community: Part of the Golf Knolls association; Monthly association fee of $85; Community amenities include pool, clubhouse, and spa; Senior community
Exterior
- Parking: Attached 2-car garage; Two uncovered parking spaces; Four total parking spaces
- Utilities: Public sewer; District/public water
- Home design: Manufactured house; Single-story; Located at entry level 1; Planned development community; No shared/common walls; Situated on a cul-de-sac
- Construction: Certified 433A foundation
- Exterior features: Covered patio; Association pool
Interior
- Kitchen: Kitchen island; Electric range; Dishwasher
- Bedrooms: Three bedrooms on the main level; All bedrooms on ground floor
- Bathrooms: Two full bathrooms (main level)
- Heating & cooling: Central cooling
- Interior features: Cathedral/vaulted ceilings; Den
- Laundry & utility: Laundry in an individual room
Neighborhood map
What this means for you Summary
Snapshot
- This is a 4-bed/2.0-bath manufactured listed at $489k.
Deal economics
- At list price, monthly cash flow is $-96 ($-1k/yr) — negative.
- To cash-flow at today's rent, offer at most $472k (3.5% below list).
- To meet the 1% rule (rent ≥ 1% of price), the offer needs to be $372k (24.0% below list).
- Recommended offer: $372k (24.0% below list) — sets the bar for 1% rule.
- Cap rate 6.1% vs local median 3.0% in Murrieta — top-decile yield for the area; either an underpriced asset or a hidden risk that comps aren't pricing in. Stress-test before assuming the spread holds.
Location & tenants
- Location reads 68/100 on livability (#279 in CA) — a middle-class / working-renter tenant base. Strengths: amenities A+, employment A+, housing A+; Watch: health & safety D+, commute F, cost of living F.
- Murrieta Valley Unified (suburban): math 51% / reading 64% proficiency, ranked #255 of 1,400 in CA (top 18%) — acceptable for families but not a draw, mixed tenant base, ~2y average lease.
- Market conditions: Rents soft (-0.7%/yr); 354 active listings in the ZIP; 27 comparable units currently listed for rent nearby; rentals lingering (median 44d on market — plan ~5-8 weeks vacancy on turnover, expect pricing pressure); 52% of comp listings sitting > 30 days — soft ceiling on asking rent; high-income renter base; 9,195 units permitted in Riverside County in 2024 (1,512 in 5+ unit buildings).
- This rent runs 39% of the median local income ($114k/yr) — at the standard rent-burdened threshold; future hikes will face affordability resistance.
Forward outlook
- Local home prices are declining (-3.0%/yr); year-one equity from $3k of loan paydown is wiped out by about $15k of value loss. Plan a longer hold.
- Riverside County population projected at +22% by 2050 — long-run rental-demand tailwind backs the buy-and-hold thesis.
Negotiation context
- Only 11 days on market — expect competitive offers; lowballing is unlikely to land.
- Current owner paid $270k; list at $489k implies a 81% gain — meaningful room to come down on a strong offer.
Risks & watch-outs
- Climate carrying-cost: major wildfire risk; extreme-heat days projected 7→21/yr by 2055 (HVAC capex compounding) — expect insurance premiums to compound above CPI over the hold.
Questions for the listing agent
- What do current leases actually rent for vs. the listed asking? Can we see a recent rent roll and the last 12 months of T-12 income?
- What does the HOA fee cover, when was the last increase, and are there any pending special assessments or reserve-fund shortfalls?
- Is there a deadline driving the sale (1031 exchange, divorce, estate, relocation)? That informs how much negotiation room exists.
- Schools are B-rated — typically a magnet for longer-tenancy family renters. What's the average tenant stay here, and is there a school-zone premium baked into asking?
- The area grade is low — what's the realistic commute time and amenity access for the typical tenant pool here? Any planned neighborhood developments (good or bad) we should know about?
- What's the average days-on-market for RENTAL listings here right now (not sales)? A rising rental-DOM trend means longer vacancies and softer asking-rent achievability than the comps imply.
- What's the recent tenant-quality profile in this submarket — average credit score on applications, eviction rate, late-payment / NSF rate, and stable-employment percentage? A property-management company in the area should have these aggregated.
- How much new for-sale + rental construction is in the pipeline within 1–3 miles? Heavy new supply typically softens prices + rents 12–24 months out; constrained supply supports both.
Investment metrics
- 1% rule
- 0.76% ✗
- Cap rate
- 6.06%
- Cash-on-cash
- -0.84%
- DSCR
- 0.96
- GRM
- 11.0
CMA / ARV
- ARV (on-the-fly)
- $493,506
- Comps found
- 8
Show comp detail 8 sales within ~0.75 mi
| Address | Dist | Beds/Ba | Sqft | Sold | Price | $/sf | Match |
|---|---|---|---|---|---|---|---|
| 28771 Via Estrella | 0.19mi | 3/2.0 (-1) | 2,061 (-7%) | 3mo | $405,000 | $197 | 72 |
| 38445 Via Taffia | 0.53mi | 3/2.0 (-1) | 2,280 (+3%) | 9mo | $490,000 | $215 | 59 |
| 38353 Via La Colina | 0.33mi | 3/2.0 (-1) | 2,040 (-8%) | 10mo | $499,000 | $245 | 58 |
| 28960 Camino Alba | 0.36mi | 3/2.5 (-1) | 2,016 (-9%) | 9mo | $338,900 | $168 | 53 |
| 29000 Calle Del Buho | 0.44mi | 3/2.0 (-1) | 2,093 (-6%) | 15mo | $455,000 | $217 | 52 |
| 29060 Calle Cisne | 0.59mi | 3/2.0 (-1) | 2,160 (-3%) | 17mo | $480,000 | $222 | 49 |
| 29141 Calle Cisne | 0.61mi | 3/2.0 (-1) | 2,036 (-8%) | 23mo | $475,000 | $233 | 34 |
| 38685 Via Taffia | 0.67mi | 3/2.0 (-1) | 1,896 (-15%) | 11mo | $475,000 | $251 | 30 |
Match score weights: distance 35% · size 25% · config 20% · recency 20%. Top-matched comps best support the ARV.
Projected returns pro-forma
-3.0% appreciation · 0.0% rent growth · sell at horizon
- IRR
- -20.8%
- Equity multiple
- 0.30×
- Total profit
- $-96,417
- Equity at exit
- $72,911
- IRR
- -21.8%
- Equity multiple
- 0.02×
- Total profit
- $-134,587
- Equity at exit
- $42,280
Cash invested: $136,920 (down + closing). Projections, not guarantees.
Landlord ↔ Tenant lean methodology
- Overall (STATE)
- 18 Strongly Tenant-Friendly
- State California
- 18 Strongly Tenant-Friendly · D+13
- County
- — inherits STATE
- City
- — inherits STATE
ZIP-level market 92562
- Home prices YoY
- -27.7%
- Rents YoY
- -0.7%
- Active inventory
- 354
- Price-to-rent
- 11.0×
Monthly cashflow live
- Estimated rent
- $3,717 high interval (Pro) →
- Mortgage (P&I)
- −$2,564
- Tax from tax record
- −$167 /mo · $2,001/yr
- Insurance
- −$204
- HOA
- −$98
- Vacancy / Maint / Mgmt
- −$781
- Net cashflow
- $-96
Break-even live
UW: 25.0% down · 7.5% · 30yr · 1.5% tax · 5.0% vac · 8.0% maint · 8.0% mgmt
Financing live
Cash to close
- Down payment
- $122,250
- Closing costs
- $14,670
- Reserves months
- —
- Total cash needed
- —
Loan-product check · same deal, 3 products live
Conventional
25% down · 7.5% · 30yr
- Down + closing
- —
- Monthly P&I
- —
- Monthly cashflow
- —
- DSCR
- —
- Eligible?
- —
Personal DTI + credit; lowest rate.
DSCR
20% down · 8.5% · 30yr
- Down + closing
- —
- Monthly P&I
- —
- Monthly cashflow
- —
- DSCR
- —
- Eligible?
- —
No personal income docs; deal must DSCR.
Hard money
10% down · 12.0% · 12mo
- Down + closing
- —
- Monthly P&I
- —
- Monthly cashflow
- —
- DSCR
- —
- Eligible?
- —
Short-term bridge; refi at stabilization.
Rent comps 27 comps
| Address | Beds | Baths | Sqft | Rent | $/sqft | DOM | Units | Dist |
|---|---|---|---|---|---|---|---|---|
| 39484 Via Montalvo Murrieta, CA | 3.0 | 2.5 | 1808 | $6,500 | $3.60 | 43d | 1 | 0.34mi |
| 25509 Brownestone Way Murrieta, CA | 4.0 | 3.0 | 2410 | $3,495 | $1.45 | 43d | 1 | 0.63mi |
| 39730 Avenida Palizada Murrieta, CA | 4.0 | 3.0 | 2141 | $4,950 | $2.31 | 43d | 1 | 0.65mi |
| 34667 Windrow Rd Unit A1 Murrieta, CA | 4.0 | 3.0 | 2319 | $3,500 | $1.51 | 43d | 1 | 0.66mi |
| 29403 Via Espada Murrieta, CA | 4.0 | 3.0 | 2995 | $3,295 | $1.10 | 14d | 1 | 0.75mi |
| 37978 Spur Dr Murrieta, CA | 4.0 | 3.0 | 2995 | $3,450 | $1.15 | 21d | 1 | 0.84mi |
| 39656 Columbia Union Dr Unit C Murrieta, CA | 3.0 | 2.0 | 1408 | $2,925 | $2.08 | 24d | 1 | 0.88mi |
| 29166 Branwin St Murrieta, CA | 5.0 | 2.5 | 2962 | $3,795 | $1.28 | 2d | 1 | 0.92mi |
| 25141 Vista Oriente Murrieta, CA | 4.0 | 3.0 | 2103 | $3,700 | $1.76 | 43d | 1 | 0.93mi |
| 39668 Princeton Way Unit C Murrieta, CA | 3.0 | 2.0 | 1408 | $2,900 | $2.06 | 5d | 1 | 0.94mi |
| 39863 Ranchwood Dr Murrieta, CA | 4.0 | 3.0 | 2090 | $2,995 | $1.43 | 5d | 1 | 1.00mi |
| 26133 Williams Way Murrieta, CA | 3.0 | 2.0 | 1408 | $3,100 | $2.20 | 43d | 1 | 1.02mi |
| 39875 Alpine Union St Unit B Murrieta, CA | 3.0 | 2.5 | 1654 | $2,795 | $1.69 | 43d | 1 | 1.06mi |
| 25455 Knollwood Dr Murrieta, CA | 4.0 | 3.0 | 1904 | $3,795 | $1.99 | 12d | 1 | 1.09mi |
| 29626 Yorkton Rd Murrieta, CA | 5.0 | 3.0 | 2736 | $8,200 | $3.00 | 43d | 1 | 1.09mi |
| 39930 Alpine Union St Murrieta, CA | 3.0 | 2.5 | 1654 | $2,895 | $1.75 | 5d | 1 | 1.09mi |
| 26254 Douglass Union Ln Murrieta, CA | 3.0 | 2.5 | 2601 | $3,095 | $1.19 | 43d | 1 | 1.10mi |
| 25268 Shadescale Dr Murrieta, CA | 4.0 | 2.0 | 1493 | $2,940 | $1.97 | 43d | 1 | 1.14mi |
| 29324 Calle Gaviota Murrieta, CA | 3.0 | 3.0 | 1854 | $3,150 | $1.70 | 43d | 1 | 1.15mi |
| 26440 Saint Ives Ct Murrieta, CA | 4.0 | 2.0 | 1740 | $3,495 | $2.01 | 4d | 1 | 1.26mi |
| 40114 Calle Real Murrieta, CA | 4.0 | 3.0 | 2377 | $3,400 | $1.43 | 12d | 1 | 1.28mi |
| 40213 Calle Real Unit 40213 Murrieta, CA | 3.0 | 2.5 | 1427 | $2,795 | $1.96 | 5d | 1 | 1.32mi |
| 26694 Evergreen Ave Murrieta, CA | 4.0 | 3.0 | 2913 | $4,450 | $1.53 | 43d | 1 | 1.38mi |
| 39990 Gibraltar Dr Murrieta, CA | 5.0 | 3.0 | 2996 | $9,000 | $3.00 | 43d | 1 | 1.44mi |
| 40120 Calle Yorba Vista Murrieta, CA | 3.0 | 2.5 | 1700 | $3,200 | $1.88 | 43d | 1 | 1.45mi |
| 40319 Calle Real Murrieta, CA | 3.0 | 2.5 | 1427 | $2,900 | $2.03 | 24d | 1 | 1.46mi |
| 26775 Silver Oaks Dr Murrieta, CA | 4.0 | 3.0 | 1732 | $3,100 | $1.79 | 12d | 1 | 1.49mi |
HOA detail
- Monthly dues
- $98 · $1,176/yr
Listing history 8 events
-
2026-06-18days on market $489,000 Coming Soon 11 DOM
-
2026-06-17days on market $489,000 Coming Soon 10 DOM
-
2026-06-16days on market $489,000 Coming Soon 9 DOM
-
2026-06-15days on market $489,000 Coming Soon 8 DOM
-
2026-06-13days on market $489,000 Coming Soon 6 DOM
-
2026-06-09days on market $489,000 Coming Soon 2 DOM
-
2026-06-08remarks 619-char remark
-
2026-06-08$489,000 Coming Soon 1 DOM
ⓘ Source: listings_history table (triggers on properties + properties_extension) + one-shot
backfill from property_details.listing_events for pre-trigger history.
Tax reassessment forecast CA · Resets to sale price
- Current annual tax
- $2,001 · $167/mo
- Projected year-2 tax
- $3,716 · $310/mo
- Expected delta
- +$1,715/yr (+$143/mo · 85.7%)
ⓘ Screening estimate from a state-policy table — verify with the county assessor before closing.
Climate risk First Street
- Flood 1/10 Low FEMA zone D · 0% chance over 30 yrs
- Wildfire 6/10 Major
- Heat 7/10 Severe 7 d/yr ≥105°F today · 21 d/yr by 30 yrs out
- Wind 1/10 Low
- Air quality 5/10 Major 7 unhealthy d/yr today · 8 by 30 yrs out
Nearby sold comps map
Loading sold comps map…
Walkable amenities ~0.75 mi
Loading nearby amenities…
Taxation est. · year 1
- Rental income
- $44,607
- − Mortgage interest
- −$27,392
- − Property taxes
- −$2,001
- − Insurance
- −$2,445
- − Repairs & maintenance
- −$3,569
- − Management
- −$3,569
- − HOA
- −$1,176
- − Depreciation
- −$14,225
- Taxable loss
- −$9,769
- Est. tax savings @ 24.0%
- +$2,345
- After-tax cash flow
- $1,190/yr
For passive investors: Depreciation is non-cash, so a rental often shows a tax loss while cash-flowing — sheltering income. Rental losses are passive: they offset passive income freely, and up to $25,000/yr can offset ordinary (W-2) income if you actively participate and your MAGI is under $100k (phasing out to $0 by $150k); unused losses carry forward. On sale, claimed depreciation is recaptured at up to 25%, and gains may owe capital-gains tax (a 1031 exchange can defer both). Figures are a year-1 estimate at your 24.0% rate — not tax advice; consult a CPA.
Schools (NCES district)
- District
- Murrieta Valley Unified
- NCES district ID
- 0600029
- Math proficiency
- 51% ▲ 3.00%
- Reading proficiency
- 64% ▲ 4.00%
- Median HH income
- $78,615
- Composite
- 53.42/100
- National rank
- #3152
- State rank
- #255 of 1400 in CA
Livability — Murrieta
- Score
- 68/100
- State rank
- #279
- US rank
- #9348
Category grades
Schools grade is shown separately in the Schools card above.
Census & demographics
- Census place
- Murrieta, CA
- County
- Riverside County · 2,287,001 people
- City population
- 145,160
- Metro
- Riverside-San Bernardino-Ontario, CA
- Population (ZIP)
- 64,781
- Household income
- $114,266
- Rent vs Own
- Severe rent burden
- 1424.0
Population outlook (Riverside County) Hauer SSP2
- Today (2025)
- 2,664,475 people
- By 2030
- 2,802,692 · +5.2%
- By 2040
- 3,050,904 · +14.5%
- By 2050
- 3,256,783 · +22.2%
- By 2075
- 3,655,058 · +37.2%
- By 2100
- 3,766,594 · +41.4%
Race, ethnicity, and origin ACS 2023
- Neighborhood character
- Diverse neighborhood (Simpson 0.62)
- Race & ethnicity
- White 52% Hispanic / Latino 32% Two or more races 16% Asian 6% Black 4%
- Hispanic origin (detail)
- Mexican 26%
- Common ancestry
- Italian 4% Lithuanian 2% Slovak 2%
- Foreign-born
- 14% · Canada, Vietnam, South Korea
- Languages at home
- 77% English-only · Spanish 15% Tagalog/Filipino 1% Other Asian/Pacific 1%
Political lean MEDSL · Riverside
- 2024 margin
- Toss-up / Even · D 48.0% · R 49.3% · Other 2.6%
- 2008→2024 swing
- -3.6pp toward R · 2008: 2.3pp · 2024: -1.3pp
- All cycles
- 2024: R+1.3 2020: D+8.0 2016: D+4.3 2012: R+0.4 2008: D+2.3
Not yet ingested
- Civics
- —
Market trends
- HPI YoY
- ▼ -124.36%
- Current HPI
- 323.9003
- Rent YoY
- ▼ -0.73%
- Metro
- Riverside-San Bernardino-Ontario, CA
- State GDP YoY
- ▲ 3.21%
- F500 in state
- 116
Industry mix (Fortune 500 HQ in CA)
| Industry | F500 HQs | Revenue |
|---|---|---|
| Technology | 27 | $1,492B |
|
||
| Financial Services | 3 | $174B |
|
||
| Retail | 3 | $44B |
|
||
| Insurance | 3 | $26B |
|
||
| Media / Entertainment | 2 | $115B |
|
||
| Pharmaceuticals / Biotech | 2 | $62B |
|
||
Price history
+1937.5% since first listed8 events — show timeline
- 2026-06-08 Coming Soon $489,000 CRMLS
- 2016-06-30 Sold (Public Records) $271,000 Public Records
- 2016-06-30 Sold (MLS) $270,000 TheMLS
- 2016-05-25 Pending — TheMLS
- 2016-05-06 Listed $270,900 TheMLS
- 2004-02-27 Sold (Public Records) $255,000 Public Records
- 1999-05-28 Sold (Public Records) $34,000 Public Records
- 1998-05-29 Sold (Public Records) $24,000 Public Records
Property tax history
-2.4%/yrLatest (2025): $2,001 · +1.9% YoY. Source: county tax records.
Cash-flow waterfall
monthlySold comps — $/sqft
last 12 mo · ≤1 miLoading sold comps…