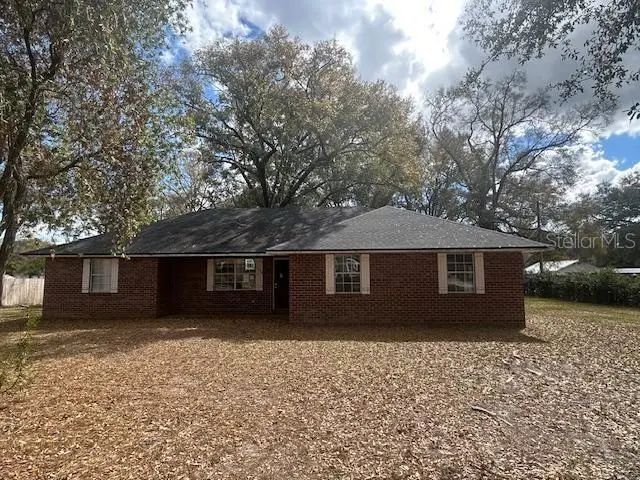
2454 SW Little Rd · Lake City, FL
Flood risk 1/10 · Minimal
- FEMA flood zone
- X (unshaded)
- Chance of flooding over 30 yrs
- 0.0%
- Est. flood insurance / yr
- $507 – $1,088
Fire risk 8/10 · Major
- Est. fire insurance / yr
- $947 – $1,759
Heat risk 8/10 · Major
- Hot days now (above 108°F)
- 7 days/yr
- Hot days in 30 yrs
- 18 days/yr
Wind risk 9/10 · Severe
- Chance of severe wind over 30 yrs
- 99.0%
Air-quality risk 5/10 · Moderate
- Unhealthy air days now
- 7 days/yr
- Unhealthy air days in 30 yrs
- 9 days/yr
Risk factors via First Street. Map © Google.
Why this score? — see what drove the D+ grade
The composite is a weighted blend of 9 inputs, each scored 0–100. Each bar is that input's sub-score; the figure is the points it added to the 100-point composite (weight × sub-score).
- ARV discount +15.0/15.0
- Appreciation +10.0/10.0
- Cash flow +7.6/30.0
- Schools +4.5/10.0
- Livability +3.7/5.0
- Rent growth +2.5/5.0
- Condition / age +2.5/5.0
- 1% rule +2.2/10.0
- DSCR +1.7/10.0
$254,500
🖨 Deal sheet (PDF) 📄 Offer letter ✓ Due diligence
Listing remarks MLS
Come see this home! Nice home just recently updated in beautiful Southwood Estates Subdivision. This home has a nice family room with wood burning fireplace, a huge great room that would be great for entertaining friends and an extra large in-house laundry room. Split floor plan is another nice feature for family or guests. Enjoy a large beautifully shaded backyard for children or pets.
Key facts
- 0.5 acre lot
- Built 1989
- Listed 78 days
Property features AI
Exterior
- Utilities: Private water; Private sewer; Electricity available; Other utilities
- Home design: Single family residence; One story; North-facing
- Construction: Brick construction; Shingle roof; Slab foundation; Built area per public records: 2,568 total; living area 2,175
- Exterior features: Asphalt road access; Approximately 0.5 acre lot
Interior
- Kitchen: Range
- Bedrooms: 3 bedrooms
- Flooring: Carpet; Ceramic tile; Laminate; Tile; Other flooring
- Bathrooms: 2 full bathrooms
- Heating & cooling: Electric heating; Central air conditioning
- Interior features: Open floor plan; Living room/dining room combo; Other interior features
- Laundry & utility: Dedicated laundry room
Neighborhood map
What this means for you Summary
Snapshot
- This is a 3-bed/2.0-bath single-family listed at $254k.
Deal economics
- At list price, monthly cash flow is $-306 ($-4k/yr) — negative.
- To cash-flow at today's rent, offer at most $200k (21.3% below list).
- To meet the 1% rule (rent ≥ 1% of price), the offer needs to be $182k (28.5% below list).
- Recommended offer: $182k (28.5% below list) — sets the bar for 1% rule.
- Cap rate 4.8% vs local median 3.8% in Lake City — meaningfully above typical; check what's discounted (condition, days-on-market, listing class) to confirm the premium yield is real.
Location & tenants
- Location reads 73/100 on livability (#304 in FL) — a middle-class / working-renter tenant base. Strengths: cost of living A+, housing A+, health & safety A+; Watch: amenities C-, commute F, employment F.
- Columbia (town): math 53% / reading 54% proficiency, ranked #25 of 73 in FL (top 34%) — acceptable for families but not a draw, mixed tenant base, ~2y average lease.
- Zoned schools: Columbia City Elementary School (math 62% / reading 63%, grade B, #601 of 2,144 statewide, top 28%, 615 students, 62% FRL) — zoned schools at 62% FRL track the district average.
- Market conditions: 206 active listings in the ZIP; 178 units permitted in Columbia County in 2024 (0 in 5+ unit buildings).
Forward outlook
- In year one you build about $27k of equity ($2k loan paydown + $25k appreciation (10.0% local appreciation)).
- Columbia County population projected to shrink 7% by 2050 — rents likely to lag national; underwrite the cash flow, not the appreciation.
- By year 2, paydown + projected appreciation supports a ~$44k cash-out refi (75% LTV) — recoverable capital for the next deal without selling this one.
Negotiation context
- It's been on market 79 days — a 6% lower offer ($239k) is reasonable based on typical stale-listing flexibility.
- 3 sale attempts since 4y ago; this cycle's ask has dropped $40k (14%) from the opening price — seller is motivated, your offer sets the floor, not the list.
Risks & watch-outs
- Climate carrying-cost: severe wind risk, 99% chance of damaging wind over 30y; severe wildfire risk; extreme-heat days projected 7→18/yr by 2055 (HVAC capex compounding) — expect insurance premiums to compound above CPI over the hold.
Questions for the listing agent
- What do current leases actually rent for vs. the listed asking? Can we see a recent rent roll and the last 12 months of T-12 income?
- It's been on market 79 days. Have you received any prior offers? Is the seller open to a 28% concession, seller financing, or rate buy-down credit?
- Why hasn't it sold? Are there any deal-killer items the seller is aware of (foundation, flood, title, zoning, code violations)?
- Is there a deadline driving the sale (1031 exchange, divorce, estate, relocation)? That informs how much negotiation room exists.
- Schools are B-rated — typically a magnet for longer-tenancy family renters. What's the average tenant stay here, and is there a school-zone premium baked into asking?
- The area grade is low — what's the realistic commute time and amenity access for the typical tenant pool here? Any planned neighborhood developments (good or bad) we should know about?
- What's the average days-on-market for RENTAL listings here right now (not sales)? A rising rental-DOM trend means longer vacancies and softer asking-rent achievability than the comps imply.
- What's the recent tenant-quality profile in this submarket — average credit score on applications, eviction rate, late-payment / NSF rate, and stable-employment percentage? A property-management company in the area should have these aggregated.
- How much new for-sale + rental construction is in the pipeline within 1–3 miles? Heavy new supply typically softens prices + rents 12–24 months out; constrained supply supports both.
Investment metrics
- 1% rule
- 0.72% ✗
- Cap rate
- 4.85%
- Cash-on-cash
- -5.16%
- DSCR
- 0.77
- GRM
- 11.7
CMA / ARV
- ARV (on-the-fly)
- $465,450
- Comps found
- 6
Show comp detail 6 sales within ~0.75 mi
| Address | Dist | Beds/Ba | Sqft | Sold | Price | $/sf | Match |
|---|---|---|---|---|---|---|---|
| 183 SW Holly Gln | 0.51mi | 3/2.5 | 2,165 (-0%) | 7mo | $515,000 | $238 | 68 |
| 1816 SW Little Rd | 0.47mi | 3/2.0 | 2,074 (-5%) | 15mo | $540,000 | $260 | 58 |
| 649 SW Walter Ave | 0.34mi | 3/2.0 | 2,375 (+9%) | 14mo | $392,000 | $165 | 57 |
| 134 SW Emorywood Gln | 0.52mi | 4/2.0 (+1) | 2,174 (-0%) | 22mo | $450,000 | $207 | 52 |
| 588 SW Walter Ave | 0.29mi | 4/3.0 (+1) | 1,850 (-15%) | 7mo | $240,000 | $130 | 46 |
| 1580 SW Little Rd | 0.60mi | 3/2.0 | 1,916 (-12%) | 23mo | $410,000 | $214 | 33 |
Match score weights: distance 35% · size 25% · config 20% · recency 20%. Top-matched comps best support the ARV.
Projected returns pro-forma
10.0% appreciation · 3.0% rent growth · sell at horizon
- IRR
- 20.6%
- Equity multiple
- 2.67×
- Total profit
- $119,111
- Equity at exit
- $229,274
- IRR
- 18.8%
- Equity multiple
- 6.14×
- Total profit
- $366,145
- Equity at exit
- $494,438
Cash invested: $71,260 (down + closing). Projections, not guarantees.
Landlord ↔ Tenant lean methodology
- Overall (STATE)
- 87 Strongly Landlord-Friendly
- State Florida
- 87 Strongly Landlord-Friendly · R+3
- County
- — inherits STATE
- City
- — inherits STATE
ZIP-level market 32024
- Home prices YoY
- 7.6%
- Active inventory
- 206
- Price-to-rent
- 11.7×
Monthly cashflow live
- Estimated rent
- $1,820 medium interval (Pro) →
- Mortgage (P&I)
- −$1,335
- Tax from tax record
- −$304 /mo · $3,644/yr
- Insurance
- −$106
- HOA
- −$0
- Vacancy / Maint / Mgmt
- −$382
- Net cashflow
- $-306
Break-even live
Sensitivity live
| Price | -10% $-162 | -5% $-234 | +0% $-306 | +5% $-378 | +10% $-450 |
|---|---|---|---|---|---|
| Rent | -10% $-450 | -5% $-378 | +0% $-306 | +5% $-235 | +10% $-163 |
| Rate | -1.0pp $-178 | -0.5pp $-242 | base $-306 | +0.5pp $-372 | +1.0pp $-439 |
UW: 25.0% down · 7.5% · 30yr · 1.5% tax · 5.0% vac · 8.0% maint · 8.0% mgmt
Financing live
Cash to close
- Down payment
- $63,625
- Closing costs
- $7,635
- Reserves months
- —
- Total cash needed
- —
Loan-product check · same deal, 3 products live
Conventional
25% down · 7.5% · 30yr
- Down + closing
- —
- Monthly P&I
- —
- Monthly cashflow
- —
- DSCR
- —
- Eligible?
- —
Personal DTI + credit; lowest rate.
DSCR
20% down · 8.5% · 30yr
- Down + closing
- —
- Monthly P&I
- —
- Monthly cashflow
- —
- DSCR
- —
- Eligible?
- —
No personal income docs; deal must DSCR.
Hard money
10% down · 12.0% · 12mo
- Down + closing
- —
- Monthly P&I
- —
- Monthly cashflow
- —
- DSCR
- —
- Eligible?
- —
Short-term bridge; refi at stabilization.
Listing history 34 events
-
2026-06-22days on market $254,500 Active 79 DOM
-
2026-06-21days on market $254,500 Active 78 DOM
-
2026-06-19days on market $254,500 Active 76 DOM
-
2026-06-18days on market $254,500 Active 75 DOM
-
2026-06-17days on market $254,500 Active 74 DOM
-
2026-06-16days on market $254,500 Active 73 DOM
-
2026-06-15days on market $254,500 Active 72 DOM
-
2026-06-14days on market $254,500 Active 70 DOM
-
2026-06-12days on market $254,500 Active 69 DOM
-
2026-06-09days on market $254,500 Active 66 DOM
-
2026-06-08days on market $254,500 Active 65 DOM
-
2026-06-07days on market $254,500 Active 64 DOM
-
2026-06-05days on market $254,500 Active 61 DOM
-
2026-06-03days on market $254,500 Active 60 DOM
-
2026-06-02days on market $254,500 Active 59 DOM
-
2026-06-01days on market $254,500 Active 58 DOM
-
2026-05-31days on market $254,500 Active 57 DOM
-
2026-05-30days on market $254,500 Active 56 DOM
-
2026-05-09price $274,900
-
2026-04-04$295,000 Active
-
2024-08-15price $289,900
-
2024-06-12price $295,000
-
2024-03-07price $309,900
-
2024-01-13price $314,900
-
2023-10-30price $319,900
-
2023-09-29price $324,900
-
2023-09-09$329,900 Active
-
2023-07-05soldstatus $265,000
-
2023-05-29historical Active Under Contract 389-char remark
Show marketing remark (389 chars)
Come see this home! Nice home just recently updated in beautiful Southwood Estates Subdivision. This home has a nice family room with wood burning fireplace, a huge great room that would be great for entertaining friends and an extra large in-house laundry room. Split floor plan is another nice feature for family or guests. Enjoy a large beautifully shaded backyard for children or pets.
-
2023-05-28soldstatus $265,000 Closed 389-char remark
Show marketing remark (389 chars)
Come see this home! Nice home just recently updated in beautiful Southwood Estates Subdivision. This home has a nice family room with wood burning fireplace, a huge great room that would be great for entertaining friends and an extra large in-house laundry room. Split floor plan is another nice feature for family or guests. Enjoy a large beautifully shaded backyard for children or pets.
-
2023-03-31price $289,900 389-char remark
Show marketing remark (389 chars)
Come see this home! Nice home just recently updated in beautiful Southwood Estates Subdivision. This home has a nice family room with wood burning fireplace, a huge great room that would be great for entertaining friends and an extra large in-house laundry room. Split floor plan is another nice feature for family or guests. Enjoy a large beautifully shaded backyard for children or pets.
-
2022-11-14price $299,900 389-char remark
Show marketing remark (389 chars)
Come see this home! Nice home just recently updated in beautiful Southwood Estates Subdivision. This home has a nice family room with wood burning fireplace, a huge great room that would be great for entertaining friends and an extra large in-house laundry room. Split floor plan is another nice feature for family or guests. Enjoy a large beautifully shaded backyard for children or pets.
-
2022-09-15$309,000 Active 389-char remark
Show marketing remark (389 chars)
Come see this home! Nice home just recently updated in beautiful Southwood Estates Subdivision. This home has a nice family room with wood burning fireplace, a huge great room that would be great for entertaining friends and an extra large in-house laundry room. Split floor plan is another nice feature for family or guests. Enjoy a large beautifully shaded backyard for children or pets.
-
2005-05-03soldstatus $152,000
ⓘ Source: listings_history table (triggers on properties + properties_extension) + one-shot
backfill from property_details.listing_events for pre-trigger history.
Tax reassessment forecast FL · Resets to sale price
- Current annual tax
- $3,644 · $304/mo
- Projected year-2 tax
- $3,644 · $304/mo
- Expected delta
- $0/yr ($0/mo · 0.0%)
ⓘ Screening estimate from a state-policy table — verify with the county assessor before closing.
Climate risk First Street
- Flood 1/10 Low FEMA zone X (unshaded) · 0% chance over 30 yrs
- Wildfire 8/10 Severe
- Heat 8/10 Severe 7 d/yr ≥108°F today · 18 d/yr by 30 yrs out
- Wind 9/10 Extreme 99% chance of damaging wind over 30 yrs
- Air quality 5/10 Major 7 unhealthy d/yr today · 9 by 30 yrs out
Nearby sold comps map
Loading sold comps map…
Walkable amenities ~0.75 mi
Loading nearby amenities…
Taxation est. · year 1
- Rental income
- $21,842
- − Mortgage interest
- −$14,256
- − Property taxes
- −$3,644
- − Insurance
- −$1,272
- − Repairs & maintenance
- −$1,747
- − Management
- −$1,747
- − Depreciation
- −$7,404
- Taxable loss
- −$8,229
- Est. tax savings @ 24.0%
- +$1,975
- After-tax cash flow
- $-1,702/yr
For passive investors: Depreciation is non-cash, so a rental often shows a tax loss while cash-flowing — sheltering income. Rental losses are passive: they offset passive income freely, and up to $25,000/yr can offset ordinary (W-2) income if you actively participate and your MAGI is under $100k (phasing out to $0 by $150k); unused losses carry forward. On sale, claimed depreciation is recaptured at up to 25%, and gains may owe capital-gains tax (a 1031 exchange can defer both). Figures are a year-1 estimate at your 24.0% rate — not tax advice; consult a CPA.
Schools (NCES district)
- District
- Columbia
- NCES district ID
- 1200360
- Math proficiency
- 53% ▼ -10.00%
- Reading proficiency
- 54% ▼ -3.00%
- Median HH income
- $40,053
- Composite
- 44.74/100
- National rank
- #2750
- State rank
- #25 of 73 in FL
Livability — Lake City
- Score
- 73/100
- State rank
- #304
- US rank
- #5154
Category grades
Schools grade is shown separately in the Schools card above.
Census & demographics
- City population
- 40,507
- Population (ZIP)
- 20,644
Population outlook (Columbia County) Hauer SSP2
- Today (2025)
- 68,129 people
- By 2030
- 67,501 · -0.9%
- By 2040
- 65,465 · -3.9%
- By 2050
- 63,058 · -7.4%
- By 2075
- 56,291 · -17.4%
- By 2100
- 45,243 · -33.6%
Race, ethnicity, and origin ACS 2023
- Neighborhood character
- Predominantly White (78%)
- Race & ethnicity
- White 78% Hispanic / Latino 10% Two or more races 7% Black 6% Asian 2%
- Hispanic origin (detail)
- Mexican 2% Puerto Rican 3%
- Common ancestry
- Italian 2% Portuguese 1% Lithuanian 1%
- Foreign-born
- 5% · Canada, Jamaica
- Languages at home
- 91% English-only · Spanish 8% Vietnamese 1%
Political lean MEDSL · Columbia
- 2024 margin
- Solid R (+50.2) · D 24.6% · R 74.7%
- 2008→2024 swing
- -16.4pp toward R · 2008: -33.8pp · 2024: -50.2pp
- All cycles
- 2024: R+50.2 2020: R+45.2 2016: R+44.5 2012: R+36.7 2008: R+33.8
Not yet ingested
- Civics
- —
Market trends
- HPI YoY
- ▲ 19.05%
- Current HPI
- 269.4659
- Rent YoY
- —
- Metro
- —
- State GDP YoY
- ▲ 3.28%
- F500 in state
- 36
Industry mix (Fortune 500 HQ in FL)
| Industry | F500 HQs | Revenue |
|---|---|---|
| Industrial Technology | 2 | $29B |
|
||
| Insurance | 2 | $17B |
|
||
| Retail | 1 | $60B |
|
||
| Technology Distribution | 1 | $58B |
|
||
| Homebuilding | 1 | $35B |
|
||
| Technology Manufacturing | 1 | $35B |
|
||
Price history
+80.9% since first listed16 events — show timeline
- 2026-05-09 Price Changed $274,900 Stellar MLS as Distributed by MLS Grid
- 2026-04-04 Listed $295,000 Stellar MLS as Distributed by MLS Grid
- 2024-08-15 Price Changed $289,900 NFMLS
- 2024-06-12 Price Changed $295,000 NFMLS
- 2024-03-07 Price Changed $309,900 NFMLS
- 2024-01-13 Price Changed $314,900 NFMLS
- 2023-10-30 Price Changed $319,900 NFMLS
- 2023-09-29 Price Changed $324,900 NFMLS
- 2023-09-09 Listed $329,900 NFMLS
- 2023-07-05 Sold (Public Records) $265,000 Public Records
- 2023-05-29 Contingent — NFMLS
- 2023-05-28 Sold (MLS) $265,000 NFMLS
- 2023-03-31 Price Changed $289,900 NFMLS
- 2022-11-14 Price Changed $299,900 NFMLS
- 2022-09-15 Listed $309,000 NFMLS
- 2005-05-03 Sold (Public Records) $152,000 Public Records
Property tax history
+4.0%/yrLatest (2025): $3,644 · +2.4% YoY. Source: county tax records.
Cash-flow waterfall
monthlySold comps — $/sqft
last 12 mo · ≤1 miLoading sold comps…