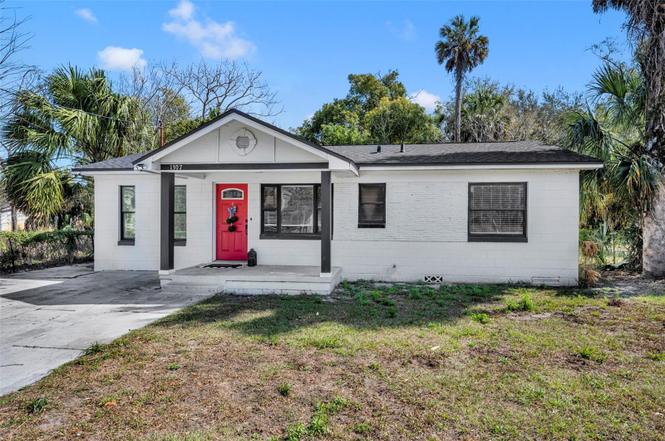
1307 Shepherd Ave · Sanford, FL
Flood risk 1/10 · Minimal
- FEMA flood zone
- X (unshaded)
- Chance of flooding over 30 yrs
- 0.0%
- Est. flood insurance / yr
- $507 – $1,088
Fire risk 1/10 · Minimal
- Est. fire insurance / yr
- $947 – $1,759
Heat risk 8/10 · Major
- Hot days now (above 107°F)
- 7 days/yr
- Hot days in 30 yrs
- 21 days/yr
Wind risk 9/10 · Severe
- Chance of severe wind over 30 yrs
- 99.0%
Air-quality risk 2/10 · Minimal
- Unhealthy air days now
- 1 days/yr
- Unhealthy air days in 30 yrs
- 1 days/yr
Risk factors via First Street. Map © Google.
Why this score? — see what drove the D+ grade
The composite is a weighted blend of 9 inputs, each scored 0–100. Each bar is that input's sub-score; the figure is the points it added to the 100-point composite (weight × sub-score).
- ARV discount +15.0/15.0
- Cash flow +10.7/30.0
- Schools +5.1/10.0
- Livability +3.7/5.0
- DSCR +3.1/10.0
- 1% rule +2.9/10.0
- Rent growth +2.6/5.0
- Condition / age +2.5/5.0
- Appreciation +0.0/10.0
$219,900
🖨 Deal sheet 📄 Offer letter ✓ Due diligence
Listing remarks MLS
Come and see YOUR Beautiful Home in the historic Goldsboro Sanford Fl. Calling all investors! This property is a golden opportunity with immediate income potential. Currently rented at $1900, this investment promises instant cash flow. With a new roof/AC and fully renovated, this listing is a prime asset for your investment portfolio. Act fast to capitalize on this profitable opportunity. Schedule a viewing today and secure your future in real estate investing!
Key facts
- Private yard
- 5,500 sq ft lot
- Built 1965
Tags
Property features AI
Finance
- Other: Property type: Residential — Single Family Residence; Zoning: GC2
- HOA & community: No association
Exterior
- Utilities: Public water; Public sewer; Electricity connected; Water connected; Cable available; Phone available; Underground utilities
- Home design: Single-family residence; One story; Facing north
- Construction: Block construction; Shingle roof; Slab foundation; Built on lot of approximately 0.13 acres
- Exterior features: Exterior lighting; Paved road access
Interior
- Kitchen: Dishwasher; Disposal; Microwave; Range; Refrigerator; Stone countertops
- Bedrooms: 3 bedrooms
- Flooring: Vinyl
- Bathrooms: 1 full bathroom
- Heating & cooling: Central heating; Central air conditioning
- Interior features: Ceiling fans; Split-bedroom floorplan; Stone countertops; Window treatments
- Laundry & utility: Laundry room; Washer; Dryer; Electric water heater
Neighborhood map
What this means for you Summary
Snapshot
- This is a 2-bed/1.0-bath single-family listed at $220k.
Deal economics
- At list price, monthly cash flow is $-106 ($-1k/yr) — negative.
- To cash-flow at today's rent, offer at most $201k (8.5% below list).
- To meet the 1% rule (rent ≥ 1% of price), the offer needs to be $173k (21.3% below list).
- Recommended offer: $173k (21.3% below list) — sets the bar for 1% rule.
- Cap rate 5.7% vs local median 3.6% in Sanford — top-decile yield for the area; either an underpriced asset or a hidden risk that comps aren't pricing in. Stress-test before assuming the spread holds.
Location & tenants
- Location reads 73/100 on livability (#316 in FL) — a middle-class / working-renter tenant base. Strengths: cost of living A+, housing A+, health & safety A+; Watch: employment C-, crime F, amenities F.
- Seminole (suburban): math 57% / reading 61% proficiency, ranked #13 of 73 in FL (top 18%) — acceptable for families but not a draw, mixed tenant base, ~2y average lease.
- Zoned schools: Idyllwilde Elementary School (math 32% / reading 41%, grade F, #1,656 of 2,144 statewide, top 78%, 772 students, 80% FRL); Seminole High School (math 35% / reading 51%, grade F, #255 of 667 statewide, top 39%, 4,036 students, 53% FRL) — zoned schools average 66% FRL vs 38% district-wide (28 pts higher); higher-poverty schools than district average — tighter screening recommended.
- Zoned-school proficiency averages 40% at this address vs 59% district-wide (-19 pts) — the specific schools serving this property underperform the Seminole average; the district grade overstates school quality for this exact location.
- Market conditions: Rents flat; 561 active listings in the ZIP; 40 comparable units currently listed for rent nearby; rentals at typical pace (median 18d on market — plan ~3-4 weeks tenant-placement turnaround); solid renter incomes; 1,979 units permitted in Seminole County in 2024 (1,191 in 5+ unit buildings).
Forward outlook
- Local home prices are declining (-3.0%/yr); year-one equity from $2k of loan paydown is wiped out by about $7k of value loss. Plan a longer hold.
- Seminole County population projected at +24% by 2050 — long-run rental-demand tailwind backs the buy-and-hold thesis.
Negotiation context
- It's been on market 115 days — a 9% lower offer ($200k) is reasonable based on typical stale-listing flexibility.
- 3 sale attempts since 4y ago with the ask held roughly flat each time — persistent listings suggest the price (not the market) is what's stuck; bring a comps-based counter.
Risks & watch-outs
- Climate carrying-cost: severe wind risk, 99% chance of damaging wind over 30y; extreme-heat days projected 7→21/yr by 2055 (HVAC capex compounding) — expect insurance premiums to compound above CPI over the hold.
Questions for the listing agent
- What do current leases actually rent for vs. the listed asking? Can we see a recent rent roll and the last 12 months of T-12 income?
- It's been on market 115 days. Have you received any prior offers? Is the seller open to a 21% concession, seller financing, or rate buy-down credit?
- Built in 1965 — when were the roof, HVAC, electrical panel, plumbing, and water heater last replaced?
- Why hasn't it sold? Are there any deal-killer items the seller is aware of (foundation, flood, title, zoning, code violations)?
- Is there a deadline driving the sale (1031 exchange, divorce, estate, relocation)? That informs how much negotiation room exists.
- Schools are B-rated — typically a magnet for longer-tenancy family renters. What's the average tenant stay here, and is there a school-zone premium baked into asking?
- Crime grade is F in this area — have there been break-ins, vandalism, or insurance claims at this property in the last 3 years? What carrier currently insures it and at what premium?
- The area grade is low — what's the realistic commute time and amenity access for the typical tenant pool here? Any planned neighborhood developments (good or bad) we should know about?
- What's the average days-on-market for RENTAL listings here right now (not sales)? A rising rental-DOM trend means longer vacancies and softer asking-rent achievability than the comps imply.
- What's the recent tenant-quality profile in this submarket — average credit score on applications, eviction rate, late-payment / NSF rate, and stable-employment percentage? A property-management company in the area should have these aggregated.
- How much new for-sale + rental construction is in the pipeline within 1–3 miles? Heavy new supply typically softens prices + rents 12–24 months out; constrained supply supports both.
Investment metrics
- 1% rule
- 0.79% ✗
- Cap rate
- 5.71%
- Cash-on-cash
- -2.07%
- DSCR
- 0.91
- GRM
- 10.6
CMA / ARV
- ARV (on-the-fly)
- $266,760
- Comps found
- 12
Show comp detail 12 sales within ~0.75 mi
| Address | Dist | Beds/Ba | Sqft | Sold | Price | $/sf | Match |
|---|---|---|---|---|---|---|---|
| 2005 Hartwell Ave | 0.46mi | 3/1.5 (+1) | 1,057 (-2%) | 0mo | $294,900 | $279 | 68 |
| 1502 W 16th St | 0.35mi | 3/2.0 (+1) | 1,160 (+7%) | 0mo | $265,000 | $228 | 62 |
| 101 Country Club Dr | 0.48mi | 3/2.0 (+1) | 1,028 (-5%) | 1mo | $292,000 | $284 | 60 |
| 115 Hays Dr | 0.56mi | 3/1.5 (+1) | 1,038 (-4%) | 3mo | $296,000 | $285 | 58 |
| 1712 W 15th St | 0.47mi | 3/2.0 (+1) | 1,014 (-6%) | 1mo | $181,900 | $179 | 58 |
| 1201 W 20th St | 0.44mi | 3/2.0 (+1) | 1,152 (+7%) | 2mo | $259,000 | $225 | 57 |
| 1306 W 16th St | 0.24mi | 3/1.5 (+1) | 923 (-14%) | 4mo | $204,900 | $222 | 54 |
| 1416 Southwest Rd | 0.63mi | 2/2.0 | 1,168 (+8%) | 1mo | $125,000 | $107 | 53 |
| 2012 Cordova Dr | 0.69mi | 3/2.0 (+1) | 1,113 (+3%) | 3mo | $315,000 | $283 | 51 |
| 1112 W 7th St | 0.44mi | 3/2.0 (+1) | 1,205 (+12%) | 0mo | $230,000 | $191 | 51 |
| 904 W 22nd St | 0.56mi | 3/2.0 (+1) | 1,184 (+10%) | 3mo | $292,800 | $247 | 46 |
| 314 W 6th St | 0.70mi | 3/2.0 (+1) | 1,212 (+12%) | 2mo | $345,000 | $285 | 36 |
Match score weights: distance 35% · size 25% · config 20% · recency 20%. Top-matched comps best support the ARV.
Projected returns pro-forma
-3.0% appreciation · 0.38% rent growth · sell at horizon
- IRR
- -22.6%
- Equity multiple
- 0.24×
- Total profit
- $-46,832
- Equity at exit
- $32,788
- IRR
- -25.0%
- Equity multiple
- -0.08×
- Total profit
- $-66,795
- Equity at exit
- $19,013
Cash invested: $61,572 (down + closing). Projections, not guarantees.
Landlord ↔ Tenant lean methodology
- Overall (STATE)
- 87 Strongly Landlord-Friendly
- State Florida
- 87 Strongly Landlord-Friendly · R+3
- County
- — inherits STATE
- City
- — inherits STATE
ZIP-level market 32771
- Rents YoY
- 0.4%
- Active inventory
- 561
- Price-to-rent
- 10.6×
Monthly cashflow live
- Estimated rent
- $1,731 high interval (Pro) →
- Mortgage (P&I)
- −$1,153
- Tax from tax record
- −$229 /mo · $2,743/yr
- Insurance
- −$92
- HOA
- −$0
- Vacancy / Maint / Mgmt
- −$363
- Net cashflow
- $-106
Break-even live
UW: 25.0% down · 7.5% · 30yr · 1.5% tax · 5.0% vac · 8.0% maint · 8.0% mgmt
Financing live
Cash to close
- Down payment
- $54,975
- Closing costs
- $6,597
- Reserves months
- —
- Total cash needed
- —
Loan-product check · same deal, 3 products live
Conventional
25% down · 7.5% · 30yr
- Down + closing
- —
- Monthly P&I
- —
- Monthly cashflow
- —
- DSCR
- —
- Eligible?
- —
Personal DTI + credit; lowest rate.
DSCR
20% down · 8.5% · 30yr
- Down + closing
- —
- Monthly P&I
- —
- Monthly cashflow
- —
- DSCR
- —
- Eligible?
- —
No personal income docs; deal must DSCR.
Hard money
10% down · 12.0% · 12mo
- Down + closing
- —
- Monthly P&I
- —
- Monthly cashflow
- —
- DSCR
- —
- Eligible?
- —
Short-term bridge; refi at stabilization.
Rent comps 40 comps
| Address | Beds | Baths | Sqft | Rent | $/sqft | DOM | Units | Dist |
|---|---|---|---|---|---|---|---|---|
| 1320 S Oleander Ave Sanford, FL | 3.0 | 2.0 | 1200 | $1,850 | $1.54 | 23d | 1 | 0.31mi |
| 1515 S Oleander Ave Sanford, FL | 2.0 | 2.0 | 1100 | $1,500 | $1.36 | 23d | 1 | 0.32mi |
| 1001 W 8th St Unit 1 Sanford, FL | 3.0 | 1.0 | 1075 | $2,250 | $2.09 | 21d | 1 | 0.35mi |
| 2008 William Clark Ave Sanford, FL | 3.0 | 2.0 | 1328 | $2,199 | $1.66 | 2d | 1 | 0.48mi |
| 1908 W 16th St Sanford, FL | 3.0 | 2.0 | 1100 | $1,500 | $1.36 | 20d | 1 | 0.55mi |
| 1935 W 14th St Sanford, FL | 3.0 | 1.5 | 1112 | $1,900 | $1.71 | 2d | 1 | 0.56mi |
| 107 Garrison Dr Sanford, FL | 3.0 | 2.0 | 1439 | $1,800 | $1.25 | 17d | 1 | 0.60mi |
| 106 Garrison Dr Sanford, FL | 3.0 | 2.0 | 1080 | $1,895 | $1.75 | 5d | 1 | 0.61mi |
| 1013 W 3rd St Unit B Sanford, FL | 2.0 | 1.0 | 800 | $1,195 | $1.49 | 14d | 1 | 0.67mi |
| 2405 Chase Ave Sanford, FL | 3.0 | 2.0 | 1200 | $2,095 | $1.75 | 14d | 1 | 0.70mi |
| 2406 S Lake Ave Sanford, FL | 3.0 | 2.0 | 1111 | $2,000 | $1.80 | 14d | 1 | 0.72mi |
| 612 S Park Ave Unit 4 Sanford, FL | 2.0 | 1.0 | 720 | $1,295 | $1.80 | 21d | 1 | 0.80mi |
| 2450 Hartwell Ave Sanford, FL | 2.0 | 2.0 | 784 | $1,400 | $1.79 | 23d | 1 | 0.80mi |
| 2450 Hartwell Ave Sanford, FL | 2.0 | 2.0 | 784 | $1,400 | $1.79 | 17d | 1 | 0.80mi |
| 2450 Hartwell Ave Sanford, FL | 2.0 | 2.0 | 784 | $1,400 | $1.79 | 12d | 1 | 0.80mi |
| 2420 S Lake Ave Sanford, FL | 3.0 | 1.0 | 1100 | $1,545 | $1.40 | 14d | 1 | 0.81mi |
| 2420 S Lake Ave Unit B Sanford, FL | 3.0 | 1.0 | 1100 | $1,545 | $1.40 | 17d | 1 | 0.81mi |
| 1201 S Palmetto Ave Sanford, FL | 2.0 | 1.0 | 1200 | $2,500 | $2.08 | 23d | 1 | 0.82mi |
| 308 E 13th St Sanford, FL | 2.0 | 2.0 | 1129 | $1,750 | $1.55 | 5d | 1 | 0.82mi |
| 308 E 13th St Sanford, FL | 2.0 | 2.0 | 1129 | $1,850 | $1.64 | 23d | 1 | 0.82mi |
| 101 E 21st St Sanford, FL | 3.0 | 2.0 | 896 | $2,500 | $2.79 | 23d | 1 | 0.85mi |
| 2441 Marshall Ave Sanford, FL | 3.0 | 2.0 | 1462 | $2,235 | $1.53 | 5d | 1 | 0.87mi |
| 2437 Chase Ave Unit A Sanford, FL | 2.0 | 1.0 | 875 | $1,199 | $1.37 | 23d | 1 | 0.89mi |
| 832 W 25th St Sanford, FL | 2.0 | 2.0 | 1134 | $1,475 | $1.30 | 2d | 1 | 0.92mi |
| 832 W 25th St Sanford, FL | 2.0 | 2.0 | 1134 | $1,500 | $1.32 | 20d | 1 | 0.92mi |
| 828 W 25th St Sanford, FL | 2.0 | 1.5 | 1134 | $1,350 | $1.19 | 16d | 1 | 0.93mi |
| 828 W 25th St Sanford, FL | 2.0 | 1.5 | 1134 | $1,350 | $1.19 | 23d | 1 | 0.93mi |
| 816 W 25th St Sanford, FL | 2.0 | 1.5 | 1134 | $1,299 | $1.15 | 2d | 1 | 0.93mi |
| 1505 W 25th St Sanford, FL | 3.0 | 2.0 | 1150 | $1,753 | $1.52 | 12d | 1 | 0.96mi |
| 912 Pine Ave Sanford, FL | 2.0 | 1.0 | 1122 | $1,595 | $1.42 | 23d | 1 | 1.01mi |
| 2511 Ridgewood Ave Sanford, FL | 2.0 | 1.0 | 1000 | $1,395 | $1.40 | 23d | 1 | 1.04mi |
| 401 W Seminole Blvd Sanford, FL | 1.0–2.0 | 1.0–2.0 | 818 | $1,824 | $2.23 | 1d | 12 | 1.09mi |
| 153 Cape Honeysuckle Pl Sanford, FL | 3.0 | 2.5 | 1380 | $2,395 | $1.74 | 23d | 1 | 1.10mi |
| 2539 Ridgewood Ave Sanford, FL | 2.0 | 2.0 | 816 | $1,095 | $1.34 | 20d | 1 | 1.13mi |
| 201 Sanford Ave Sanford, FL | 1.0 | 1.0 | 779 | $1,795 | $2.30 | 2d | 1 | 1.13mi |
| 1704 Ridgewood Ln Sanford, FL | 2.0 | 1.0 | 837 | $1,350 | $1.61 | 23d | 1 | 1.21mi |
| 810 E 20th St Sanford, FL | 2.0 | 1.0 | 1204 | $1,750 | $1.45 | 5d | 1 | 1.22mi |
| 2530 Georgia Ave Unit B Sanford, FL | 2.0 | 2.0 | 1400 | $1,650 | $1.18 | 23d | 1 | 1.22mi |
| 2541 Myrtle Ave Unit C Sanford, FL | 2.0 | 2.0 | 1000 | $1,465 | $1.47 | 2d | 1 | 1.24mi |
| 2735 Bungalow Blvd Sanford, FL | 2.0 | 1.0 | 700 | $1,025 | $1.46 | 5d | 1 | 1.24mi |
Listing history 25 events
-
2026-06-18days on market $219,900 Active 115 DOM
-
2026-06-17days on market $219,900 Active 114 DOM
-
2026-06-16days on market $219,900 Active 113 DOM
-
2026-06-15days on market $219,900 Active 112 DOM
-
2026-06-13days on market $219,900 Active 110 DOM
-
2026-06-09days on market $219,900 Active 106 DOM
-
2026-06-08days on market $219,900 Active 105 DOM
-
2026-06-07days on market $219,900 Active 104 DOM
-
2026-06-04days on market $219,900 Active 101 DOM
-
2026-06-03days on market $219,900 Active 100 DOM
-
2026-06-02days on market $219,900 Active 99 DOM
-
2026-06-02days on market $219,900 Active 98 DOM
-
2026-05-31days on market $219,900 Active 97 DOM
-
2026-04-15price $225,000
-
2026-02-23$230,000 Active
-
2024-06-07soldstatus $230,000
-
2024-05-28soldstatus $230,000 Closed 465-char remark
Show marketing remark (465 chars)
Come and see YOUR Beautiful Home in the historic Goldsboro Sanford Fl. Calling all investors! This property is a golden opportunity with immediate income potential. Currently rented at $1900, this investment promises instant cash flow. With a new roof/AC and fully renovated, this listing is a prime asset for your investment portfolio. Act fast to capitalize on this profitable opportunity. Schedule a viewing today and secure your future in real estate investing!
-
2024-04-30status Pending 465-char remark
Show marketing remark (465 chars)
Come and see YOUR Beautiful Home in the historic Goldsboro Sanford Fl. Calling all investors! This property is a golden opportunity with immediate income potential. Currently rented at $1900, this investment promises instant cash flow. With a new roof/AC and fully renovated, this listing is a prime asset for your investment portfolio. Act fast to capitalize on this profitable opportunity. Schedule a viewing today and secure your future in real estate investing!
-
2024-03-28$235,000 Active 465-char remark
Show marketing remark (465 chars)
Come and see YOUR Beautiful Home in the historic Goldsboro Sanford Fl. Calling all investors! This property is a golden opportunity with immediate income potential. Currently rented at $1900, this investment promises instant cash flow. With a new roof/AC and fully renovated, this listing is a prime asset for your investment portfolio. Act fast to capitalize on this profitable opportunity. Schedule a viewing today and secure your future in real estate investing!
-
2023-02-21historical
-
2022-11-04price $249,000
-
2022-10-22price $258,000
-
2022-10-06$259,000 Active
-
2022-03-24soldstatus $135,000
-
1982-10-01soldstatus $24,000
ⓘ Source: listings_history table (triggers on properties + properties_extension) + one-shot
backfill from property_details.listing_events for pre-trigger history.
Tax reassessment forecast FL · Resets to sale price
- Current annual tax
- $2,743 · $229/mo
- Projected year-2 tax
- $2,743 · $229/mo
- Expected delta
- $0/yr ($0/mo · 0.0%)
ⓘ Screening estimate from a state-policy table — verify with the county assessor before closing.
Climate risk First Street
- Flood 1/10 Low FEMA zone X (unshaded) · 0% chance over 30 yrs
- Wildfire 1/10 Low
- Heat 8/10 Severe 7 d/yr ≥107°F today · 21 d/yr by 30 yrs out
- Wind 9/10 Extreme 99% chance of damaging wind over 30 yrs
- Air quality 2/10 Low 1 unhealthy d/yr today · 1 by 30 yrs out
Nearby sold comps map
Loading sold comps map…
Walkable amenities ~0.75 mi
Loading nearby amenities…
Taxation est. · year 1
- Rental income
- $20,771
- − Mortgage interest
- −$12,318
- − Property taxes
- −$2,743
- − Insurance
- −$1,100
- − Repairs & maintenance
- −$1,662
- − Management
- −$1,662
- − Depreciation
- −$6,397
- Taxable loss
- −$5,110
- Est. tax savings @ 24.0%
- +$1,226
- After-tax cash flow
- $-45/yr
For passive investors: Depreciation is non-cash, so a rental often shows a tax loss while cash-flowing — sheltering income. Rental losses are passive: they offset passive income freely, and up to $25,000/yr can offset ordinary (W-2) income if you actively participate and your MAGI is under $100k (phasing out to $0 by $150k); unused losses carry forward. On sale, claimed depreciation is recaptured at up to 25%, and gains may owe capital-gains tax (a 1031 exchange can defer both). Figures are a year-1 estimate at your 24.0% rate — not tax advice; consult a CPA.
Schools (NCES district)
- District
- Seminole
- NCES district ID
- 1201710
- Math proficiency
- 57% ▼ -7.00%
- Reading proficiency
- 61% ▼ -1.00%
- Median HH income
- $58,478
- Composite
- 51.05/100
- National rank
- #1769
- State rank
- #13 of 73 in FL
Livability — Sanford
- Score
- 73/100
- State rank
- #316
- US rank
- #5359
Category grades
Schools grade is shown separately in the Schools card above.
Census & demographics
- Census place
- Sanford, FL
- County
- Seminole County · 436,154 people
- City population
- 96,638
- Metro
- Orlando-Kissimmee-Sanford, FL
- Population (ZIP)
- 62,606
- Household income
- $77,868
- Rent vs Own
- Severe rent burden
- 2645.0
Population outlook (Seminole County) Hauer SSP2
- Today (2025)
- 515,494 people
- By 2030
- 545,713 · +5.9%
- By 2040
- 598,068 · +16.0%
- By 2050
- 640,663 · +24.3%
- By 2075
- 724,461 · +40.5%
- By 2100
- 755,530 · +46.6%
Race, ethnicity, and origin ACS 2023
- Neighborhood character
- Diverse neighborhood (Simpson 0.70)
- Race & ethnicity
- White 43% Black 24% Hispanic / Latino 23% Two or more races 13% Asian 7%
- Hispanic origin (detail)
- Mexican 2% Puerto Rican 7% Cuban 2% Dominican 2%
- Common ancestry
- Romanian 2% Slovak 1% Italian 1%
- Foreign-born
- 18% · Canada, Jamaica, China
- Languages at home
- 76% English-only · Spanish 15% Other Indo-European 3% Other Asian/Pacific 1%
Political lean MEDSL · Seminole
- 2024 margin
- Toss-up / Even · D 47.6% · R 51.1% · Other 1.3%
- 2008→2024 swing
- -0.8pp no change · 2008: -2.8pp · 2024: -3.5pp
- All cycles
- 2024: R+3.5 2020: D+2.8 2016: R+1.6 2012: R+6.5 2008: R+2.8
Not yet ingested
- Civics
- —
Market trends
- HPI YoY
- ▼ -281.27%
- Current HPI
- 299.2738
- Rent YoY
- ▲ 0.38%
- Metro
- Orlando-Kissimmee-Sanford, FL
- State GDP YoY
- ▲ 3.28%
- F500 in state
- 36
Industry mix (Fortune 500 HQ in FL)
| Industry | F500 HQs | Revenue |
|---|---|---|
| Industrial Technology | 2 | $29B |
|
||
| Insurance | 2 | $17B |
|
||
| Retail | 1 | $60B |
|
||
| Technology Distribution | 1 | $58B |
|
||
| Homebuilding | 1 | $35B |
|
||
| Technology Manufacturing | 1 | $35B |
|
||
Price history
+837.5% since first listed12 events — show timeline
- 2026-04-15 Price Changed $225,000 Stellar MLS as Distributed by MLS Grid
- 2026-02-23 Listed $230,000 Stellar MLS as Distributed by MLS Grid
- 2024-06-07 Sold (Public Records) $230,000 Public Records
- 2024-05-28 Sold (MLS) $230,000 Stellar MLS as Distributed by MLS Grid
- 2024-04-30 Pending — Stellar MLS as Distributed by MLS Grid
- 2024-03-28 Listed $235,000 Stellar MLS as Distributed by MLS Grid
- 2023-02-21 Listing Removed — Stellar MLS as Distributed by MLS Grid
- 2022-11-04 Price Changed $249,000 Stellar MLS as Distributed by MLS Grid
- 2022-10-22 Price Changed $258,000 Stellar MLS as Distributed by MLS Grid
- 2022-10-06 Listed $259,000 Stellar MLS as Distributed by MLS Grid
- 2022-03-24 Sold (Public Records) $135,000 Public Records
- 1982-10-01 Sold (Public Records) $24,000 Public Records
Property tax history
+11.5%/yrLatest (2025): $2,743 · +10.4% YoY. Source: county tax records.
Cash-flow waterfall
monthlySold comps — $/sqft
last 12 mo · ≤1 miLoading sold comps…