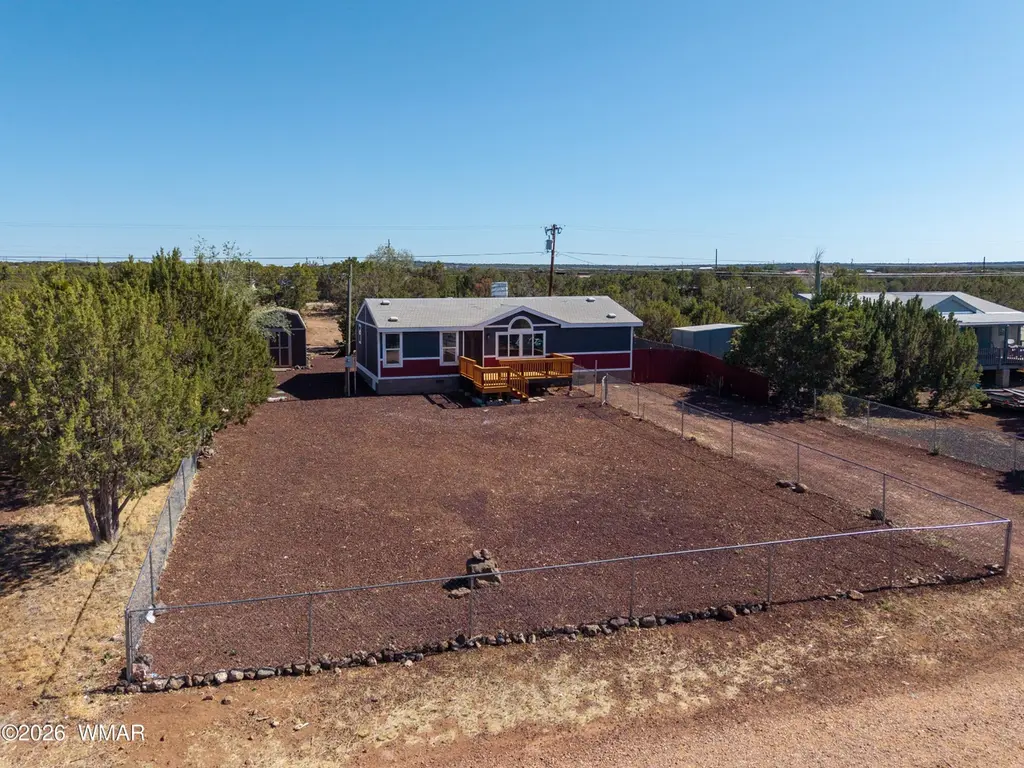
8495 Canyon Dr · White Mountain Lake, AZ
Flood risk 1/10 · Minimal
- FEMA flood zone
- X (unshaded)
- Chance of flooding over 30 yrs
- 0.0%
- Est. flood insurance / yr
- $507 – $1,088
Fire risk 5/10 · Moderate
- Est. fire insurance / yr
- $610 – $1,132
Heat risk 3/10 · Minor
- Hot days now (above 90°F)
- 6 days/yr
- Hot days in 30 yrs
- 15 days/yr
Wind risk 1/10 · Minimal
- Chance of severe wind over 30 yrs
- —
Air-quality risk 2/10 · Minimal
- Unhealthy air days now
- 1 days/yr
- Unhealthy air days in 30 yrs
- 1 days/yr
Risk factors via First Street. Map © Google.
Why this score? — see what drove the F grade
The composite is a weighted blend of 9 inputs, each scored 0–100. Each bar is that input's sub-score; the figure is the points it added to the 100-point composite (weight × sub-score).
- Cash flow +15.3/30.0
- DSCR +4.7/10.0
- Livability +3.1/5.0
- Schools +3.0/10.0
- 1% rule +2.9/10.0
- Rent growth +2.5/5.0
- Condition / age +2.5/5.0
- ARV discount +0.0/15.0
- Appreciation +0.0/10.0
$249,000
🖨 Deal sheet (PDF) 📄 Offer letter ✓ Due diligence
Listing remarks
This beautifully updated 3-bedroom, 2-bath home sits on a generously sized lot and offers the perfect blend of comfort, space, and style. Inside, you'll find vaulted ceilings that create an open and airy feel throughout the home, along with a large living area ideal for relaxing or entertaining. The kitchen features brand-new appliances, abundant cabinet space, and a functional layout perfect for everyday living. Fresh interior and exterior paint, along with new flooring throughout, give the home a clean, modern look and make it truly move-in ready. With its spacious design and impressive updates, this property shows beautifully and is ready to welcome its next owner.
Key facts
- Large living area
- Functional layout
- Vaulted ceilings
Tags
Property features AI
Finance
- Other: Approx. 0.23 acres; Subdivision: Wh Mt Lakes
- HOA & community: No HOA
Exterior
- Utilities: Septic tank; Water available; Sewer available; Power available; APS electrical service and other utilities available
- Home design: Manufactured mobile home; Double wide
- Construction: Shingle roof
- Exterior features: Deck; Partly fenced yard; Road access: county and privately maintained road
Interior
- Kitchen: Built-in dishwasher; Gas range; Refrigerator; Eat-in kitchen
- Flooring: Vinyl
- Bathrooms: Tub/shower in bathroom
- Heating & cooling: Electric heating
- Interior features: Vinyl flooring; Tub/shower
Neighborhood map
What this means for you Summary
Snapshot
- This is a 3-bed/2.0-bath manufactured listed at $249k.
Deal economics
- At list price, monthly cash flow is $92 ($1k/yr) — positive.
- The deal already cash-flows at list — no discount required.
- To meet the 1% rule (rent ≥ 1% of price), the offer needs to be $197k (21.0% below list).
- Recommended offer: $197k (21.0% below list) — sets the bar for 1% rule.
- Cap rate 6.7% vs local median 4.4% in White Mountain Lake — top-decile yield for the area; either an underpriced asset or a hidden risk that comps aren't pricing in. Stress-test before assuming the spread holds.
Location & tenants
- Location reads 62/100 on livability (#141 in AZ) — a middle-class / working-renter tenant base. Strengths: cost of living A+, housing A+, crime B+; Watch: amenities F, commute F, employment F.
- Show Low Unified District (4393) (rural): math 32% / reading 39% proficiency, ranked #89 of 249 in AZ (top 36%) — families likely to look elsewhere, expect single-tenant / working-renter base with shorter leases.
- Zoned schools: Nikolaus Homestead Elementary School (math 40% / reading 44%, grade F, #371 of 1,109 statewide, top 34%, 389 students, 42% FRL); Show Low Junior High School (math 29% / reading 34%, grade F, #78 of 218 statewide, top 36%, 587 students, 45% FRL); Show Low High School (math 22% / reading 37%, grade F, #120 of 381 statewide, top 34%, 877 students, 31% FRL).
- Market conditions: 897 active listings in the ZIP; 485 units permitted in Navajo County in 2024 (11 in 5+ unit buildings).
Forward outlook
- Local home prices are declining (-3.0%/yr); year-one equity from $2k of loan paydown is wiped out by about $7k of value loss. Plan a longer hold.
- Navajo County population projected at -16% by 2050 — secular population decline; favor cash flow + early exit over multi-decade hold.
Negotiation context
- It's been on market 24 days — a 2% lower offer ($245k) is reasonable based on typical stale-listing flexibility.
- Current owner paid $91k; list at $249k implies a 175% gain — meaningful room to come down on a strong offer.
Risks & watch-outs
- Climate carrying-cost: moderate wildfire risk — expect insurance premiums to compound above CPI over the hold.
Questions for the listing agent
- Is there a deadline driving the sale (1031 exchange, divorce, estate, relocation)? That informs how much negotiation room exists.
- Schools are F-rated, which usually means shorter tenancies and higher turnover. Who's the typical renter profile here, and what's been the actual vacancy rate?
- The area grade is low — what's the realistic commute time and amenity access for the typical tenant pool here? Any planned neighborhood developments (good or bad) we should know about?
- What's the average days-on-market for RENTAL listings here right now (not sales)? A rising rental-DOM trend means longer vacancies and softer asking-rent achievability than the comps imply.
- What's the recent tenant-quality profile in this submarket — average credit score on applications, eviction rate, late-payment / NSF rate, and stable-employment percentage? A property-management company in the area should have these aggregated.
- How much new for-sale + rental construction is in the pipeline within 1–3 miles? Heavy new supply typically softens prices + rents 12–24 months out; constrained supply supports both.
Investment metrics
- 1% rule
- 0.79% ✗
- Cap rate
- 6.74%
- Cash-on-cash
- 1.59%
- DSCR
- 1.07
- GRM
- 10.5
CMA / ARV
- ARV (on-the-fly)
- $212,256
- Comps found
- 4
Show comp detail 4 sales within ~0.75 mi
| Address | Dist | Beds/Ba | Sqft | Sold | Price | $/sf | Match |
|---|---|---|---|---|---|---|---|
| 8496 Silver Creek Dr | 0.10mi | 3/1.5 | 981 (-7%) | 20mo | $71,000 | $72 | 65 |
| 8478 Rifle Dr | 0.08mi | 2/2.0 (-1) | 900 (-15%) | 11mo | $227,000 | $252 | 58 |
| 8525 Canyon Dr | 0.16mi | 3/1.0 | 897 (-15%) | 10mo | $180,000 | $201 | 56 |
| 8408 Ortega Dr | 0.45mi | 3/1.0 | 1,200 (+14%) | 18mo | $30,069 | $25 | 38 |
Match score weights: distance 35% · size 25% · config 20% · recency 20%. Top-matched comps best support the ARV.
Projected returns pro-forma
-3.0% appreciation · 3.0% rent growth · sell at horizon
- IRR
- -13.8%
- Equity multiple
- 0.50×
- Total profit
- $-34,597
- Equity at exit
- $37,127
- IRR
- -5.1%
- Equity multiple
- 0.67×
- Total profit
- $-23,080
- Equity at exit
- $21,529
Cash invested: $69,720 (down + closing). Projections, not guarantees.
Landlord ↔ Tenant lean methodology
- Overall (STATE)
- 87 Strongly Landlord-Friendly
- State Arizona
- 87 Strongly Landlord-Friendly · R+3
- County
- — inherits STATE
- City
- — inherits STATE
ZIP-level market 85901
- Home prices YoY
- -14.5%
- Active inventory
- 897
- Price-to-rent
- 10.5×
Monthly cashflow live
- Estimated rent
- $1,967 medium interval (Pro) →
- Mortgage (P&I)
- −$1,306
- Tax from tax record
- −$52 /mo · $625/yr
- Insurance
- −$104
- HOA
- −$0
- Vacancy / Maint / Mgmt
- −$413
- Net cashflow
- $92
Break-even live
Sensitivity live
| Price | -10% $233 | -5% $163 | +0% $92 | +5% $22 | +10% $-49 |
|---|---|---|---|---|---|
| Rent | -10% $-63 | -5% $15 | +0% $92 | +5% $170 | +10% $248 |
| Rate | -1.0pp $218 | -0.5pp $156 | base $92 | +0.5pp $28 | +1.0pp $-38 |
UW: 25.0% down · 7.5% · 30yr · 1.5% tax · 5.0% vac · 8.0% maint · 8.0% mgmt
Financing live
Cash to close
- Down payment
- $62,250
- Closing costs
- $7,470
- Reserves months
- —
- Total cash needed
- —
Loan-product check · same deal, 3 products live
Conventional
25% down · 7.5% · 30yr
- Down + closing
- —
- Monthly P&I
- —
- Monthly cashflow
- —
- DSCR
- —
- Eligible?
- —
Personal DTI + credit; lowest rate.
DSCR
20% down · 8.5% · 30yr
- Down + closing
- —
- Monthly P&I
- —
- Monthly cashflow
- —
- DSCR
- —
- Eligible?
- —
No personal income docs; deal must DSCR.
Hard money
10% down · 12.0% · 12mo
- Down + closing
- —
- Monthly P&I
- —
- Monthly cashflow
- —
- DSCR
- —
- Eligible?
- —
Short-term bridge; refi at stabilization.
Listing history 20 events
-
2026-06-22days on market $249,000 Active 24 DOM
-
2026-06-21days on market $249,000 Active 23 DOM
-
2026-06-19days on market $249,000 Active 21 DOM
-
2026-06-18days on market $249,000 Active 20 DOM
-
2026-06-17days on market $249,000 Active 19 DOM
-
2026-06-16days on market $249,000 Active 18 DOM
-
2026-06-15days on market $249,000 Active 17 DOM
-
2026-06-14days on market $249,000 Active 15 DOM
-
2026-06-12days on market $249,000 Active 14 DOM
-
2026-06-09days on market $249,000 Active 11 DOM
-
2026-06-08days on market $249,000 Active 10 DOM
-
2026-06-07days on market $249,000 Active 9 DOM
-
2026-06-07days on market $249,000 Active 8 DOM
-
2026-06-04days on market $249,000 Active 5 DOM
-
2026-06-02days on market $249,000 Active 4 DOM
-
2026-06-01days on market $249,000 Active 3 DOM
-
2026-05-31days on market $249,000 Active 2 DOM
-
2026-05-29$249,000 Active
-
2023-04-10soldstatus $90,610
-
2010-03-15soldstatus $100,000
ⓘ Source: listings_history table (triggers on properties + properties_extension) + one-shot
backfill from property_details.listing_events for pre-trigger history.
Tax reassessment forecast AZ · Resets to sale price
- Current annual tax
- $625 · $52/mo
- Projected year-2 tax
- $1,643 · $137/mo
- Expected delta
- +$1,019/yr (+$85/mo · 163.1%)
ⓘ Screening estimate from a state-policy table — verify with the county assessor before closing.
Climate risk First Street
- Flood 1/10 Low FEMA zone X (unshaded) · 0% chance over 30 yrs
- Wildfire 5/10 Major
- Heat 3/10 Moderate 6 d/yr ≥90°F today · 15 d/yr by 30 yrs out
- Wind 1/10 Low
- Air quality 2/10 Low 1 unhealthy d/yr today · 1 by 30 yrs out
Nearby sold comps map
Loading sold comps map…
Walkable amenities ~0.75 mi
Loading nearby amenities…
Taxation est. · year 1
- Rental income
- $23,604
- − Mortgage interest
- −$13,948
- − Property taxes
- −$625
- − Insurance
- −$1,245
- − Repairs & maintenance
- −$1,888
- − Management
- −$1,888
- − Depreciation
- −$7,244
- Taxable loss
- −$3,234
- Est. tax savings @ 24.0%
- +$776
- After-tax cash flow
- $1,884/yr
For passive investors: Depreciation is non-cash, so a rental often shows a tax loss while cash-flowing — sheltering income. Rental losses are passive: they offset passive income freely, and up to $25,000/yr can offset ordinary (W-2) income if you actively participate and your MAGI is under $100k (phasing out to $0 by $150k); unused losses carry forward. On sale, claimed depreciation is recaptured at up to 25%, and gains may owe capital-gains tax (a 1031 exchange can defer both). Figures are a year-1 estimate at your 24.0% rate — not tax advice; consult a CPA.
Schools (NCES district)
- District
- Show Low Unified District (4393)
- NCES district ID
- 0407700
- Math proficiency
- 32% ▼ -9.00%
- Reading proficiency
- 39% ▼ -4.00%
- Median HH income
- $41,240
- Composite
- 29.9/100
- National rank
- #6387
- State rank
- #89 of 249 in AZ
Livability — White Mountain Lake
- Score
- 62/100
- State rank
- #141
- US rank
- #16914
Category grades
Schools grade is shown separately in the Schools card above.
Census & demographics
- Census place
- White Mountain Lake, AZ
- Population (ZIP)
- 18,821
Population outlook (Navajo County) Hauer SSP2
- Today (2025)
- 105,760 people
- By 2030
- 103,301 · -2.3%
- By 2040
- 97,070 · -8.2%
- By 2050
- 88,850 · -16.0%
- By 2075
- 65,180 · -38.4%
- By 2100
- 37,281 · -64.7%
Race, ethnicity, and origin ACS 2023
- Neighborhood character
- Predominantly White (77%)
- Race & ethnicity
- White 77% Hispanic / Latino 16% Two or more races 11% Native American 2%
- Hispanic origin (detail)
- Mexican 12%
- Common ancestry
- Slovak 2% Lithuanian 2% Italian 2%
- Foreign-born
- 4% · Canada
- Languages at home
- 92% English-only · Spanish 7% Tagalog/Filipino 1%
Political lean MEDSL · Navajo
- 2024 margin
- R (+17.2) · D 40.9% · R 58.1%
- 2008→2024 swing
- -5.5pp toward R · 2008: -11.7pp · 2024: -17.2pp
- All cycles
- 2024: R+17.2 2020: R+8.2 2016: R+7.9 2012: R+8.4 2008: R+11.7
Not yet ingested
- Civics
- —
Market trends
- HPI YoY
- ▼ -65.52%
- Current HPI
- 386.3007
- Rent YoY
- —
- Metro
- —
- State GDP YoY
- ▲ 4.54%
- F500 in state
- 20
Industry mix (Fortune 500 HQ in AZ)
| Industry | F500 HQs | Revenue |
|---|---|---|
| Technology | 2 | $13B |
|
||
| Mining / Metals | 1 | $23B |
|
||
| Environmental Services | 1 | $16B |
|
||
| Metals / Steel | 1 | $14B |
|
||
| Technology Distribution | 1 | $9B |
|
||
| Homebuilding | 1 | $8B |
|
||
Price history
+149.0% since first listed3 events — show timeline
- 2026-05-29 Listed $249,000 WMMLS
- 2023-04-10 Sold (Public Records) $90,610 Public Records
- 2010-03-15 Sold (Public Records) $100,000 Public Records
Property tax history
+2.7%/yrLatest (2025): $625 · +3.1% YoY. Source: county tax records.
Cash-flow waterfall
monthlySold comps — $/sqft
last 12 mo · ≤1 miLoading sold comps…